Journal List > Blood Res > v.58(s1) > 1516085685

Parvizi, Moghaddam, Nazari, Ashraf, and Aghdam: The association of pro-oxidant/antioxidant balance and blood parameters in patients with beta-thalassemia major: a cross-sectional study

Abstract

Background

Oxidative stress due to iron accumulation in patients with beta-thalassemia major (BTM) causes complications such as tissue damage and destruction. This study aimed to assess the association between the serum prooxidant/antioxidant balance (PAB) and blood parameters in patients with BTM.

Methods

This cross-sectional study included 92 patients with BTM. In this study, PAB was measured using an enzyme-linked immunosorbent assay (ELISA). Serum ferritin, blood urea nitrogen (BUN), creatinine (Cr), alanine aminotransferase (ALT), aspartate aminotransferase (AST), thyroid-stimulating hormone (TSH), total cholesterol (TC), triglyceride (TG), complete blood cell count (CBC), and history of blood transfusion were recorded. The association of the blood parameters was assessed across the tertiles (T) of serum PAB (highest T vs. lowest T).

Results

The results showed that high serum ferritin was directly associated with serum PAB [odds ratio (OR), 12.80; 95% confidence interval (CI), 2.98‒54.91; T3 vs. T1]. Also, direct associations were found for high TC (OR, 4.97; 95% CI, 1.42‒17.32; T3 vs. T1), high ALT (OR, 4.95; 95% CI, 1.33‒18.46; T3 vs. T1) and high TSH (OR, 3.78; 95% CI, 1.10‒13.02; T3 vs. T1).

Conclusion

The findings of the present study showed that serum PAB levels were directly associated with ferritin, ALT, TC, and TSH levels. This indicates that improvements in blood parameters, especially ferritin and TSH levels, occur by ameliorating oxidative stress in patients with BTM.

INTRODUCTION

Thalassemia is an inherited blood disorder in which hemoglobin (Hb) and red blood cells (RBC) production are disrupted. Hemoglobin is an oxygen-carrying molecule in erythrocytes, and consists of two types of globin chains (alpha and beta). In patients with thalassemia, the production of these subunits is disrupted, leading to abnormal erythropoiesis and anemia which begins during childhood and lasts throughout life [1, 2]. Patients with thalassemia suffer from several complications including skeletal, cardiac, and endocrine problems. Some of these complications are caused by the disease itself, whereas others are due to either regular blood transfusions or the consumption of medications such as hydroxyurea. Regular blood transfusions cause iron accumulation and oxidative stress in the body. In addition, hemolytic anemia caused by the destruction of abnormal erythrocytes and their precursors in the bone marrow and spleen leads to bone deformation and spleen enlargement. Liver dysfunction, diabetes, zinc deficiency, hypothyroidism, gallstones, congestive heart failure, osteoporosis, osteopenia, viral infections, and hepatocellular carcinoma are other complications caused by regular blood transfusion and subsequent hemosiderosis [3, 4]. Endocrine disorders, such as abnormal gonadotropin secretion, pancreatic insufficiency, growth retardation, insufficient growth hormone secretion, and adrenal and thyroid disorders are also common in patients with thalassemia [5].
Thalassemia is generally diagnosed during childhood after the emergence of severe microcytic hypochromic anemia associated with elevated HbF and HbA2. The disease is managed with regular blood transfusions to maintain patients Hb level above 9 g/dL. Iron chelators are also used to prevent the effects of iron deposition in the tissues [6-8]. Novel therapeutic methods with greater effectiveness and fewer side effects can help reduce these complications and improve patients’ quality of life and life expectancy. One proposed theory involves the suppression of oxidative damage in patients. However, there exists some controversy in this regard [1]. Oxidative stress is caused by an imbalance between oxidants and antioxidants in the body. Antioxidants prevent the adverse effects of naturally produced free radicals in the human body during biological processes. Although our body is naturally capable of maintaining a balance in the reactive oxygen species (with antioxidant defenses), oxidative stress occurs when the production of free radicals exceeds the body’s capacity to removing them [9-11]. Several methods can be used to measure the total oxidant or antioxidants capacity separately. However, a determination of the pro-oxidant and antioxidant status separately gives inaccurate results, is indirect, time-consuming, and costly. Multiple prooxidant and antioxidant markers are commonly used to assess oxidative stress levels. Recently, a simple, fast, and cost-effective prooxidant/antioxidant balance (PAB) method was proposed for simultaneous measurement of prooxidant load and antioxidant capacity [12]. Thus, we aimed to assess the association of serum PAB and blood parameters in patients with beta-thalassemia major (BTM).

MATERIALS AND METHODS

Participants and sample size

Patients with BTM who were referred to the Mofid Children Hospital for five consecutive years (2014 to 2019) were assessed based on the eligibility criteria. The individuals who did not provide a written informed consent, were smokers, and were simultaneously diagnosed with other hematologic diseases, respiratory disorders, or malignancies were excluded from the study. A total of 92 patients with BTMs were enrolled in the study. The sample size of 92 participants was determined according to the following formula based on an alpha (type I error) value of 0.05, a beta (type II error) value of 0.1 and a P1 and P2 in the pilot study (ratios of elevated PAB in patients with BTM) as 0.7.
n=Z1α/2+Z1β2S12+S22μ1μ22
General Information including age, sex, and number of blood transfusions were collected from patient records from 2014–2019 from the Thalassemia Care Ward of the Hospital. Blood samples were obtained from all participants. Serum samples were stored at -80°C until further analysis. Laboratory tests were performed to determine PAB, blood urea nitrogen (BUN), creatinine (Cr), alanine aminotransferase (ALT), aspartate aminotransferase (AST), thyroid-stimulating hormone (TSH), total cholesterol (TC), triglycerides (TG), and complete blood cell counts (CBC). The study was approved by the ethics committee of the Shahid Beheshti University of Medical Sciences (ethics code: IR.SBMU.MSP.REC.1398. 223). The study strictly followed the principles of confidentiality.

PAB measurement

Serum PAB levels were determined using the method described by Alamdari et al. [13]. In this method, tetramethylbenzidine (TMB) and its cation are used as indicators of oxidation-reduction during two simultaneous reactions. Standard solutions included vitamin C, Trolox, uric acid, glutathione, albumin, hydrogen peroxide, and tert-butylhydro-peroxide. Freshly prepared chloramine solution (18 µL) was added to the solutions and incubated (for 20 minutes) with the TMB solution to create TMB cations. Then, the peroxidase enzyme (1.25 IU) was added to 9 mL of the TMB solution, incubated at room temperature (for 5 minutes), and used immediately as the working solution. Study samples (from participants), standard samples, and blank (distilled water) (10 µL each) were mixed with 200 µL of the working solution in each well of a 96-well plate. The plates were incubated for 12 minutes in the dark at room temperature. After that 100 μL of HCl was added to each well, and the plate was incubated in the dark for 45 minutes. Finally, the absorbance values of each sample was measured at 450 nm (reference wavelength of 620 or 570 nm) using an ELISA plate reader (Bio Rad, USA). A standard curve was plotted based on the values obtained from the standard samples. The PAB values were calculated and expressed as HK units (i.e., the percentage of hydrogen peroxide in the standard solution multiplied by six). The PAB values of the samples interpreted by comparing the values to the standard curve. Notably, serum PAB levels were directly correlated with oxidative stress. This indicated that lowering serum PAB levels can ameliorate oxidative stress. The measurement of serum PAB levels and the basis of the test are illustrated in Fig. 1. Serum PAB was measured in duplicates for each sample and the acceptable intra-assay coefficient of variation (CV) was 5%. If the CV increased, the measurements were repeated.

Laboratory assays

Serum TSH and ferritin levels were measured using specific ELISA kits (DiaZist, Iran), as per the manufacturer’s instructions. The sensitivity of the kits was 0.1 IU/mL, and the intra- and inter-assay variations were 7.6% and 9.1%, respectively, Serum TG, total TC, ALT, AST, BUN, and Cr were measured using specific diagnostic kits (Audit, USA). In addition, a hematology autoanalyzer (Sysmex Kx 21) was used for the CBC tests.

Statistical analyses

Statistical analyses were performed using SPSS software version 16 (SPSS Inc., Chicago, IL, USA). Quantitative variables are presented as means and standard deviations, and categorical data are presented as frequencies and percentages. Quantitative and qualitative variables across tertiles of serum PAB were compared using analysis of variance and chi-square tests, respectively. Logistic binary regression was used to assess the associations between blood parameters and tertiles of serum PAB. The blood parameters were categorized as high or low based on median values as cutoff points. Age, sex, and the number of transfusions were adjusted for as covariates. Statistical significance was set at P<0.05.

RESULTS

A total of 92 patients with BTM were enrolled in this study. Females constituted 51.1% (N=47) of the study population, and the means for age and annual transfusion numbers of the participants and was 19±0.95 and 14.29±2.24 years, respectively (Table 1). The results obtained from the comparison of general characteristics and blood parameters across the tertiles of PAB are shown in Table 2. There were significant differences between the PAB tertiles in terms of sex, Cr, ferritin, and ALT levels (P<0.05). Across the tertiles (T) of serum PAB, no significant differences were found in age, transfusion number, or other blood parameters (P>0.05).
High levels of serum ferritin (after adjustment of covariates including age, sex and number of transfusions) was directly associated with serum PAB (odds ratio [OR], 12.80; 95% confidence interval [CI], 2.98–54.91; T3 vs. T1). Also, direct associations were found for high TC (OR, 4.97; 95% CI, 1.42–17.32; T3 vs. T1), high ALT (OR, 4.95; 95% CI, 1.33–18.46; T3 vs. T1) and high TSH (OR, 3.78; 95% CI, 1.10–13.02; T3 vs. T1) in adjusted models (Table 3). No significant associations were found for the other blood-related variables across the tertiles of serum PAB (Pfor trend>0.05).

DISCUSSION

This cross-sectional study assessed the association between serum PAB levels and blood parameters in patients with BTM. The results showed that high oxidative stress is associated with high levels of serum ferritin, TC, ALT and TSH. This study, for the first time, examined serum PAB (a novel biomarker of oxidative stress) in patients with BTM.
One of the most critical challenges in managing patients with transfusion-dependent thalassemia is excessive iron accumulation in the body and various tissues, which leads to elevated serum ferritin levels and oxidative stress. In fact, iron accumulation is the leading cause of oxidative stress in patients with BTM. Iron-induced oxidative stress can decrease the serum antioxidant capacity. Moreover, free iron may attack fats, proteins, and nucleic acids and lead to the generation of compounds such as malonyl-di-aldehyde (marker for oxidative damage to fats) and 8-Oxo-2’-deoxyguanosine (8oHdG; marker for oxidative damage to nucleic acids). Oxidative stress caused by hemosiderosis can independently damage the tissues of patients with BTM. Serum ferritin is one of the most important indicators of iron accumulation in the body [12, 14-16]. Similar studies have been conducted in this area of research. Guzelcicek et al. [17], in their study of patients with BTM, showed that the serum levels of oxidative stress indicators were significantly higher in patients than in the control group. They also reported a significant relationship between serum levels of these markers and ferritin levels. In another study by Ehteram et al. [18], included 90 patients with BTM and 90 healthy individuals (control group) and demonstrated increased levels of PAB and ferritin in the patients compared with the controls; however, there was no significant relationship between these two indicators in their study. In addition, several other case-control studies have examined PAB- and BTM-related variables [19-21]. This present cross-sectional study showed a direct association between oxidative stress and serum-ferritin levels. This indicates that controlling oxidative stress in BTM can be an effective way to ameliorate high serum ferritin.
Hypothyroidism in frequently reported in patients with BTM. High TSH is one of the main causes of hypothyroidism. Patients with BTM have been reported to have high levels of serum TSH compared to healthy controls [22-24]. Although the relationship between oxidative stress and TSH has not been assessed in patients with BTM, there is some evidence to show that high levels of TSH might be one of the contributing factors to oxidative stress due to hypothyroidism [25]. In addition, there is an independent direct relationship between serum TSH levels and oxidative stress [26]. The results of this cross-sectional study also showed that high oxidative stress was associated with high TSH levels in patients with BTM. Another notable finding of this study was the positive association between high levels of ALT and TC and serum PAB levels. As liver disease progresses, serum enzyme levels increase in patients with BTM. Progression of liver disease is related to iron accumulation and oxidative stress [27].
To the best of our knowledge, no cross-sectional study has examined BTM-assessing variables across tertiles or quartiles of oxidative stress-related variables. In addition, serum PAB, a novel indicator of oxidative stress, was examined in patients with BTM for the first time. Findings from this study suggest that further research in larger sample size is needed to examine the association between blood parameters across the tertiles or quartiles of 8oHdG and malondialdehyde (MDA). In summary, the current study shows that BTM-related variables including ferritin, TC, ALT, and TSH levels, are closely associated with oxidative stress. This indicates that management of oxidative stress in patients with BTM plays a pivotal role in disease progression.

Notes

Authors’ Disclosures of Potential Conflicts of Interest

No potential conflicts of interest relevant to this article were reported.

REFERENCES

1. Galanello R, Origa R. 2010; Beta-thalassemia. Orphanet J Rare Dis. 5:11. DOI: 10.1186/1750-1172-5-11. PMID: 20492708. PMCID: PMC2893117. PMID: 6ab50d8294be49f4885c1beebdf25dfc.
2. Mirmomen S, Alavian SM, Hajarizadeh B, et al. 2006; Epidemiology of hepatitis B, hepatitis C, and human immunodeficiency virus infecions in patients with beta-thalassemia in Iran: a multicenter study. Arch Iran Med. 9:319–23. PMID: 17061602.
3. Moayeri H, Oloomi Z. 2006; Prevalence of growth and puberty failure with respect to growth hormone and gonadotropins secretion in beta-thalassemia major. Arch Iran Med. 9:329–34. PMID: 17061604.
4. Mohammadi Z, Sharif Zak M, Seidi K, Barati M, Akbarzadeh A, Zarghami N. 2017; The effect of chrysin loaded PLGA-PEG on metalloproteinase gene expression in mouse 4T1 tumor model. Drug Res (Stuttg). 67:211–6. DOI: 10.1055/s-0042-122136. PMID: 28166590.
5. Ataei B, Hashemipour M, Kassaian N, Hassannejad R, Nokhodian Z, Adibi P. 2012; Prevalence of anti HCV infection in patients with Beta-thalassemia in Isfahan-Iran. Int J Prev Med. 3(Suppl 1):S118–23. PMID: 22826753.
6. Adil A, Sobani ZA, Jabbar A, Adil SN, Awan S. 2012; Endocrine complications in patients of beta thalassemia major in a tertiary care hospital in Pakistan. J Pak Med Assoc. 62:307–10. DOI: 10.1530/endoabs.90.ep661.
7. Charafeddine K, Isma'eel H, Charafeddine M, et al. 2008; Survival and complications of beta-thalassemia in Lebanon: a decade's experience of centralized care. Acta Haematol. 120:112–6. DOI: 10.1159/000171088. PMID: 19001806.
8. Nemtsas P, Arnaoutoglou M, Perifanis V, Koutsouraki E, Orologas A. 2015; Neurological complications of beta-thalassemia. Ann Hematol. 94:1261–5. DOI: 10.1007/s00277-015-2378-z. PMID: 25903043.
9. Ghone RA, Kumbar KM, Suryakar AN, Katkam RV, Joshi NG. 2008; Oxidative stress and disturbance in antioxidant balance in beta thalassemia major. Indian J Clin Biochem. 23:337–40. DOI: 10.1007/s12291-008-0074-7. PMID: 23105782. PMCID: PMC3453139.
10. Shazia Q, Mohammad ZH, Rahman T, Shekhar HU. 2012; Correlation of oxidative stress with serum trace element levels and antioxidant enzyme status in Beta thalassemia major patients: a review of the literature. Anemia. 2012:270923. DOI: 10.1155/2012/270923. PMID: 22645668. PMCID: PMC3357501. PMID: 9ef15484aadb4b5bbf361d9909e24067.
11. Barati M, Jabbari M, Navekar R, et al. 2020; Collagen supplementation for skin health: a mechanistic systematic review. J Cosmet Dermatol. 19:2820–9. DOI: 10.1111/jocd.13435. PMID: 32436266.
12. Salehi-Sahlabadi A, Teymoori F, Jabbari M, et al. 2021; Dietary polyphenols and the odds of non-alcoholic fatty liver disease: a case-control study. Clin Nutr ESPEN. 41:429–35. DOI: 10.1016/j.clnesp.2020.09.028. PMID: 33487302.
13. Alamdari DH, Paletas K, Pegiou T, Sarigianni M, Befani C, Koliakos G. 2007; A novel assay for the evaluation of the prooxidant- antioxidant balance, before and after antioxidant vitamin administration in type II diabetes patients. Clin Biochem. 40:248–54. DOI: 10.1016/j.clinbiochem.2006.10.017. PMID: 17196578.
14. Fibach E, Dana M. 2019; Oxidative stress in β-thalassemia. Mol Diagn Ther. 23:245–61. DOI: 10.1007/s40291-018-0373-5. PMID: 30484264.
15. Ondei Lde S, Estevão Ida F, Rocha MI, et al. 2013; Oxidative stress and antioxidant status in beta-thalassemia heterozygotes. Rev Bras Hematol Hemoter. 35:409–13. DOI: 10.5581/1516-8484.20130122. PMID: 24478607. PMCID: PMC3905823. PMID: 24da0bb3274541e6859eed6c4b710ba5.
16. Salehi-Sahlabadi A, Mokari A, Elhamkia M, Farahmand F, Jabbari M, Hekmatdost A. 2020; Dietary total antioxidant capacity and risk of non-alcoholic fatty liver disease: a case-control study. J Res Health Sci. 20:e00486. DOI: 10.34172/jrhs.2020.18. PMID: 33169718. PMCID: PMC7585767.
17. Guzelcicek A, Cakirca G, Erel O, Solmaz A. 2019; Assessment of thiol/disulfide balance as an oxidative stress marker in children with β-thalassemia major. Pak J Med Sci. 35:161–5. DOI: 10.12669/pjms.35.1.307. PMID: 30881416. PMCID: PMC6408658.
18. Ehteram H, Bavarsad MS, Mokhtari M, et al. 2014; Prooxidant- antioxidant balance and hs-CRP in patients with beta-thalassemia major. Clin Lab. 60:207–15. DOI: 10.7754/Clin.Lab.2013.130132. PMID: 24660532.
19. Ghorban K, Shanaki M, Mobarra N, et al. 2016; Apolipoproteins A1, B, and other prognostic biochemical cardiovascular risk factors in patients with beta-thalassemia major. Hematology. 21:113–20. DOI: 10.1179/1607845415Y.0000000016. PMID: 25913481.
20. Ghahremanlu E, Banihashem A, Saber H, et al. 2013; Increased serum heat shock protein 27 antibody titers and prooxidant-antioxidant balance in patients with beta-thalassemia major. Acta Haematol. 129:1–9. DOI: 10.1159/000339502. PMID: 22964881.
21. Lai ME, Vacquer S, Carta MP, et al. 2011; Evidence for a proatherogenic biochemical phenotype in beta thalassemia minor and intermedia. Acta Haematol. 126:87–94. DOI: 10.1159/000327252. PMID: 21576933.
22. Upadya SH, Rukmini MS, Sundararajan S, Baliga BS, Kamath N. 2018; Thyroid function in chronically transfused children with beta thalassemia major: a cross-sectional hospital based study. Int J Pediatr. 2018:9071213. DOI: 10.1155/2018/9071213. PMID: 30305822. PMCID: PMC6165584. PMID: 8746c74a89ff4b6e8561b548fe6eef84.
23. Benli AR, Yildiz SS, Cikrikcioglu MA. 2017; An evaluation of thyroid autoimmunity in patients with beta thalassemia minor: a case-control study. Pak J Med Sci. 33:1106–11. DOI: 10.12669/pjms.335.13210. PMID: 29142547. PMCID: PMC5673716.
24. Eshragi P, Tamaddoni A, Zarifi K, Mohammadhasani A, Aminzadeh M. 2011; Thyroid function in major thalassemia patients: is it related to height and chelation therapy? Caspian J Intern Med. 2:189–93. PMID: 24024013. PMCID: PMC3766932.
25. Chakrabarti SK, Ghosh S, Banerjee S, Mukherjee S, Chowdhury S. 2016; Oxidative stress in hypothyroid patients and the role of antioxidant supplementation. Indian J Endocrinol Metab. 20:674–8. DOI: 10.4103/2230-8210.190555. PMID: 27730079. PMCID: PMC5040049. PMID: ce8b8c813fee44aa82d5d482a555893d.
26. Mancini A, Di Segni C, Raimondo S, et al. 2016; Thyroid hormones, oxidative stress, and inflammation. Mediators Inflamm. 2016:6757154. DOI: 10.1155/2016/6757154. PMID: 27051079. PMCID: PMC4802023. PMID: 5e7c0c75c8d042b29e60b154dde25a56.
27. Soliman A, Yassin M, Al Yafei F, et al. 2014; Longitudinal study on liver functions in patients with thalassemia major before and after deferasirox (DFX) therapy. Mediterr J Hematol Infect Dis. 6:e2014025. DOI: 10.4084/mjhid.2014.025. PMID: 24803998. PMCID: PMC4010606. PMID: d7a8e6cecdb6400abe05f6b3f5a103b1.
28. Al-Moshary M, Imtiaz N, Al-Mussaed E, Khan A, Ahmad S, Albqami S. 2020; Clinical and biochemical assessment of liver function test and its correlation with serum ferritin levels in transfusion- dependent thalassemia patients. Cureus. 12:e7574. DOI: 10.7759/cureus.7574. PMID: 32391223. PMCID: PMC7205361.
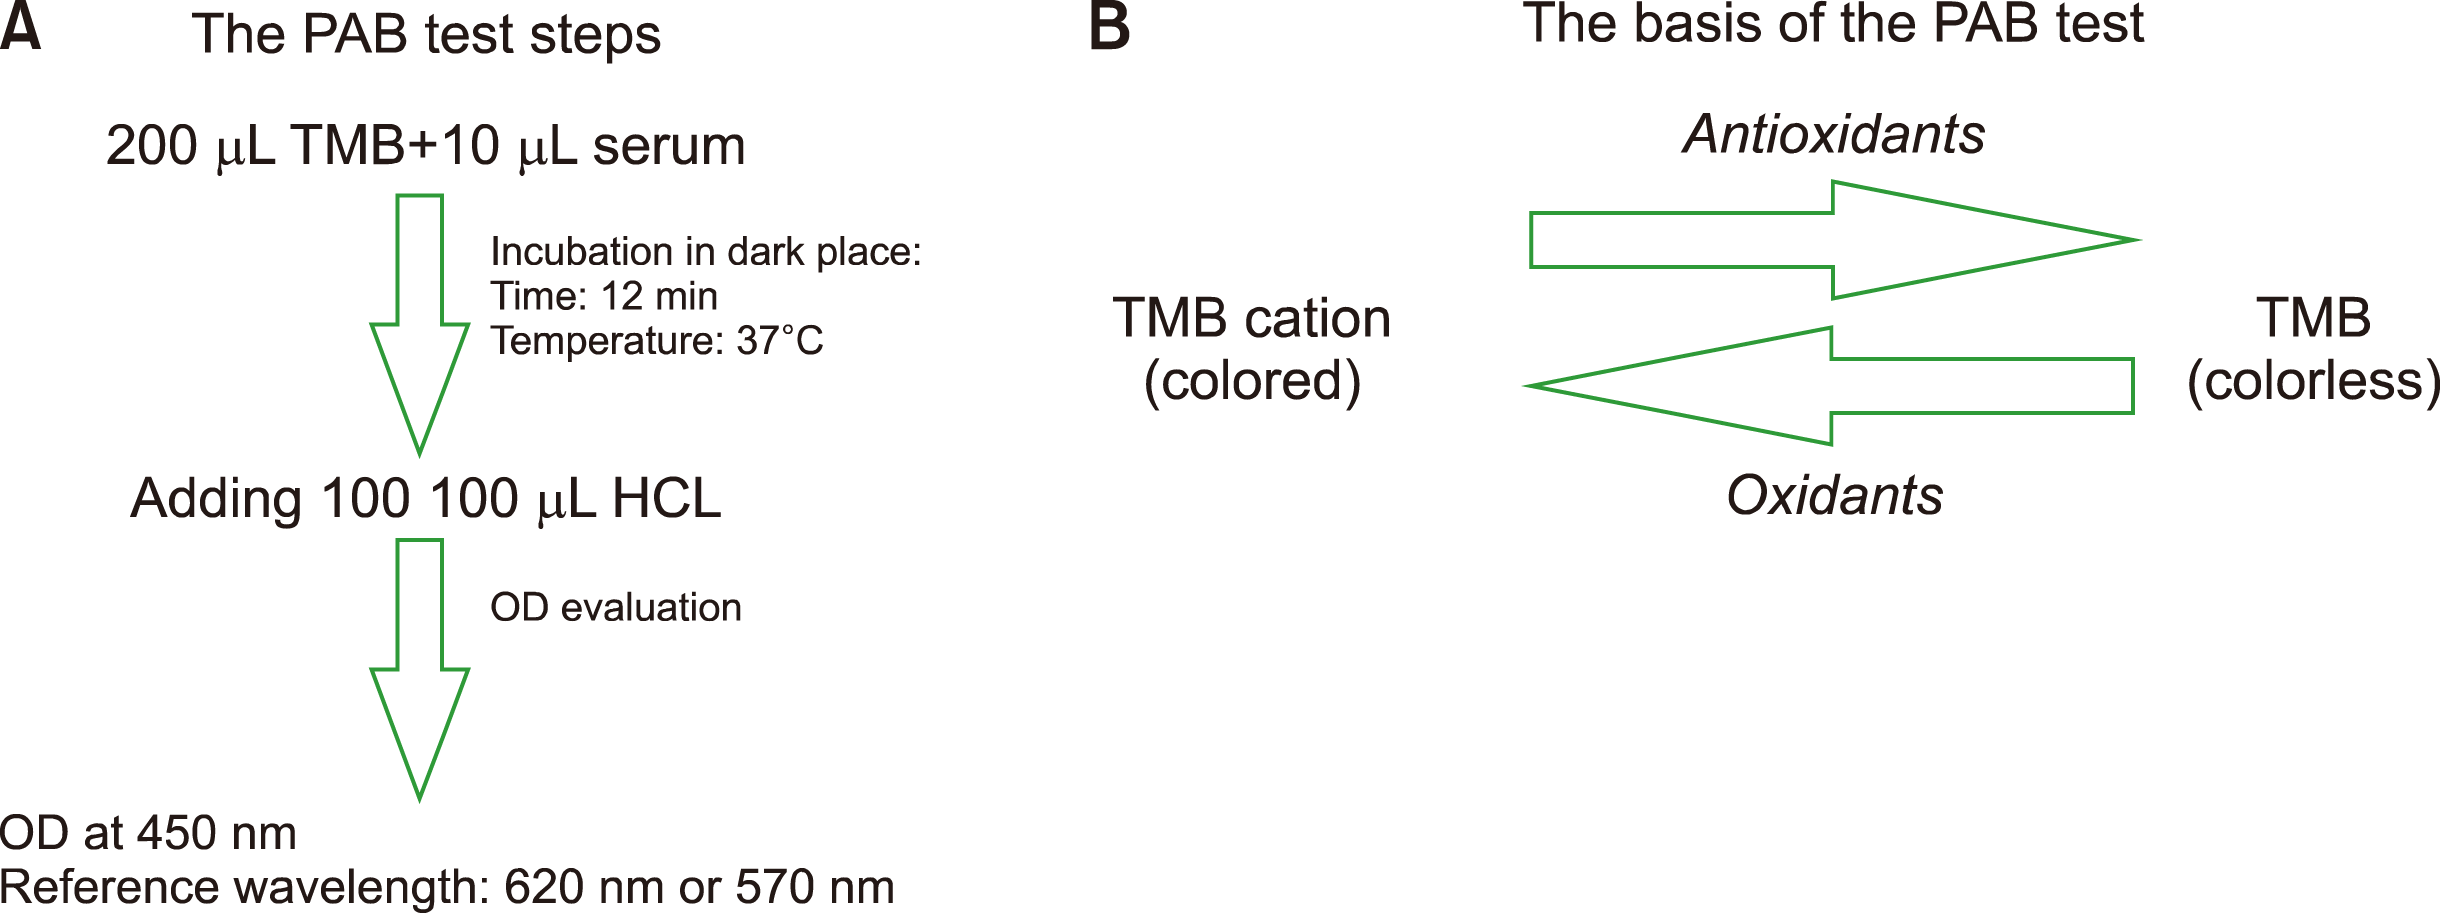
Fig. 1
An illustration for measurement of the serum PAB (A) and its basis (B).Abbreviations: HCL, hydrochloride; OD, optical density; PAB, pro-oxidant antioxidant balance; TMB, tetrame-thylbenzidine.
Abbreviations: HCL, hydrochloride; OD, optical density; PAB, pro-oxidant antioxidant balance; TMB, tetramethylbenzidine.
br-58-4-201-f1.tif
Table 1
General characteristics and serum parameters of the study population (N=92).
Variables Values
Age (year) 19.00±9.08
Transfusion number (per year) 14.29±2.24
Female [frequency (%)] 47 (51.1%)
WBC (NO. per L) 7.97±5.51
RBC (NO. per µL) 3.45±0.35
Hb (gr/dL) 9.57±0.86
Hct (%) 28.08±2.65
MCV (femtoliter) 81.35±3.73
MCH (pg/cell) 27.74±1.36
MCHC (gr/dL) 29.56±1.43
Platelet (NO. per µL) 310.28±124.88
BUN (mg/dL) 16.49±5.03
Cr (mg/dL) 0.85±0.23
TC (mg/dL) 104.52±25.10
TG (mg/dL) 125.26±60.19
Ferritin (µg/L) 1,683±1,481
AST (U/L) 28.06±13.93
ALT (U/L) 22.47±15.27
TSH (mIU/L) 3.09±1.70
PAB (HK units) 38.38±24.92

Data are presented as mean±SD and frequency (percent) for quantitative and qualitative variables, respectively.

Abbreviations: ALT, alanine aminotransferase; AST, aspartate aminotransferase; BTM, beta-thalassemia major; BUN, blood urea nitrogen; Hb, hemoglobin; Hct, Hematocrit; MCH, mean corpuscular hemoglobin; MCHC, mean corpuscular hemoglobin concentration; MCV, mean corpuscular volume; PAB, pro-oxidant/ antioxidant balance; RBC, red blood cell; TC, total cholesterol; TG, triglyceride; TSH, thyroid-stimulating hormone; WBC, white blood cell.

Table 2
The comparison of blood parameters of BTM patients across the tertiles of serum PAB.
Variables Tertiles of serum PAB P
T1 (N=30; range, 0.00–25.00 HK units) T2 (N=31; range, 25.00–48.00 HK units) T3 (N=31; range, 48.00–100.00 HK units)
Age (year) 21.80±6.82 17.33±10.02 17.90±9.67 0.116a)
Transfusion number (per year) 14.57±1.33 14.61±2.69 13.71±2.41 0.207a)
Female [frequency (%)] 6 (20.00) 21 (67.70) 20 (64.50) <0.001b)
WBC (NO. per L) 8.35±7.62 6.45±1.54 9.12±5.45 0.148a)
RBC (NO. per µL) 3.51±0.32 3.40±0.35 3.46±0.37 0.459a)
Hb (gr/dL) 9.67±0.69 9.48±0.90 9.58±0.98 0.691a)
Hct (%) 28.36±2.30 27.88±2.72 28.02±2.94 0.768a)
MCV (femtoliter) 80.87±4.04 82.09±3.44 81.08±3.70 0.395a)
MCH (pg/cell) 27.58±1.35 27.89±1.19 27.75±1.54 0.682a)
MCHC (gr/dL) 29.62±1.48 29.45±0.93 29.63±1.78 0.855a)
Platelet (NO. per µL) 305.90±128.91 294.35±108.77 310.28±124.88 0.514a)
BUN (mg/dL) 16.18±4.30 17.27±4.99 16.01±5.74 0.447a)
Cr (mg/dL) 0.93±0.27 0.77±0.18 0.84±0.20 0.019a)
TC (mg/dL) 88.00±22.40 107.13±20.92 117.90±22.90 <0.001a)
TG (mg/dL) 145.97±67.02 115.00±57.56 115.48±51.97 0.070a)
Ferritin (µg/L) 973±585 1,773±1,310 2,281±1,929 0.002a)
AST (U/L) 28.48±13.21 23.58±10.56 32.13±16.43 0.051a)
ALT (U/L) 18.33±8.38 20.74±15.28 28.19±18.77 0.029a)
TSH (mIU/L) 2.94±1.73 2.81±1.71 3.51±1.64 0.222a)

Data are presented as mean±SD for quantitative variables and frequency (percent) for qualitative variables.

a)Data analysis was done by ANOVA test. b)Data analysis was done by chi-square test.

Abbreviations: ALT, alanine aminotransferase; AST, aspartate aminotransferase; BTM, beta-thalassemia major; BUN, blood urea nitrogen; Hb, hemoglobin; Hct, hematocrit; MCH, mean corpuscular hemoglobin; MCHC, mean corpuscular hemoglobin concentration; MCV, mean corpuscular volume; PAB, pro-oxidant/antioxidant balance; RBC, red blood cell; TC, total cholesterol; TG, triglyceride; TSH, thyroid-stimulating hormone; WBC, white blood cell.

Table 3
The association of blood parameters and serum PAB.
Variables Tertiles of serum PAB Pfor trends
T1
(N=30; range, 0.00–25.00 HK units)
T2
(N=31; range, 25.00–48.00 HK units)
T3
(n=31; range, 48.00–100.00 HK units)
High ferritin (>1,200 µg/L) Median 888 1,294 1,800 0.001
High/total (%) 9/31 (30) 17/31 (54.8) 19/31 (61.3)
Crude model Ref. 3.80 (1.29; 11.19) 5.00 (1.67; 14.92)
Adjusted modela) Ref. 9.45 (2.22; 40.10) 12.80 (2.98; 54.91)
High BUN (>16 mg/dL) Median 16.35 15.87 15.40 0.915
High/total (%) 16/30 (53.3) 15/31 (48.4) 15/31 (48.4)
Crude model Ref. 0.820 (0.300; 2.24) 0.820 (0.300; 2.24)
Adjusted modela) Ref. 0.87 (0.26; 2.84) 0.93 (0.29; 2.95)
High Cr (>0.8 mg/dL) Median 0.93 0.75 0.80 0.514
High/total (%) 20/30 (66.7) 12/31 (38.7) 13/31 (41.9)
Crude model Ref. 0.31 (0.11; 0.91) 0.36 (0.12; 1.02)
Adjusted modela) Ref. 0.60 (0.17; 2.06) 0.65 (0.19; 2.23)
High TC (>104 mg/dL) Median 85.00 111.00 116.00 0.012
High/total (%) 8/30 (26.7) 17/31 (54.8) 21/31 (67.7)
Crude model Ref. 3.33 (1.14; 9.78) 5.77 (1.91; 17.44)
Adjusted modela) Ref. 2.81 (0.80; 9.84) 4.97 (1.42; 17.32)
High TG (>108 mg/dL) Median 129.50 106.00 99.00 0.999
High/total (%) 18/30 (60) 14/31 (45.2) 14/31 (45.2)
Crude model Ref. 0.54 (0.19; 1.51) 0.54 (0.19; 1.51)
Adjusted modela) Ref. 1.27 (0.37; 4.33) 1.01 (0.30; 3.35)
High AST (>25 U/L) Median 25.00 22.00 28.00 0.281
High/total (%) 16/30 (53.3) 11/31 (35.5) 20/31 (64.50)
Crude model Ref. 0.48 (0.17; 1.34) 1.59 (0.56; 4.44)
Adjusted modela) Ref. 0.38 (0.09; 1.47) 1.93 (0.53; 7.02)
High ALT (>18 U/L) Median 17.00 17.00 22.00 0.014
High/total (%) 14/30 (46.7) 12/31 (38.7) 21/31 (67.7)
Crude model Ref. 0.72 (0.26; 1.99) 2.40 (0.84; 6.79)
Adjusted modela) Ref. 1.39 (0.39; 4.89) 4.95 (1.33; 18.46)
High TSH (>2.8 mIU/L) Median 2.46 2.56 3.42 0.033
High/total (%) 10/30 (33.33) 15/31 (48.4) 21/31 (67.7)
Crude model Ref. 1.87 (0.66; 5.28) 4.20 (1.44; 12.23)
Adjusted modela) Ref. 1.74 (0.508; 5.98) 3.78 (1.10; 13.02)
High Platelet (>284 NO. per µL) Median 280 271 322 0.216
High/total (%) 13/30 (43.3) 14/31 (45.2) 19/31 (61.3)
Crude model Ref. 1.07 (0.39; 2.95) 2.07 (0.74; 5.75)
Adjusted modela) Ref. 1.12 (0.32; 3.91) 2.16 (0.62; 7.45)
High WBC (>6.6 NO. per L) Median 6.00 6.50 7.80 0.328
High/total (%) 13/30 (43.3) 13/31 (41.9) 20/31 (64.5)
Crude model Ref. 0.94 (0.34; 2.60) 2.37 (0.84; 6.66)
Adjusted modela) Ref. 0.78 (0.23; 2.60) 1.72 (0.53; 5.56)
High RBC (>3.38 NO. per µL) Median 3.38 3.38 3.46 0.638
High/total (%) 14/30 (46.7) 15/30 (48.4) 16/30 (51.6)
Crude model Ref. 1.07 (0.39; 2.92) 1.21 (0.44; 3.33)
Adjusted modela) Ref. 0.69 (0.21; 2.32) 0.74 (0.22; 2.42)
High Hb (>9.5 gr/dL) Median 9.59 9.60 9.70 0.939
High/total (%) 15/30 (50) 16/31 (51.6) 16/31 (51.6)
Crude model Ref. 1.06 (0.39; 2.91) 1.06 (0.39; 2.91)
Adjusted modela) Ref. 1.06 (0.32; 3.45) 0.96 (0.30; 3.05)
High Hct (>28.1%) Median 28.15 28.00 28.30 0.920
High/total (%) 15/30 (50) 15/31 (48.4) 17/31 (54.8)
Crude model Ref. 0.93 (0.34; 2.55) 1.21 (0.44; 3.32)
Adjusted modela) Ref. 0.74 (0.22; 4.41) 0.92 (0.29; 2.93)
High MCV (>81.82 femtoliter) Median 81.68 81.94 81.72 0.706
High/total (%) 15/30 (50) 16/31 (51.6) 15/31 (48.4)
Crude model Ref. 1.06 (0.39; 2.91) 0.93 (0.34; 2.55)
Adjusted modela) Ref. 0.88 (0.27; 2.82) 0.80 (0.25; 2.51)
High MCH (>28 pg/cell) Median 27.81 28.24 28.00 0.629
High/total (%) 13/30 (43.3) 18/31 (58.1) 15/31 (48.4)
Crude model Ref. 1.81 (0.65; 4.99) 1.22 (0.44; 3.36)
Adjusted modela) Ref. 1.13 (0.33; 3.80) 0.76 (0.23; 2.50)
High MCHC (>29.28 gr/dL) Median 29.47 29.47 29.15 0.742
High/total (%) 16/30 (53.3) 16/31 (51.6) 15/31 (48.4)
Crude model Ref. 0.93 (0.34; 2.55) 0.82 (0.30; 2.24)
Adjusted modela) Ref. 0.91 (0.28; 2.92) 0.82 (0.26; 2.59)

Data analysis was done by logistic binary regression.

a)Age, sex and transfusion number were adjusted as potential covariates.

Abbreviations: ALT, alanine aminotransferase; AST, aspartate aminotransferase; BTM, beta-thalassemia major; BUN, blood urea nitrogen; Hb, hemoglobin; Hct, hematocrit; MCH, mean corpuscular hemoglobin; MCHC, mean corpuscular hemoglobin concentration; MCV, mean corpuscular volume; PAB, pro-oxidant/antioxidant balance; RBC, red blood cell; TC, total cholesterol; TG, triglyceride; TSH, thyroid-stimulating hormone; WBC, white blood cell.

TOOLS
Similar articles