INTRODUCTION
METHODS
Data source and subjects
Measurements and definitions
Statistical analysis
Patients or public involvement
Ethics approval and consent to participate
RESULTS
Baseline characteristics of the study population
Table 1.
Values are expressed as mean±standard deviation, number (%), or median (interquartile range).
γ-GTP, γ-glutamyl transferase; WC, waist circumference; BMI, body mass index; SBP, systolic blood pressure; DBP, diastolic blood pressure; DM, diabetes mellitus; HTN, hypertension; eGFR, estimated glomerular filtration rate; HDL-C, high-density lipoprotein cholesterol; LDL-C, low-density lipoprotein cholesterol; TG, triglyceride; ALT, alanine aminotransferase; AST, aspartate transaminase; FLI, fatty liver index.
Cumulative γ-GTP and the incidence of MI, stroke, CVD, and death
Fig. 1.
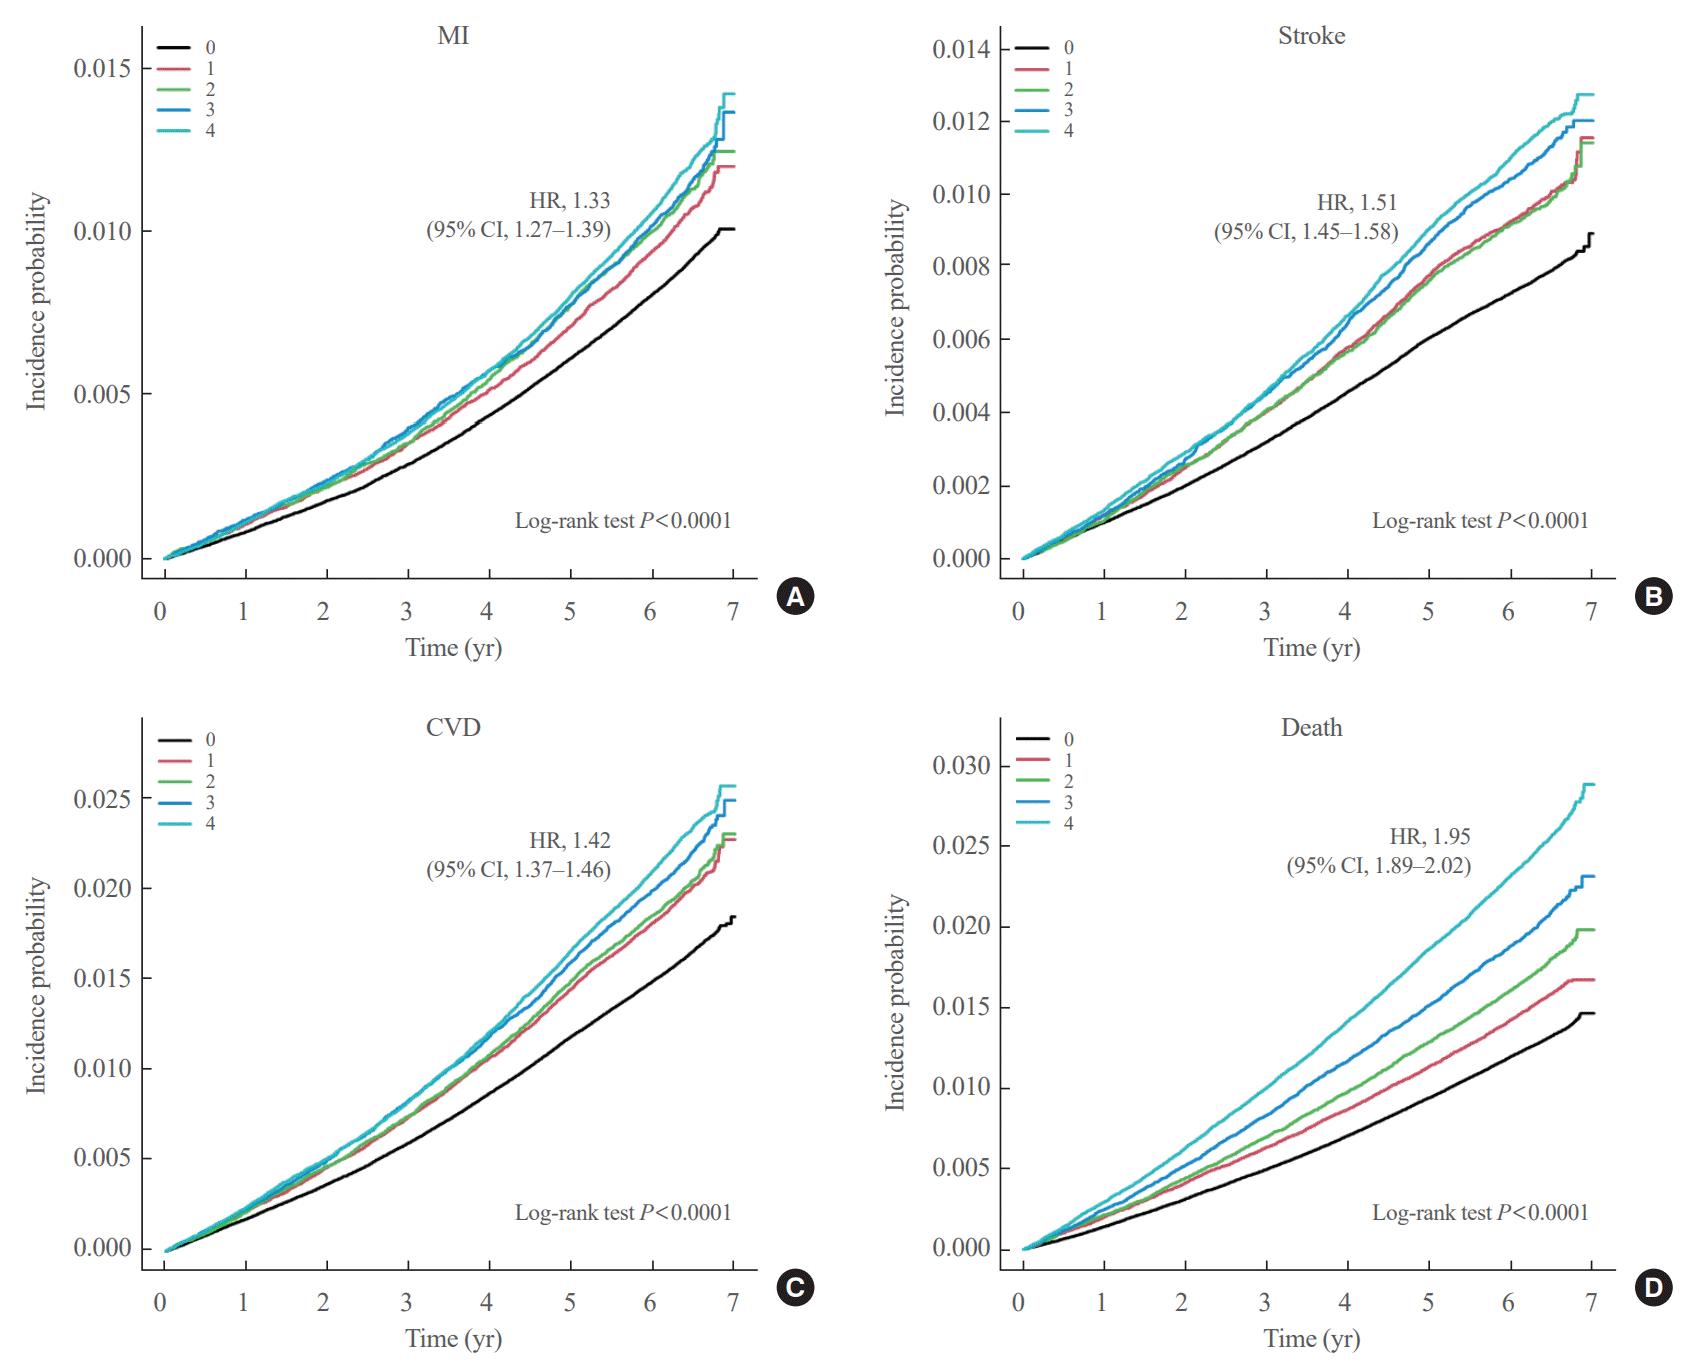
Fig. 2.
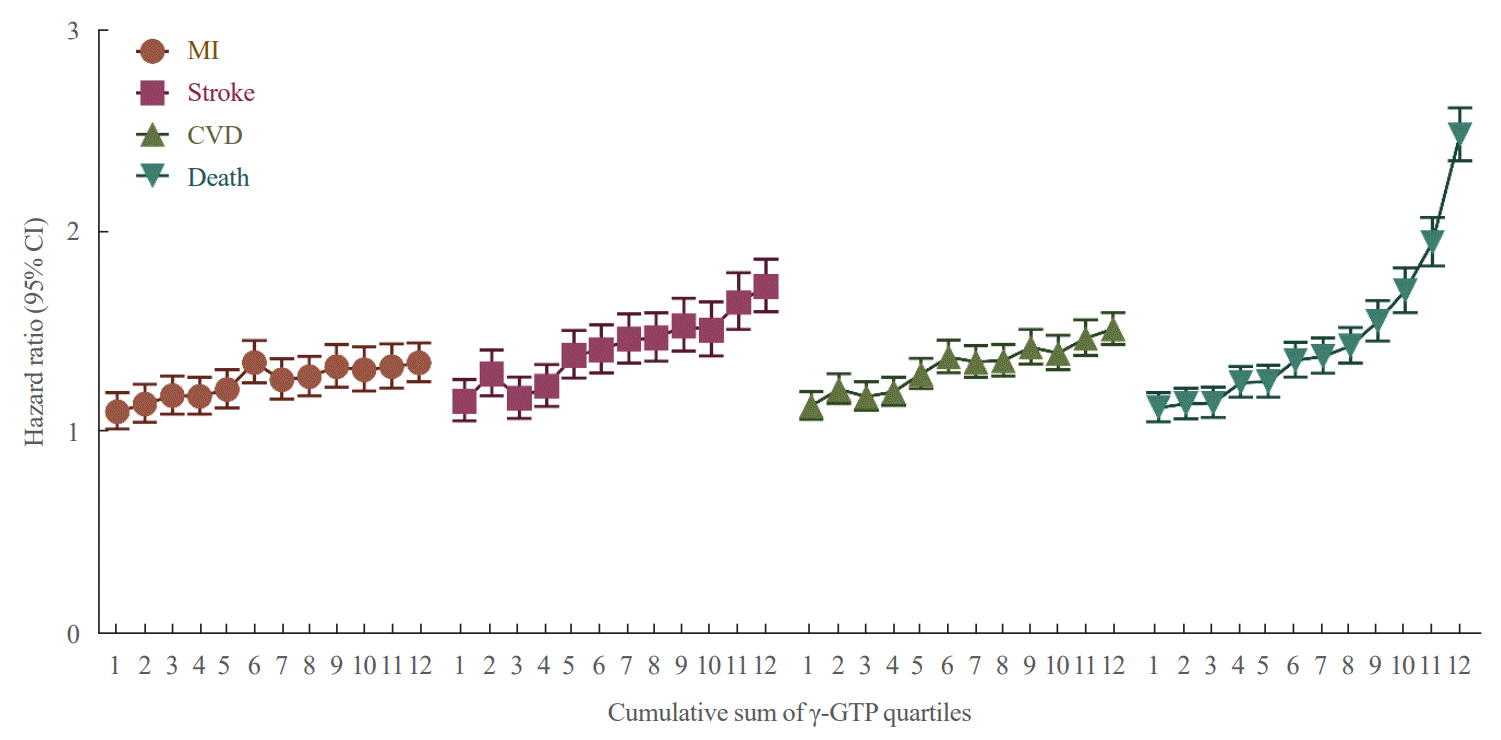
Table 2.
| Events | Cumulative no. of exposures to high γ-GTP | No. of events/total no. | IRa | Model 1 | Model 2 | Model 3 | Model 4 | Model 5 |
|---|---|---|---|---|---|---|---|---|
| MI | 0 | 9,026/1,012,181 | 1.40 | 1 (Reference) | 1 (Reference) | 1 (Reference) | 1 (Reference) | 1 (Reference) |
| 1 | 1,849/178,269 | 1.64 | 1.17 (1.1–1.23) | 1.22 (1.16–1.29) | 1.23 (1.17–1.29) | 1.13 (1.07–1.19) | 1.12 (1.07–1.18) | |
| 2 | 1,255/114,454 | 1.74 | 1.24 (1.17–1.32) | 1.29 (1.21–1.37) | 1.30 (1.22–1.38) | 1.15 (1.08–1.22) | 1.14 (1.08–1.21) | |
| 3 | 1,253/112,388 | 1.77 | 1.27 (1.19–1.34) | 1.30 (1.23–1.38) | 1.31 (1.23–1.39) | 1.14 (1.07–1.21) | 1.12 (1.06–1.20) | |
| 4 | 2,597/222,835 | 1.86 | 1.33 (1.27–1.39) | 1.37 (1.31–1.43) | 1.37 (1.31–1.43) | 1.15 (1.10–1.21) | 1.13 (1.08–1.19) | |
| Stroke | 0 | 7,875/1,012,181 | 1.22 | 1 (Reference) | 1 (Reference) | 1 (Reference) | 1 (Reference) | 1 (Reference) |
| 1 | 1,751/178,269 | 1.55 | 1.27 (1.21–1.34) | 1.33 (1.26–1.40) | 1.31 (1.24–1.38) | 1.22 (1.16–1.28) | 1.23 (1.16–1.29) | |
| 2 | 1,110/114,454 | 1.54 | 1.25 (1.18–1.34) | 1.32 (1.24–1.41) | 1.29 (1.21–1.38) | 1.17 (1.10–1.25) | 1.18 (1.11–1.26) | |
| 3 | 1,240/112,388 | 1.75 | 1.43 (1.35–1.52) | 1.51 (1.42–1.60) | 1.46 (1.37–1.55) | 1.29 (1.22–1.38) | 1.31 (1.23–1.39) | |
| 4 | 2,587/222,835 | 1.85 | 1.51 (1.45–1.58) | 1.63 (1.56–1.70) | 1.55 (1.48–1.62) | 1.33 (1.27–1.39) | 1.35 (1.29–1.42) | |
| CVD | 0 | 16,455/1,012,181 | 2.57 | 1 (Reference) | 1 (Reference) | 1 (Reference) | 1 (Reference) | 1 (Reference) |
| 1 | 3,506/178,269 | 3.12 | 1.22 (1.17–1.26) | 1.27 (1.23,1.32) | 1.27 (1.22–1.32) | 1.17 (1.13–1.22) | 1.17 (1.13–1.22) | |
| 2 | 2,295/114,454 | 3.19 | 1.24 (1.19–1.30) | 1.30 (1.24,1.36) | 1.29 (1.23–1.35) | 1.16 (1.11–1.21) | 1.16 (1.11–1.21) | |
| 3 | 2,418/112,388 | 3.43 | 1.34 (1.28–1.40) | 1.39 (1.33,1.45) | 1.37 (1.32–1.43) | 1.21 (1.15–1.26) | 1.21 (1.15–1.26) | |
| 4 | 5,043/222,835 | 3.62 | 1.42 (1.37–1.46) | 1.49 (1.44,1.53) | 1.45 (1.40–1.50) | 1.23 (1.19–1.27) | 1.23 (1.19–1.28) | |
| Death | 0 | 13,209/1,012,181 | 2.05 | 1 (Reference) | 1 (Reference) | 1 (Reference) | 1 (Reference) | 1 (Reference) |
| 1 | 2,775/178,269 | 2.45 | 1.20 (1.15–1.25) | 1.32 (1.26–1.37) | 1.32 (1.26–1.37) | 1.34 (1.28–1.39) | 1.31 (1.26–1.37) | |
| 2 | 2,018/114,454 | 2.78 | 1.36 (1.30–1.43) | 1.50 (1.43–1.57) | 1.50 (1.43–1.57) | 1.53 (1.46–1.60) | 1.49 (1.42–1.57) | |
| 3 | 2,305/112,388 | 3.24 | 1.59 (1.52–1.66) | 1.74 (1.66–1.82) | 1.73 (1.66–1.81) | 1.76 (1.69–1.85) | 1.72 (1.64–1.80) | |
| 4 | 5,609/222,835 | 3.99 | 1.95 (1.89–2.02) | 2.20 (2.13–2.27) | 2.17 (2.10–2.24) | 2.20 (2.13–2.27) | 2.11 (2.03–2.19) |
Values are expressed as hazard ratio (95% confidence interval). Model 1: non-adjusted; Model 2: adjusted for age, sex; Model 3: adjusted for model 2+status of smoking, drinking, physical activity; Model 4: adjusted for model 3+hypertension, dyslipidemia, and body mass index; Model 5: adjusted for model 4+alanine transaminase.
MI, myocardial infarction; CVD, cardiovascular disease; γ-GTP, γ-glutamyl transferase; IR, incidence rate.
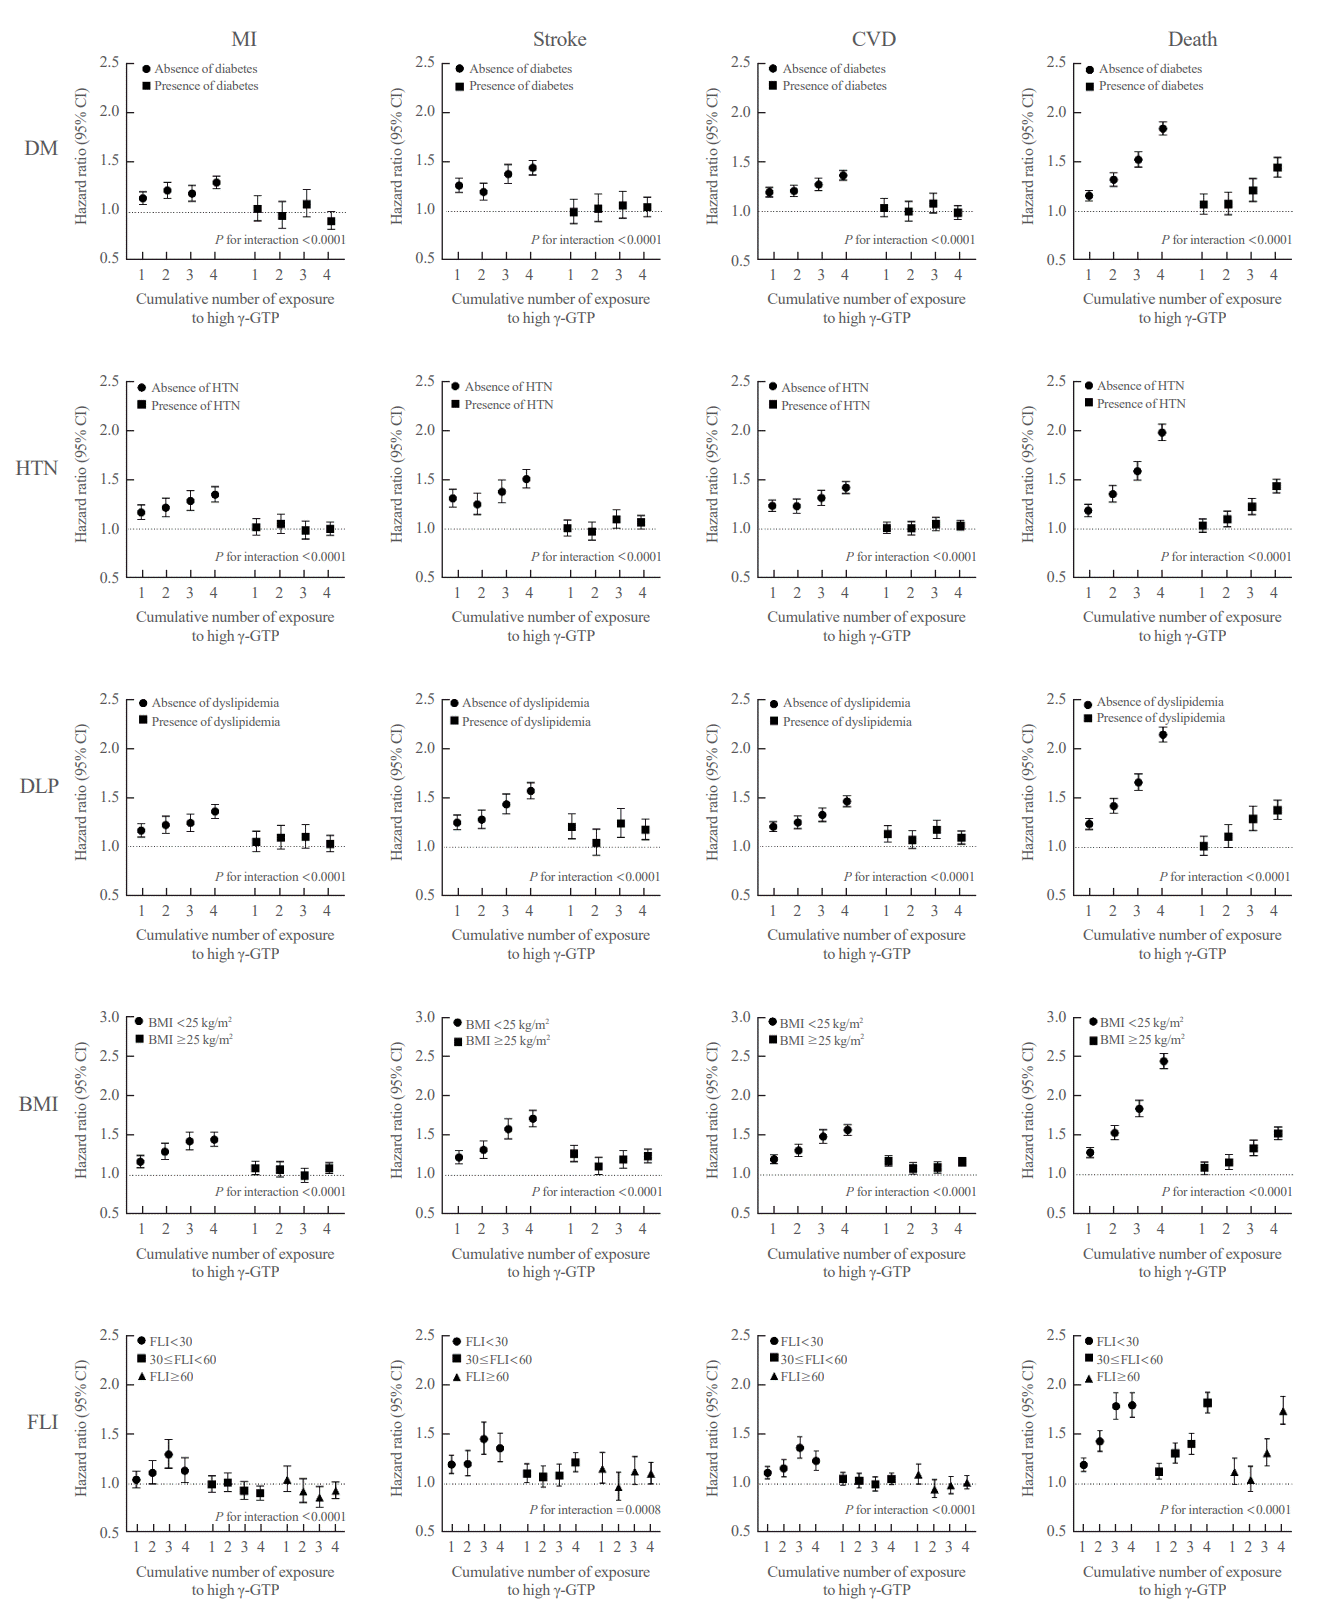
Cumulative γ-GTP and development of MI, stroke, CVD, and death among participant subgroups
Fig. 3.
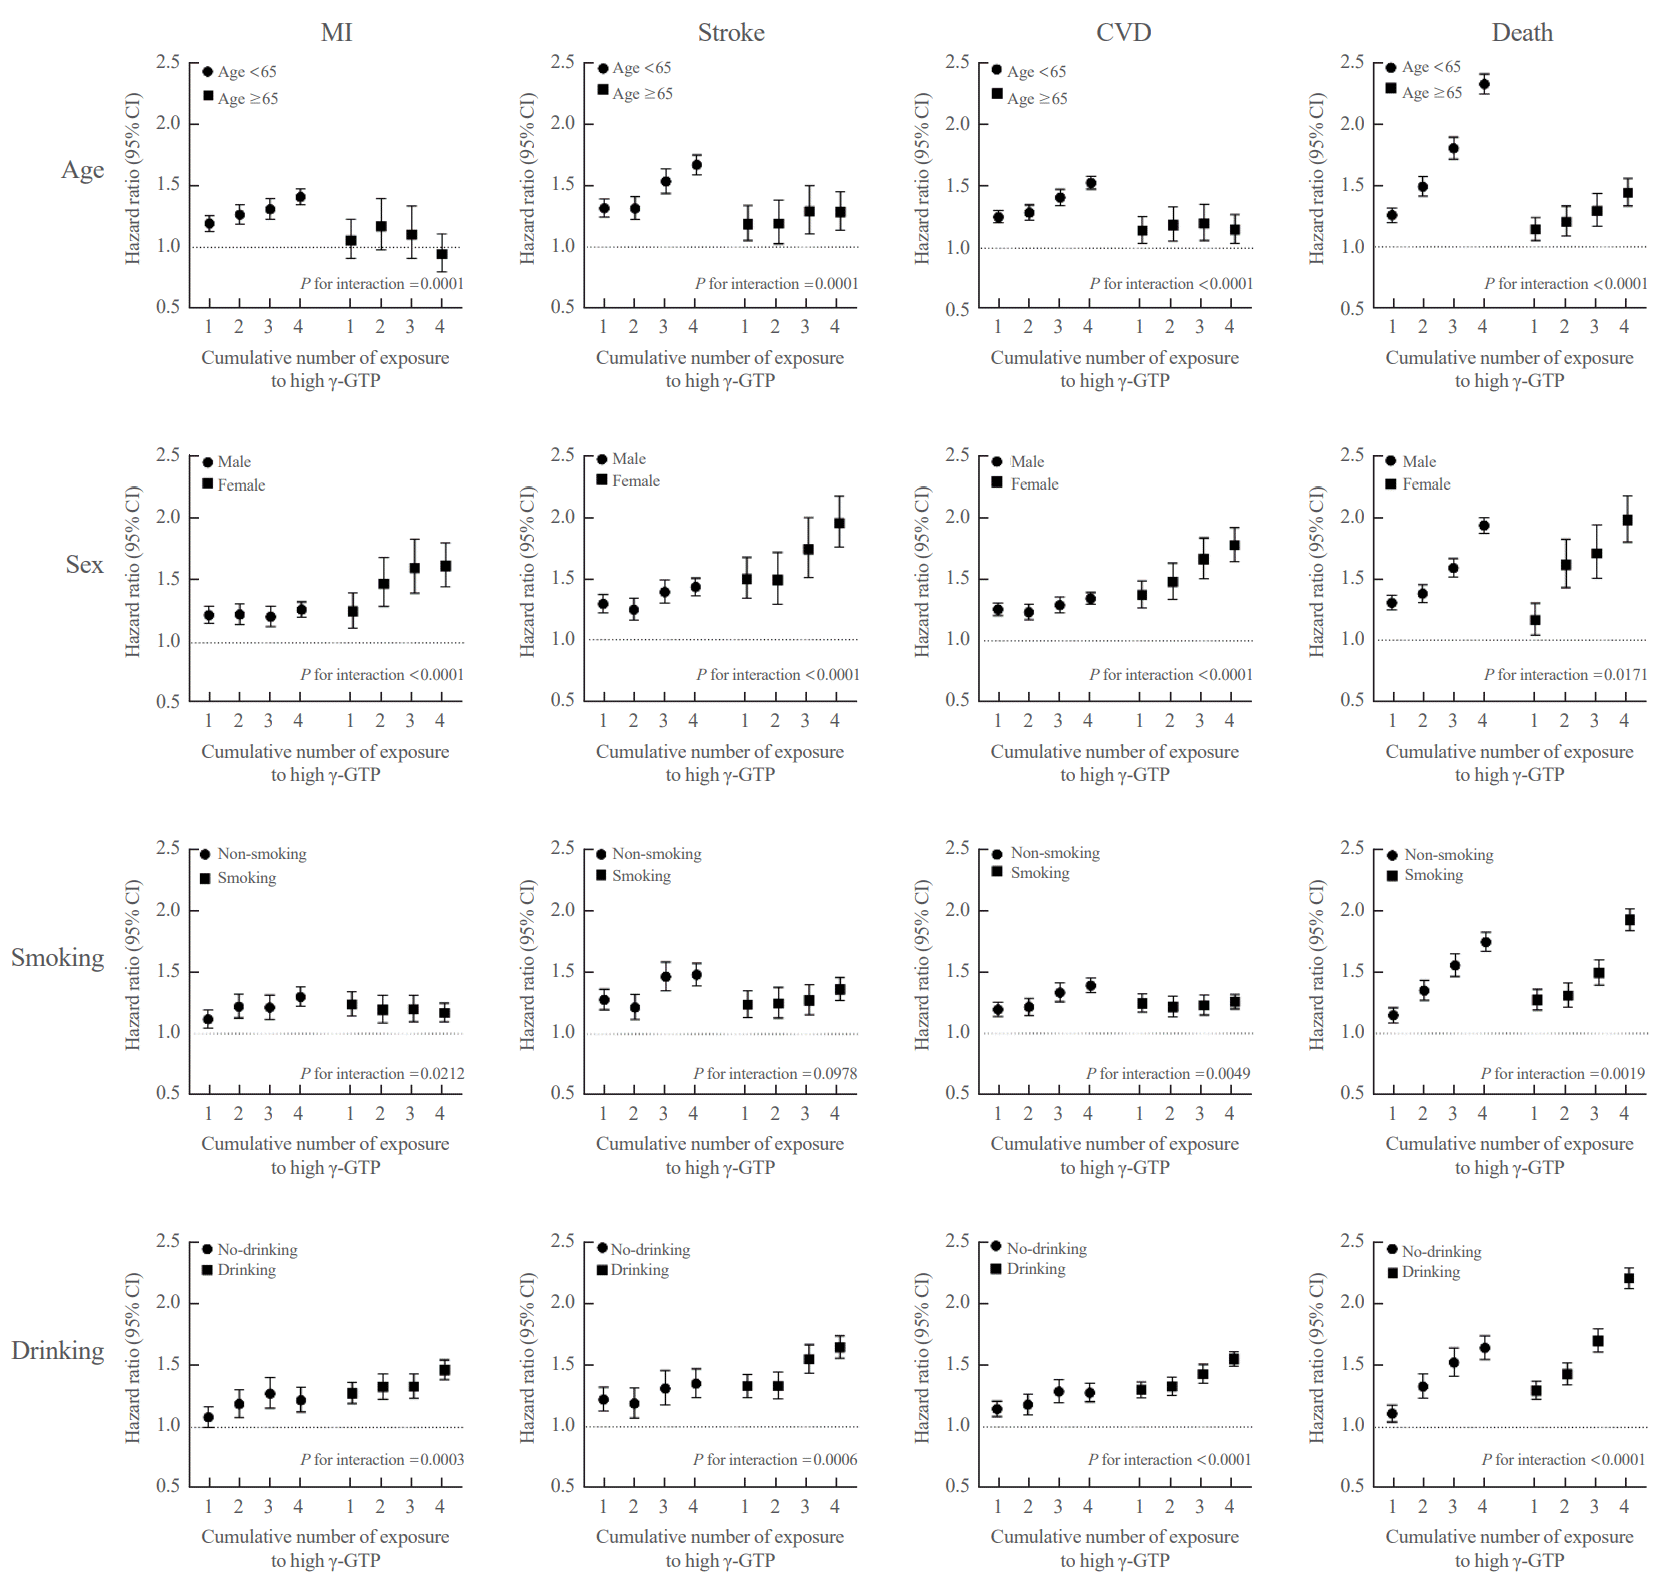
Fig. 4.


 PDF
PDF Citation
 Print
Print


 XML Download