Introduction
Materials and methods
1. Subjects
2. Methods
3. Definitions
4. Statistical analyses
Results
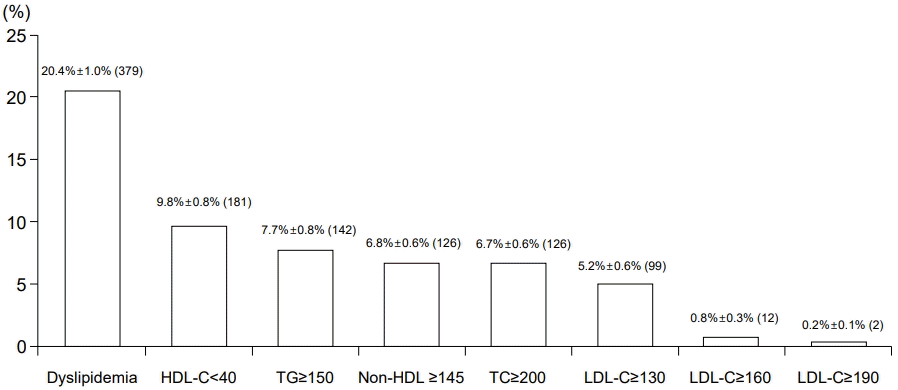
1. Lipid disorder prevalence
 | Fig. 1.Prevalence of lipid disorders in Korean adolescents 10–18 years old. Data are from the Korea National Health and Nutrition Examination Survey VI, 2013–2015. HDL-C, high-density lipoprotein-cholesterol; TG, triglycerides; TC, total cholesterol; LDL-C, low-density lipoprotein-cholesterol. Dyslipidemia was defined as a case with at least one of the following conditions: TC≥200 mg/dL, TG≥150 mg/dL, HDL-C<40 mg/dL, and LDL-C≥130 mg/dL. Numbers in parentheses indicate unweighted counts. |
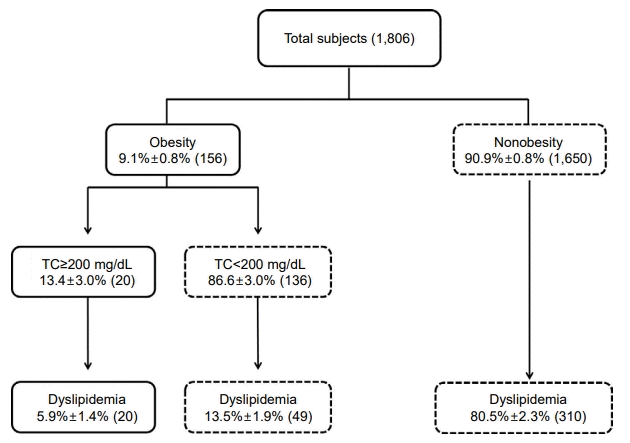
2. Identification of dyslipidemia based on current screening methods
 | Fig. 2.Identification of dyslipidemia based on the current Korean selective screening test for lipid disorders. Boxes with dashed lines indicate likelihood to be selected at each step depending on the current screening test method for lipid disorders. Boxes with dotted lines indicate counts excluded from a screening test. Numbers in parentheses indicate unweighted counts. TC, total cholesterol. |
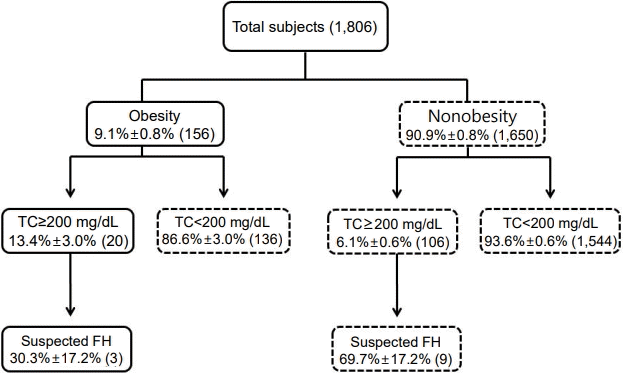
3. Identification of suspected FH based on current screening methods
 | Fig. 3.Identification of familial hypercholesterolemia (FH) based on the current Korean selective screening test for lipid disorders. Boxes with dashed lines indicate likelihood to be selected at each step depending on the current screening test method for familial hypercholesterolemia. Boxes with dotted lines indicate counts excluded from a screening test. Numbers in parentheses indicate unweighted counts. TC, total cholesterol. |
4. Diagnostic validity of various cardiovascular risk factors as selection criteria for dyslipidemia screening
Table 1.
5. Diagnostic validity of various cardiovascular risk factors as selection criteria for suspected FH screening
Table 2.
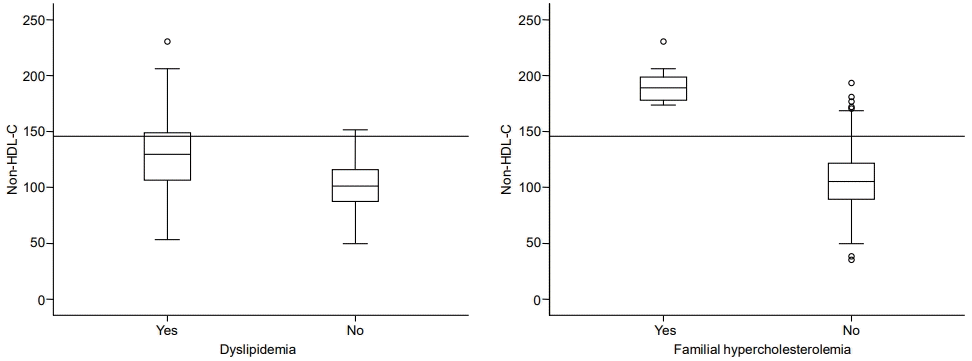
6. Diagnostic validity of non-HDL cholesterol levels as universal screening criteria for lipid disorders
 | Fig. 4.(A) Box plot of non-HDL-C values comparing cases with and without dyslipidemia. Median values and interquartile ranges are represented by horizontal black lines in the upper and lower bounds of the box, respectively. (B) Box plot of non-HDL-C values comparing cases with and without suspected familial hypercholesterolemia. Median values and interquartile ranges are represented by horizontal black lines in the upper and lower bounds of the box, respectively. HDL-C, high-density lipoprotein-cholesterol. |


 PDF
PDF Citation
 Print
Print


 XML Download