Introduction
Materials and methods
1. Study population and design
2. VFT and SFT measurements
3. Clinical and laboratory data
4. Statistical analysis
Results
1. Baseline characteristics
Table 1.
Values are presented as mean±standard deviation.
CPP, central precocious puberty; CA, chronological age; BA, bone age; SDS, standard deviation score; BMI, body mass index; LH, luteinizing hormone; SHBG, sexual hormone binding globulin; DHEA-S, dehydroepiandrosterone sulfate; FEI, free estradiol index; IGF-1, insulin-line growth factor 1; HOMA-IR, homeostatic model assessment-insulin resistance; HDL, high-density lipoprotein; LDL, low-density lipoprotein; VFT, visceral fat thickness; SFT, subcutaneous fat thickness.
2. Comparing the CPP and non-CPP groups based on BMI percentiles
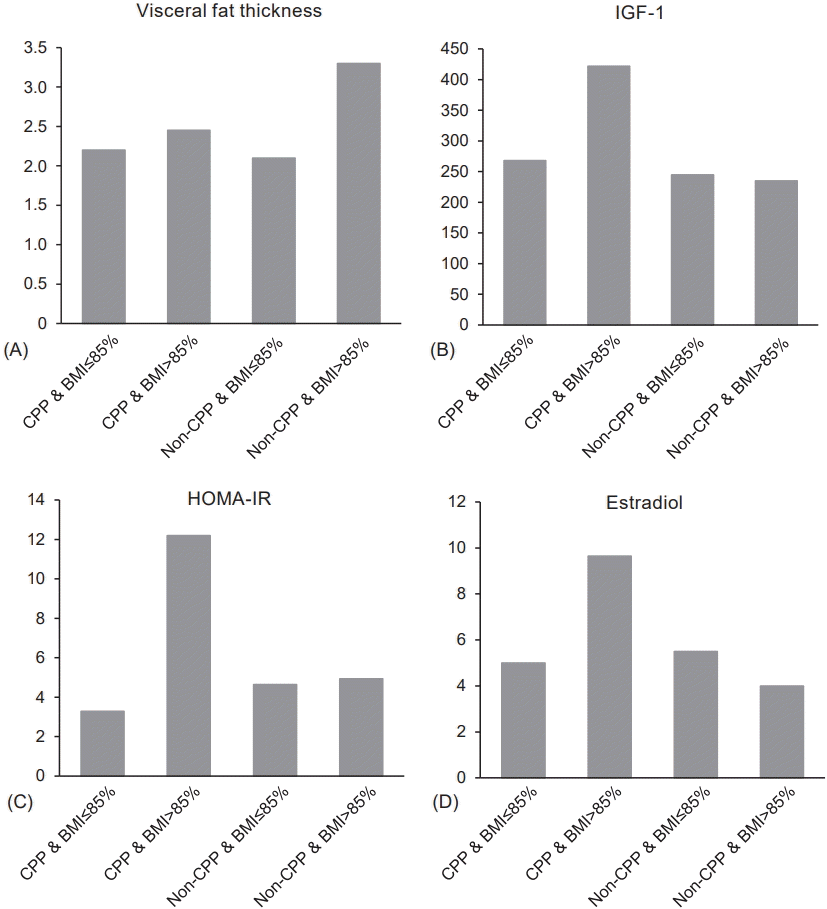
 | Fig. 1.VFT, IGF-1, HOMA-IR, and estradiol level among CPP and non-CPP groups categorized by BMI percentage. Values are presented as median. (A) Significant difference (P=0.016) was shown between overweight CPP and overweight non-CPP groups. (B) Significant difference (P<0.001) was shown between overweight CPP and overweight non-CPP groups. (C) Significant difference (P=0.013) was shown between overweight CPP and nonoverweight CPP groups. (D) Significant difference (P=0.033) was shown between overweight CPP and overweight non-CPP groups. VFT, visceral fat thickness; IGF-1, insulin-like growth factor-1; BMI, body mass index; HOMA-IR, homeostatic model assessment-insulin resistance; CPP, central precocious puberty. |
Table 2.
| Characteristic |
BMI≤85% |
BMI>85% |
Overall P-value | ||||
|---|---|---|---|---|---|---|---|
| Non-CPP (n=10) | CPP (n=43) | P-value | Non-CPP (n=8) | CPP (n=11) | P-value | ||
| CA (yr) | 8.5 (0.7) | 8.4 (0.7) | 0.204 | 8.3 (1.7) | 8.7 (0.7) | 0.351 | 0.441 |
| BA (yr) | 9.5 (1.0) | 9.5 (1.0) | 0.479 | 9.5 (2.0) | 11.0 (1.0) | 0.075 | 0.075 |
| BA–CA* | 1.0 (1.1) | 1.3 (1.1) | 0.138 | 1.4 (1.2) | 2.5 (1.0) | 0.062 | 0.023 |
| Weight SDS*,† | 0.61 (0.82) | 0.48 (0.75) | 0.828 | 2.13 (1.04) | 1.76 (0.95) | 0.923 | <0.001 |
| BMI SDS*,† | 0.59 (1.44) | 0.07 (0.63) | 0.469 | 2.05 (0.97) | 1.67 (0.69) | 0.579 | <0.001 |
| Baseline LH (IU/L)† | 0.1 (0.2) | 0.6 (1.2) | <0.001 | 0.6 (0.5) | 0.8 (1.1) | 0.778 | 0.001 |
| Peak LH (IU/L) | 3.2 (2.3) | 10.3 (19.7) | <0.001 | 2.6 (2.3) | 19.1 (22.4) | <0.001 | 0.001 |
| Estradiol (pg/mL) | 5.5 (7.3) | 5.0 (20.4) | 0.620 | 4.0 (0.1) | 9.65 (42.1) | 0.033 | 0.039 |
| SHBG (nmol/L)*,† | 77.3 (73.1) | 94.0 (48.9) | 0.585 | 44.5 (21.5) | 52.25 (19.5) | 0.026 | 0.001 |
| FEI† | 7.0 (12.0) | 6.37 (15.1) | 0.682 | 12.13 (25.0) | 24.63 (60.5) | 0.788 | 0.033 |
| Insulin (mU/L) | 20.0 (24.4) | 15.3 (31.3) | 0.856 | 19.7 (52.3) | 46.9 (47.5) | 0.600 | 0.057 |
| IGF-1 (ng/mL)* | 245 (75.0) | 268 (169.0) | 0.119 | 235 (89.0) | 422 (111.0) | <0.001 | 0.001 |
| HOMA-IR* | 4.64 (6.49) | 3.79 (8.4) | 0.838 | 4.95 (10.5) | 12.2 (10.9) | 0.545 | 0.048 |
| VFT (cm)† | 2.1 (1.2) | 2.2 (0.9) | 0.964 | 3.3 (1.1) | 2.45 (0.9) | 0.016 | 0.011 |
| SFT (cm)† | 0.8 (1.0) | 0.9 (0.4) | 0.991 | 1.9 (0.9) | 1.53 (0.9) | 0.152 | 0.001 |
| VFT:SFT | 2.62 (2.37) | 2.18 (1.36) | 0.964 | 2.0 (1.3) | 1.82 (2.0) | 0.778 | 0.876 |
Values are presented as median (interquartile range). Comparative analysis between groups was done with the Kruskal-Wallis test.
CPP, central precocious puberty; CA, chronologic age; BA, bone age; SDS, standard deviation score; BMI, body mass index; LH, luteinizing hormone; SHBG, sex hormone binding globulin; FEI, free estradiol index; IGF-1, insulin-like growth factor-1; HOMA-IR, homeostatic model assessment-insulin resistance; VFT, visceral fat thickness; SFT, subcutaneous fat thickness.


 PDF
PDF Citation
 Print
Print


 XML Download