Journal List > Anat Cell Biol > v.56(4) > 1516085014

Cheong, Kumagai, Oh, and Lee: Dental characteristics on panoramic radiographs as parameters for non-invasive age estimation: a pilot study

Abstract

The dental characteristics created by acquired dental treatments can be used as age estimators. This pilot study aimed to analyze the correlation between the number of teeth observed for dental characteristics and chronological age and to develop new non-invasive age estimation models. Dental features on panoramic radiographs (420 radiographs of subjects aged 20–89 years) were classified and coded. The correlation between the number of teeth for each selected code (codes V, X, T, F, P, and L) and age was observed, and multiple regression was performed to analyze the relationship between them. Eleven regression models with various combinations of dental sextants were presented. The model with the data from both sides of the posterior teeth on both jaws showed the best performance (root mean square error of 14.78 years and an adjusted R2 of 0.461). The model with all teeth was the second-best. Based on these results, we confirmed statistically significant correlations between certain dental features and chronological age. We also observed that some regression models performed sufficiently well to be used as adjunctive methods in forensic practice. These results provide valuable information for the design and performance of future full-scale studies.

Introduction

Human age estimation is mainly performed to identify human remains in forensic contexts, but it can also be applied to living individuals for legal and social purposes [1]. Forensic examinations are sometimes applied to living individuals to determine minor/adult status, for example, in the case of refugees or illegal immigrants who do not have an official record of their date of birth [2, 3]. In addition, when it is necessary to correct a wrongly recorded date of birth due to administrative errors or delayed registration, age estimation for living middle-aged or older adults may be required to provide scientific evidence for correction [4]. These corrections are mainly due to economic needs, such as accelerating the start of pension payments or calculating insurance premiums, and they often involve legal disputes between the parties involved. The more accurate the age estimation, the greater the possibility of an amicable resolution of such disputes; thus, improving the accuracy of age estimation for living individuals is important.
Adult age estimation is performed by evaluating regressive changes in age indicators observed in the teeth. Since Gustafson [5] published his six histological age indicators for increasing age in 1950, almost all adult age estimation methods in forensic practice have been developed using these indicators individually or in combination. However, most of these factors are histological and can only be observed microscopically inside the tooth; therefore, irreversible tooth loss is unavoidable in most age estimation methods. Most dental age estimation methods are not applicable to living individuals. Since irreversible damage, such as tooth extraction, should not be inflicted on living individuals during dental age estimation, only non-invasive methods, such as macroscopic or radiological examinations, should be used [6, 7]. However, as non-invasive methods mainly use only one age estimation factor, such as attrition or secondary dentine deposition, they are less accurate than invasive methods that use a combination of age indicators. When estimating the age of a living individual, it is recommended to increase the estimation accuracy by performing as many independent methods as possible using different age indicators [8].
The degree of attrition on the occlusal surfaces of teeth can be visually observed and evaluated. Attrition degree methods are typically non-invasive and can be applied to living individuals [9-12]. The degree of secondary dentine deposition can be indirectly evaluated by measuring the volume reduction of the pulp chamber and canal observed on radiographs [13, 14]. Kvaal’s method [15] is widely known and used, and modified versions of Kvaal’s method, such as Paewinsky et al.’s [16] and Roh et al.’s [17] methods, are also frequently used in forensic practice. Drusini’s [18] method and Jeon’s method [19], which were developed with the tooth coronal index according to Ikeda et al. [20], are also applicable. However, few non-invasive methods using age indicators other than attrition and secondary dentin have been reported. Solheim [21] reported the relationship between tooth color change and chronological age and developed estimation methods; however, this method is rarely used in age estimation practice. It is necessary to develop a new non-invasive method using an age indicator that is completely different from the methods currently used in practice.
Human deciduous teeth are lost and replaced by permanent teeth only once, and the replaced permanent teeth function until death. Dental tissues cannot be regenerated if deformed or destroyed for various reasons. Various dental treatments aim to restore the shape and function of dental tissues to make teeth available. Therefore, as a person ages, the type or frequency of dental characteristics appearing in the teeth due to acquired dental treatment increases. By studying the correlation between age and dental characteristics, it is possible to estimate age based on the type and number of observed dental characteristics. Yamashita et al. [22] selected 20 dental characteristics observed in dentition and analyzed the correlation between each characteristic and age. They presented a regression formula for age estimation in the presence of tooth stump, attrition, dental prostheses, normal tooth, and untreated, missing tooth as variables and reported that the formula could be useful for estimating the age of middle-aged to elderly individuals. Azrak et al. [23] analyzed the correlation between clinical and radiographic dental findings and chronological age and published an age estimation model by combining these findings. They concluded that this method could only be used as a supporting method for age estimation, not as a stand-alone method. A study that correlates the number of teeth treated with chronological age using other types of radiographs, such as computed tomography scans, has also been published [24].
Previously published age estimation methods using dental characteristics were difficult to apply to subjects of all ages by analyzing only a specific age range owing to difficulties in sample collection [22] or difficulty in application to partial dentition cases because the published method was developed using only full dentition data [23]. This pilot study aimed to analyze the correlation between the number of specific dental characteristics observed in panoramic radiographs and chronological age and to develop new non-invasive age estimation methods based on dentition sextants.

Materials and Methods

A total of 420 panoramic radiographs of patients were collected from Seoul St. Mary’s Hospital, The Catholic University of Korea (210 males and 210 females, 54.55±20.14 years), ranging in age from 20 to 89 years. Data were randomly selected and stratified by sex. The chronological age of each sample was calculated by subtracting the patient’s date of birth from the date the radiograph was obtained. The sample was divided into seven age groups by decade of chronological age. The number of subjects assigned to each group was evenly distributed. The age and sex distributions of the patients are shown in Table 1. This study was approved by the Institutional Review Board (IRB) of Seoul St. Mary’s Hospital, Catholic University of Korea (approval no.: KC23WISI0160). Informed consent was waived by the IRB due to the retrospective nature of this study.
The dental characteristics of each tooth on the radiograph were classified and coded according to the dental code proposed by Lee et al. [25]. The four third molars in the dentition were excluded from this study because of their high individual variability. The code system presented by Lee et al. [25]. lacks the code for dental implants, which are commonly used in modern dental clinics; therefore, in this study, the dental characteristics were classified into nine codes by adding the code for implants (Table 2). Among the nine codes, I, D, and R were excluded from the statistical analysis because of the low frequency of observations. Finally, six codes (V, X, T, F, P, and L) were selected for this study. The number of observed codes according to the age group is expressed as means±standard deviations or numbers, including percentages based on variable conditions. We adhered to the precedent set by similar studies [22, 24], conducting our statistical analysis solely on pooled-sex data. Pearson’s correlation coefficients were calculated between the number of codes observed in a tooth and chronological age. Multiple regression analysis was performed, considering the age-dependent dental codes in the entire dentition using backward elimination procedures. Multicollinearity between the six codes was checked by calculating the variance inflation factors (VIFs). In the process of age estimation about human remains for dental identification, postmortem loss of certain parts of dentition can hinder the application of methods designed for full dentition. Consequently, we investigated the correlation between dental characteristics and age, considering both full and partial dentition. Generally, dentition is classified into sextants; hence, this study conducted regression analysis, combining the outcomes from diverse sextant-based dental characteristics. Table 3 [26] provides the delineation for each sextant combination. The performance of each model was compared using the adjusted R2 and root mean square error (RMSE). Statistical significance was defined as a two-tailed P-value of <0.05. All statistical analysis were performed using SAS version 9.4 (SAS Institute, Inc.).

Results

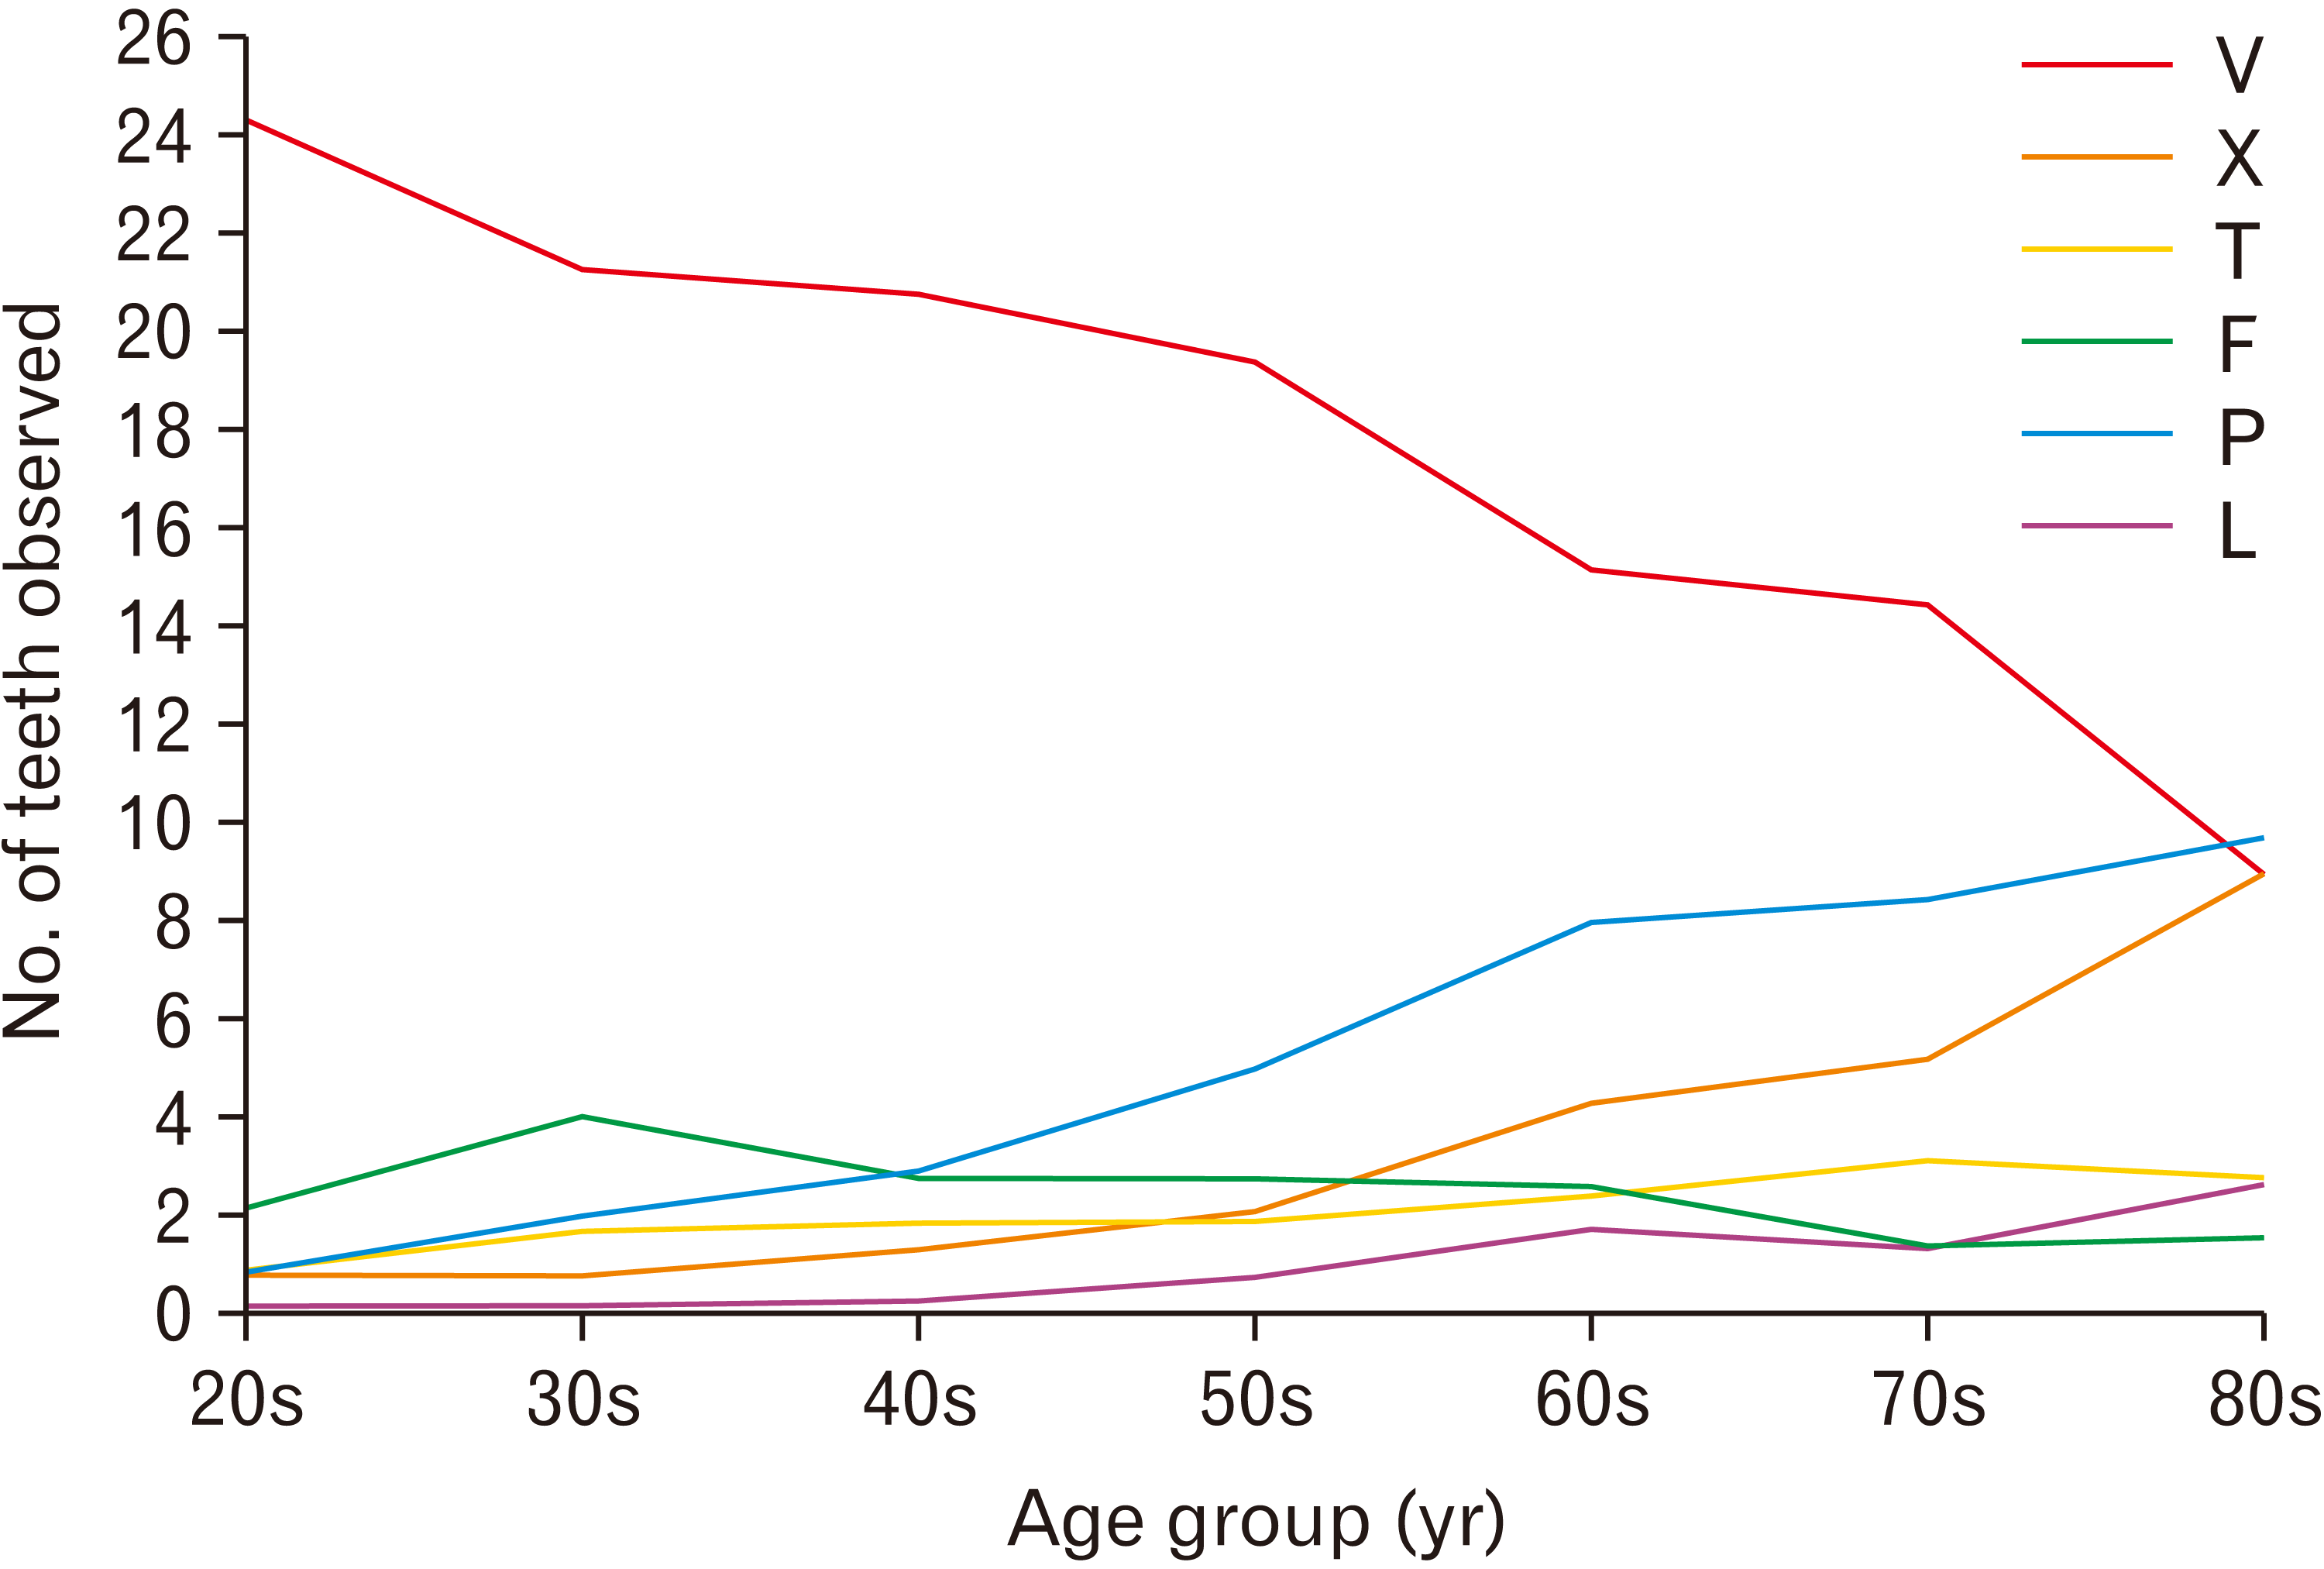
Descriptive statistics for the number of teeth for specific codes by age group are presented in Table 4, and Table 5 shows the frequency of observations for specific codes by age group. The number of teeth increased with age for codes X, T, P, and L. Conversely, code V, representing sound teeth, showed a decreasing number of occurrences with age. The number of occurrences of code F increased from the 20s to the 30s, then decreased after the 40s. The difference in the number of teeth observed between the 20s and 80s age groups was particularly noticeable for codes X and P. In the 20s group, only 12 of the 60 individuals had missing teeth, whereas, in the 80s group, 56 of the 60 individuals had missing teeth. Similarly, in the 20s group, only 17 individuals had dental prostheses in their teeth, while in the 80s group, all but three of the 60 individuals had received prosthetic treatment (Fig. 1).
The Pearson’s correlation coefficients between the number of dental codes and chronological age for each tooth are presented in Table 6. Positive correlations were observed for codes X, T, P, and L, whereas a negative correlation was observed for code V for all teeth. For code F, both positive and negative correlations were observed, with positive correlations mainly observed in the anterior teeth and negative correlations in the posterior teeth. The largest absolute values of the positive and negative coefficients were 0.4551 (code X for maxillary right second molar) and 0.4486 (code V for maxillary left second molar). When we calculated the VIF to select the variables for regression analysis, we found that code V had a very high VIF value (28.16). Therefore, we excluded this from the set of variables selected for the regression analysis. Among the multiple regression models with different combinations of sextants (Table 7), the best was Model 3, which included both sides of the posterior teeth on both jaws (RMSE=14.78, adjusted R2=0.461). On the other hand, the least accurate model was Model 5, which included only the codes observed in the incisors and canines on both sides of the lower jaw (RMSE=17.97, adjusted R2=0.203). The model with all teeth (Model 1) was the second most accurate, with an RMSE difference of 0.45 years from the best model (Fig. 2).

Discussion

We analyzed the correlation between the number of dental codes observed on panoramic radiographs and chronological age. Based on these results, we developed various new non-invasive age-estimation methods using different combinations of the six sextants. The best model was Model 3, which was built using dental characteristics observed in the posterior tooth area on both sides and jaws. The RMSE for this model was 14.78 years, and the adjusted R2 was 0.461. We believe that the estimation performance of this model is insufficient for sole application in forensic practice. However, the performance was not significantly lower than that of other non-invasive age estimation methods developed using Korean population data. Yun et al.’s [10] method, which used the attrition degree of teeth as an age predictor, showed a higher value of R2 than that of the present study (0.8149 for males and 0.8407 for females). Meanwhile, non-invasive methods using radiographs as age estimators, such as in this study, have reported similar performance. Roh et al. [17] developed an age-estimation method that measured six teeth on panoramic radiographs. The best model out of nine regression equations had an R2 of 0.47, almost identical to our result (0.46). This value is also similar to the R2 (0.537) of the best model from Jeon’s method [19] for estimating the age of the lower first molar from radiographs. Because the estimation performance is not substantially inferior to the methods currently used in forensic practice, we believe this method can serve as an adjunct method for age estimation in Koreans.
The samples for this study were randomly selected, leading to the inclusion of some instances where the whole dentition was sound, without any observed dental features. In cases where a sample consists solely of sound teeth, practical application of age estimation using dental features becomes unfeasible, as the estimation would default to one specific age irrespective of the subject’s actual age. The presence of such sound samples is presumed to have acted as a factor in the degradation of model performance observed in this study. In subsequent large-scale studies, the application of exclusion criteria to samples of sound dentition could potentially lead to improved age estimation performance compared to the current study. Moreover, this approach might demonstrate superior effectiveness when juxtaposed with other non-invasive dental age estimation methods developed for the Korean population [17, 19].
Statistically significant correlations between chronological age and codes V, X, and P were observed across almost all teeth. However, codes T, F, and L were only correlated with age in canines, premolars, and molars, with no correlation observed in most incisors. In the 20s–80s age range, the average number of codes X and P in the incisors differed by 8 to 9, while the difference for codes T, F, and L was only 2. This suggests that dental treatments associated with codes T, F, and P were performed less frequently on the incisors, making it difficult to observe correlations in these teeth. According to Lee et al. [25], incisors have a lower incidence of caries than molars because of their less complex anatomy and the self-cleansing effect of saliva. The low correlation between incisors and dental treatments is also responsible for the poor performance of the models that included incisor data in this study. It is important to consider this tendency when designing and conducting future studies with larger sample sizes.
The age-dependent codes identified in this study were confirmed in previous studies. Yamashita et al. [22] demonstrated a statistically significant correlation between the number of dental prostheses (code P in this study) and an individual’s dentition and age. The correlation between the numbers of codes V and P and age was also observed by Kawashima et al. [27]. Azrak et al. [23] presented regression equations according to alveolar bone level and total score integrating dental characteristics. To calculate the total score, they multiplied the number of teeth in which the codes X, T, F, and P were observed by the score corresponding to each code and summed the values; they proved a strong correlation between the total score and age. A previous study using Korean population data found age correlations with specific dental features also observed in our study [28]. Lee et al. [28] used panoramic radiographs of subjects aged 20–60 years and reported a significant correlation between the number of teeth for codes X, T, P, and L and age (P<0.05). Although they did not provide the correlation coefficient for each code, they presented descriptive statistics for the number of teeth observed for each age decade group. The number of observed dental features increased with age, particularly in individuals in their 60s (P<0.001); and our study also confirmed this trend. Although codes T, P, and L showed a moderate increase in the number of observed teeth after the 60s age group, the number of teeth for code X doubled from the 60s group (average of 4.20) to the 80s group (average of 8.90). Copeland et al. [29] suggested an average number of lost teeth per decade of 0.6–1.5, and the number of teeth observed with code X in the 80s age group in the present study was similar to the expected number of lost teeth according to their prediction model. However, they did not present the change in the number of lost teeth with increasing age, making it difficult to confirm the trend in our study. Based on these findings, the number of teeth with code X may be a more effective indicator for age estimation after 60 years. If larger studies confirm this trend, customized age estimation methods could be developed for subjects over 60 years of age.
We confirmed statistically significant correlations between certain dental features and chronological age on panoramic radiographs and developed various age-estimation equations. The results of this study provide a scientific basis for estimating the sample size of a subsequent full-scale study and allow for the enhancement of the methodology by identifying modification points for future research, such as dental features, teeth areas, and age groups. Future full-scale studies should also include observer reliability analysis, which was not performed in the present study. Furthermore, to enhance accuracy, sex-specific equations should be explored, as recommended by several age estimation studies [10, 19, 30-32], and compared with the pooled sex data. Finally, machine learning techniques can be employed to analyze the dental feature patterns of an individual’s dentition, which could lead to the development of an age estimation model with improved accuracy and reproducibility [33, 34].

Notes

Author Contributions

Conceptualization: SSL. Data acquisition: AK, SSL. Data analysis or interpretation: HC, AK, SO, SSL. Drafting of the manuscript: HC, SSL. Critical revision of the manuscript: HC, SSL. Approval of the final version of the manuscript: all authors.

Conflicts of Interest

No potential conflict of interest relevant to this article was reported.

References

1. Cummaudo M, De Angelis D, Magli F, Minà G, Merelli V, Cattaneo C. 2021; Age estimation in the living: a scoping review of population data for skeletal and dental methods. Forensic Sci Int. 320:110689. DOI: 10.1016/j.forsciint.2021.110689. PMID: 33561788.
crossref
2. Oh S, Kumagai A, Kim SY, Lee SS. 2022; Accuracy of age estimation and assessment of the 18-year threshold based on second and third molar maturity in Koreans and Japanese. PLoS One. 17:e0271247. DOI: 10.1371/journal.pone.0271247. PMID: 35802665. PMCID: PMC9269881. PMID: e0c1a6f140ad4156a9d8f091bb76f4a1.
crossref
3. Olze A, Reisinger W, Geserick G, Schmeling A. 2006; Age estimation of unaccompanied minors. Part II. Dental aspects. Forensic Sci Int. 159 Suppl 1:S65–7. DOI: 10.1016/j.forsciint.2006.02.018. PMID: 16529893.
4. Kwon C, Byun JS, Jung JK, Choi JK. 2013; An analysis of age estimation cases in Korea from the view of social aspects. J Oral Med Pain. 38:235–46. DOI: 10.14476/jomp.2013.38.3.235.
crossref
5. Gustafson G. 1950; Age determination on teeth. J Am Dent Assoc. 41:45–54. DOI: 10.14219/jada.archive.1950.0132. PMID: 15428197.
6. Ritz-Timme S, Cattaneo C, Collins MJ, Waite ER, Schütz HW, Kaatsch HJ, Borrman HI. 2000; Age estimation: the state of the art in relation to the specific demands of forensic practise. Int J Legal Med. 113:129–36. DOI: 10.1007/s004140050283. PMID: 10876982.
crossref
7. Willems G, Moulin-Romsee C, Solheim T. 2002; Non-destructive dental-age calculation methods in adults: intra- and inter-observer effects. Forensic Sci Int. 126:221–6. DOI: 10.1016/S0379-0738(02)00081-6. PMID: 12062945.
crossref
8. Mansour H, Fuhrmann A, Paradowski I, van Well EJ, Püschel K. 2017; The role of forensic medicine and forensic dentistry in estimating the chronological age of living individuals in Hamburg, Germany. Int J Legal Med. 131:593–601. DOI: 10.1007/s00414-016-1517-y. PMID: 28032243.
crossref
9. Takei T. 1984; Age estimation from dental attrition and state of dental treatment--by application of the theory of quantification type I. J Nihon Univ Sch Dent. 26:119–32. DOI: 10.2334/josnusd1959.26.119. PMID: 6592290.
10. Yun JI, Lee JY, Chung JW, Kho HS, Kim YK. 2007; Age estimation of Korean adults by occlusal tooth wear. J Forensic Sci. 52:678–83. DOI: 10.1111/j.1556-4029.2007.00414.x. PMID: 17456094.
crossref
11. Kim WH, Nam SE, Park YS, Lee SP. 2018; Maxillary first molar wear: a longitudinal study of children. Anat Cell Biol. 51:251–9. DOI: 10.5115/acb.2018.51.4.251. PMID: 30637159. PMCID: PMC6318455.
crossref
12. Lee SH, Nam SE, Lee SP. 2015; Evaluation of the effectiveness of the new tooth wear measurement parameters. Anat Cell Biol. 48:284–91. DOI: 10.5115/acb.2015.48.4.284. PMID: 26770880. PMCID: PMC4701703.
crossref
13. Shigefuji R, Serikawa M, Usami A. 2022; Observation of mandibular second molar roots and root canal morphology using dental cone-beam computed tomography. Anat Cell Biol. 55:155–60. DOI: 10.5115/acb.22.050. PMID: 35773218. PMCID: PMC9256481.
crossref
14. Yoza T, Serikawa M, Sugita T, Harada T, Usami A. 2021; Cone-beam computed tomography observation of maxillary first premolar canal shapes. Anat Cell Biol. 54:424–30. DOI: 10.5115/acb.21.110. PMID: 34465669. PMCID: PMC8693140.
crossref
15. Kvaal SI, Kolltveit KM, Thomsen IO, Solheim T. 1995; Age estimation of adults from dental radiographs. Forensic Sci Int. 74:175–85. DOI: 10.1016/0379-0738(95)01760-G. PMID: 7557754.
crossref
16. Paewinsky E, Pfeiffer H, Brinkmann B. 2005; Quantification of secondary dentine formation from orthopantomograms-a contribution to forensic age estimation methods in adults. Int J Legal Med. 119:27–30. DOI: 10.1007/s00414-004-0492-x. PMID: 15538610.
crossref
17. Roh BY, Lee WJ, Ryu JW, Ahn JM, Yoon CL, Lee SS. 2018; The application of the Kvaal method to estimate the age of live Korean subjects using digital panoramic radiographs. Int J Legal Med. 132:1161–6. DOI: 10.1007/s00414-017-1762-8. PMID: 29260393.
crossref
18. Drusini AG. 1993; Age estimation from teeth using soft X-ray findings. Anthropol Anz. 51:41–6. DOI: 10.1127/anthranz/51/1993/41. PMID: 8476273.
crossref
19. Jeon HM, Kim JH, Heo JY, Ok SM, Jeong SH, Ahn YW. 2015; Age estimation by radiological measuring pulp chamber of mandibular first molar in Korean adults. J Oral Med Pain. 40:146–54. DOI: 10.14476/jomp.2015.40.4.146.
20. Ikeda N, Umetsu K, Kashimura S, Suzuki T, Oumi M. 1985; Estimation of age from teeth with their soft X-ray findings. Nihon Hoigaku Zasshi. 39:244–50. Japanese. PMID: 4087521.
21. Solheim T. 1988; Dental color as an indicator of age. Gerodontics. 4:114–8. PMID: 3209032.
22. Yamashita H, Murase T, Kondo H, Umehara T, Abe Y, Shingu K, Shinba Y, Mitsuma M, Ikematsu K. 2022; Development of age-estimation formula using postmortem oral findings: a pilot study. Leg Med (Tokyo). 54:101973. DOI: 10.1016/j.legalmed.2021.101973. PMID: 34689115.
crossref
23. Azrak B, Victor A, Willershausen B, Pistorius A, Hörr C, Gleissner C. 2007; Usefulness of combining clinical and radiological dental findings for a more accurate noninvasive age estimation. J Forensic Sci. 52:146–50. DOI: 10.1111/j.1556-4029.2006.00300.x. PMID: 17209927.
crossref
24. Kawashima W, Uemura M, Toda I, Orihara H, Okusa N, Takemura A. 2016; Age estimation from mandibular angle and oral findings on three-dimensional computed tomography. J Osaka Dent Univ. 50:7–11.
25. Lee SS, Choi JH, Yoon CL, Kim CY, Shin KJ. 2004; The diversity of dental patterns in the orthopantomography and its significance in human identification. J Forensic Sci. 49:784–6. DOI: 10.1520/JFS2003339. PMID: 15317194.
crossref
26. Online Browsing Platform. 2016. Dentistry - designation system for teeth and areas of the oral cavity [Internet]. International Organization for Standardization;Available from: https://www.iso.org/obp/ui/#iso:std:iso:3950:ed-4:v1:en:en. cited 2013 Mar 13.
27. Kawashima W, Hatake K, Morimura Y, Kudo R, Nakanishi M, Tamaki S, Kasuda S, Yuui K, Ishitani A. 2013; A new quantitative multi-parameter method improves the accuracy of age estimation from oral findings. Res Pract Forensic Med. 56:211–8.
28. Lee YH, Auh QS, Chun YH, An JS. 2021; Age-related radiomorphometric changes on panoramic radiographs. Clin Exp Dent Res. 7:539–51. DOI: 10.1002/cre2.375. PMID: 33305888. PMCID: PMC8404498. PMID: 522e97b192ec4dfcae1d3c11ef3a0688.
crossref
29. Copeland LB, Krall EA, Brown LJ, Garcia RI, Streckfus CF. 2004; Predictors of tooth loss in two US adult populations. J Public Health Dent. 64:31–7. DOI: 10.1111/j.1752-7325.2004.tb02723.x. PMID: 15078059.
crossref
30. Lee SS, Byun YS, Park MJ, Choi JH, Yoon CL, Shin KJ. 2010; The chronology of second and third molar development in Koreans and its application to forensic age estimation. Int J Legal Med. 124:659–65. DOI: 10.1007/s00414-010-0513-x. PMID: 20830590.
crossref
31. Lee SS, Kim D, Lee S, Lee UY, Seo JS, Ahn YW, Han SH. 2011; Validity of Demirjian's and modified Demirjian's methods in age estimation for Korean juveniles and adolescents. Forensic Sci Int. 211:41–6. DOI: 10.1016/j.forsciint.2011.04.011. PMID: 21561728.
crossref
32. Cheong H, Lee SS. 2023; Evaluation of four criteria in assessing third molar maturity for age estimation in Koreans. Heliyon. 9:e13680. DOI: 10.1016/j.heliyon.2023.e13680. PMID: 36873551. PMCID: PMC9981921.
crossref
33. Kumagai A, Jeong S, Kim D, Kong HJ, Oh S, Lee SS. 2023; Validation of data mining models by comparing with conventional methods for dental age estimation in Korean juveniles and young adults. Sci Rep. 13:726. DOI: 10.1038/s41598-023-28086-1. PMID: 36639726. PMCID: PMC9839668. PMID: 20f7824a0c68487f9ddf44ef3d4eeb1b.
crossref
34. Kengkard P, Choovuthayakorn J, Mahakkanukrauh C, Chitapanarux N, Intasuwan P, Malatong Y, Sinthubua A, Palee P, Lampang SN, Mahakkanukrauh P. 2023; Convolutional neural network of age-related trends digital radiographs of medial clavicle in a Thai population: a preliminary study. Anat Cell Biol. 56:86–93. DOI: 10.5115/acb.22.205. PMID: 36655305. PMCID: PMC9989796.
crossref

Fig. 1
Age-related changes in mean numbers of teeth by dental codes. The x-axis represents the age group (in years), and the y-axis represents the mean number of teeth observed. The definitions for each code are provided in Table 2.
acb-56-4-474-f1.tif
Fig. 2
Comparison of coefficient of determination (adjusted R2) values for each regression model. The x-axis represents adjusted R2 values, and the y-axis represents regression models based on various combinations of sextants.
acb-56-4-474-f2.tif
Table 1
Mean ages of study samples by age group and sex
Age group (yr) Male Female Total
20s (20.00–29.99) 30 (24.50±2.92) 30 (24.74±3.08) 60 (24.62±2.98)
30s (30.00–39.99) 30 (34.58±2.92) 30 (34.62±2.92) 60 (34.60±2.89)
40s (40.00–49.99) 30 (44.56±2.96) 30 (44.64±2.97) 60 (44.60±2.94)
50s (50.00–59.99) 30 (54.65±2.95) 30 (54.64±2.92) 60 (54.64±2.91)
60s (60.00–69.99) 30 (64.60±2.92) 30 (64.70±2.85) 60 (64.65±2.86)
70s (70.00–79.99) 30 (74.56±2.92) 30 (74.57±2.93) 60 (74.56±2.90)
80s (80.00–89.99) 30 (84.25±2.98) 30 (84.12±2.70) 60 (84.19±2.82)
Total 210 (54.53±20.20) 210 (54.58±20.12) 420 (54.55±20.14)

Values are presented as number (mean±SD).

Table 2
Codes used to classify dental characteristics in this study
Code Description
V (virgin tooth) No evidence of dental disease, treatment, or anatomical abnormality
X (missing tooth) Extracted or congenital missing tooth
I (impacted tooth) Unerupted or impacted tooth
D (defect) Defect by dental caries, tooth fracture or fallen-out fillings
R (residual root) Remained root due to severe dental caries or trauma
T (root canal treatment) Root canal-filled tooth by endodontic treatment
F (filling) Filled tooth with any kind of restoration
P (prosthesis) Tooth with full-veneer crown
L (dental implant) Dental implant inserted into an edentulous area

The contents of this table were modified from the study by Lee et al. [25].

Table 3
Types of dental sextant combinations used to develop each regression model
Model Dental sextant combinations (types of teetha))
1 All six sextants (all teeth excluding four third molars)
2 Maxillary and mandibular anterior sextants (11, 12, 13, 21, 22, 23, 31, 32, 33, 41, 42, 43)
3 Maxillary and mandibular, right and left posterior sextants (14, 15, 16, 17, 24, 25, 26, 27, 34, 35, 36, 37, 44, 45, 46, 47)
4 Maxillary anterior sextant (11, 12, 13, 21, 22, 23)
5 Mandibular anterior sextant (31, 32, 33, 41, 42, 43)
6 Maxillary right and left posterior sextants (14, 15, 16, 17, 24, 25, 26, 27)
7 Mandibular right and left posterior sextants (34, 35, 36, 37, 44, 45, 46, 47)
8 Maxillary right posterior sextant (14, 15, 16, 17)
9 Maxillary left posterior sextant (24, 25, 26, 27)
10 Mandibular left posterior sextant (34, 35, 36, 37)
11 Mandibular right posterior sextant (44, 45, 46, 47)

a)The types of teeth were noted by FDI two-digit teeth designation system [26].

Table 4
Descriptive statistics of the number of teeth per individual for each dental code by age group
Age group (yr) V X T F P L
20s 24.27±3.97 0.68±1.44 0.83±1.81 2.08±2.81 0.77±1.67 0.02±0.13
30s 21.22±4.34 0.72±1.33 1.60±2.04 3.95±3.46 1.93±2.46 0.10±0.44
40s 20.72±4.50 1.23±1.97 1.82±2.56 3.27±2.68 2.83±3.16 0.22±0.61
50s 19.38±6.45 2.02±3.36 1.80±2.36 2.10±2.70 4.88±5.19 0.68±1.52
60s 15.13±7.62 4.20±5.03 2.33±2.54 1.70±2.53 7.88±6.48 1.67±2.94
70s 14.43±7.52 5.10±5.17 3.05±3.09 0.87±1.32 8.35±5.64 1.30±2.34
80s 8.90±7.53 8.90±8.00 3.07±2.69 0.90±1.47 9.62±6.23 2.58±4.07

Values are presented as mean±SD. The definitions for each code are provided in Table 2.

Table 5
Frequency of dental codes observed among study subjects by age group
Age group (yr) Percentages (NSC/TNS)
V X T F P L
20s 100.0 (60/60) 20.0 (12/60) 30.0 (18/60) 53.3 (32/60) 28.3 (17/60) 1.7 (1/60)
30s 100.0 (60/60) 31.7 (19/60) 58.3 (35/60) 78.3 (47/60) 61.7 (37/60) 6.7 (4/60)
40s 100.0 (60/60) 45.0 (27/60) 58.3 (35/60) 75.0 (45/60) 73.3 (44/60) 13.3 (8/60)
50s 98.3 (59/60) 58.3 (35/60) 58.3 (35/60) 63.3 (38/60) 78.3 (47/60) 25.0 (15/60)
60s 91.7 (55/60) 71.7 (43/60) 73.3 (44/60) 53.3 (32/60) 90.0 (54/60) 48.3 (29/60)
70s 93.3 (56/60) 85.0 (51/60) 78.3 (47/60) 43.3 (26/60) 93.3 (56/60) 33.3 (20/60)
80s 78.3 (47/60) 93.3 (56/60) 81.7 (49/60) 35.0 (21/60) 95.0 (57/60) 48.3 (29/60)

The definitions for each code are provided in Table 2. NSC, number of subjects where the code was observed; TNS, total number of subjects.
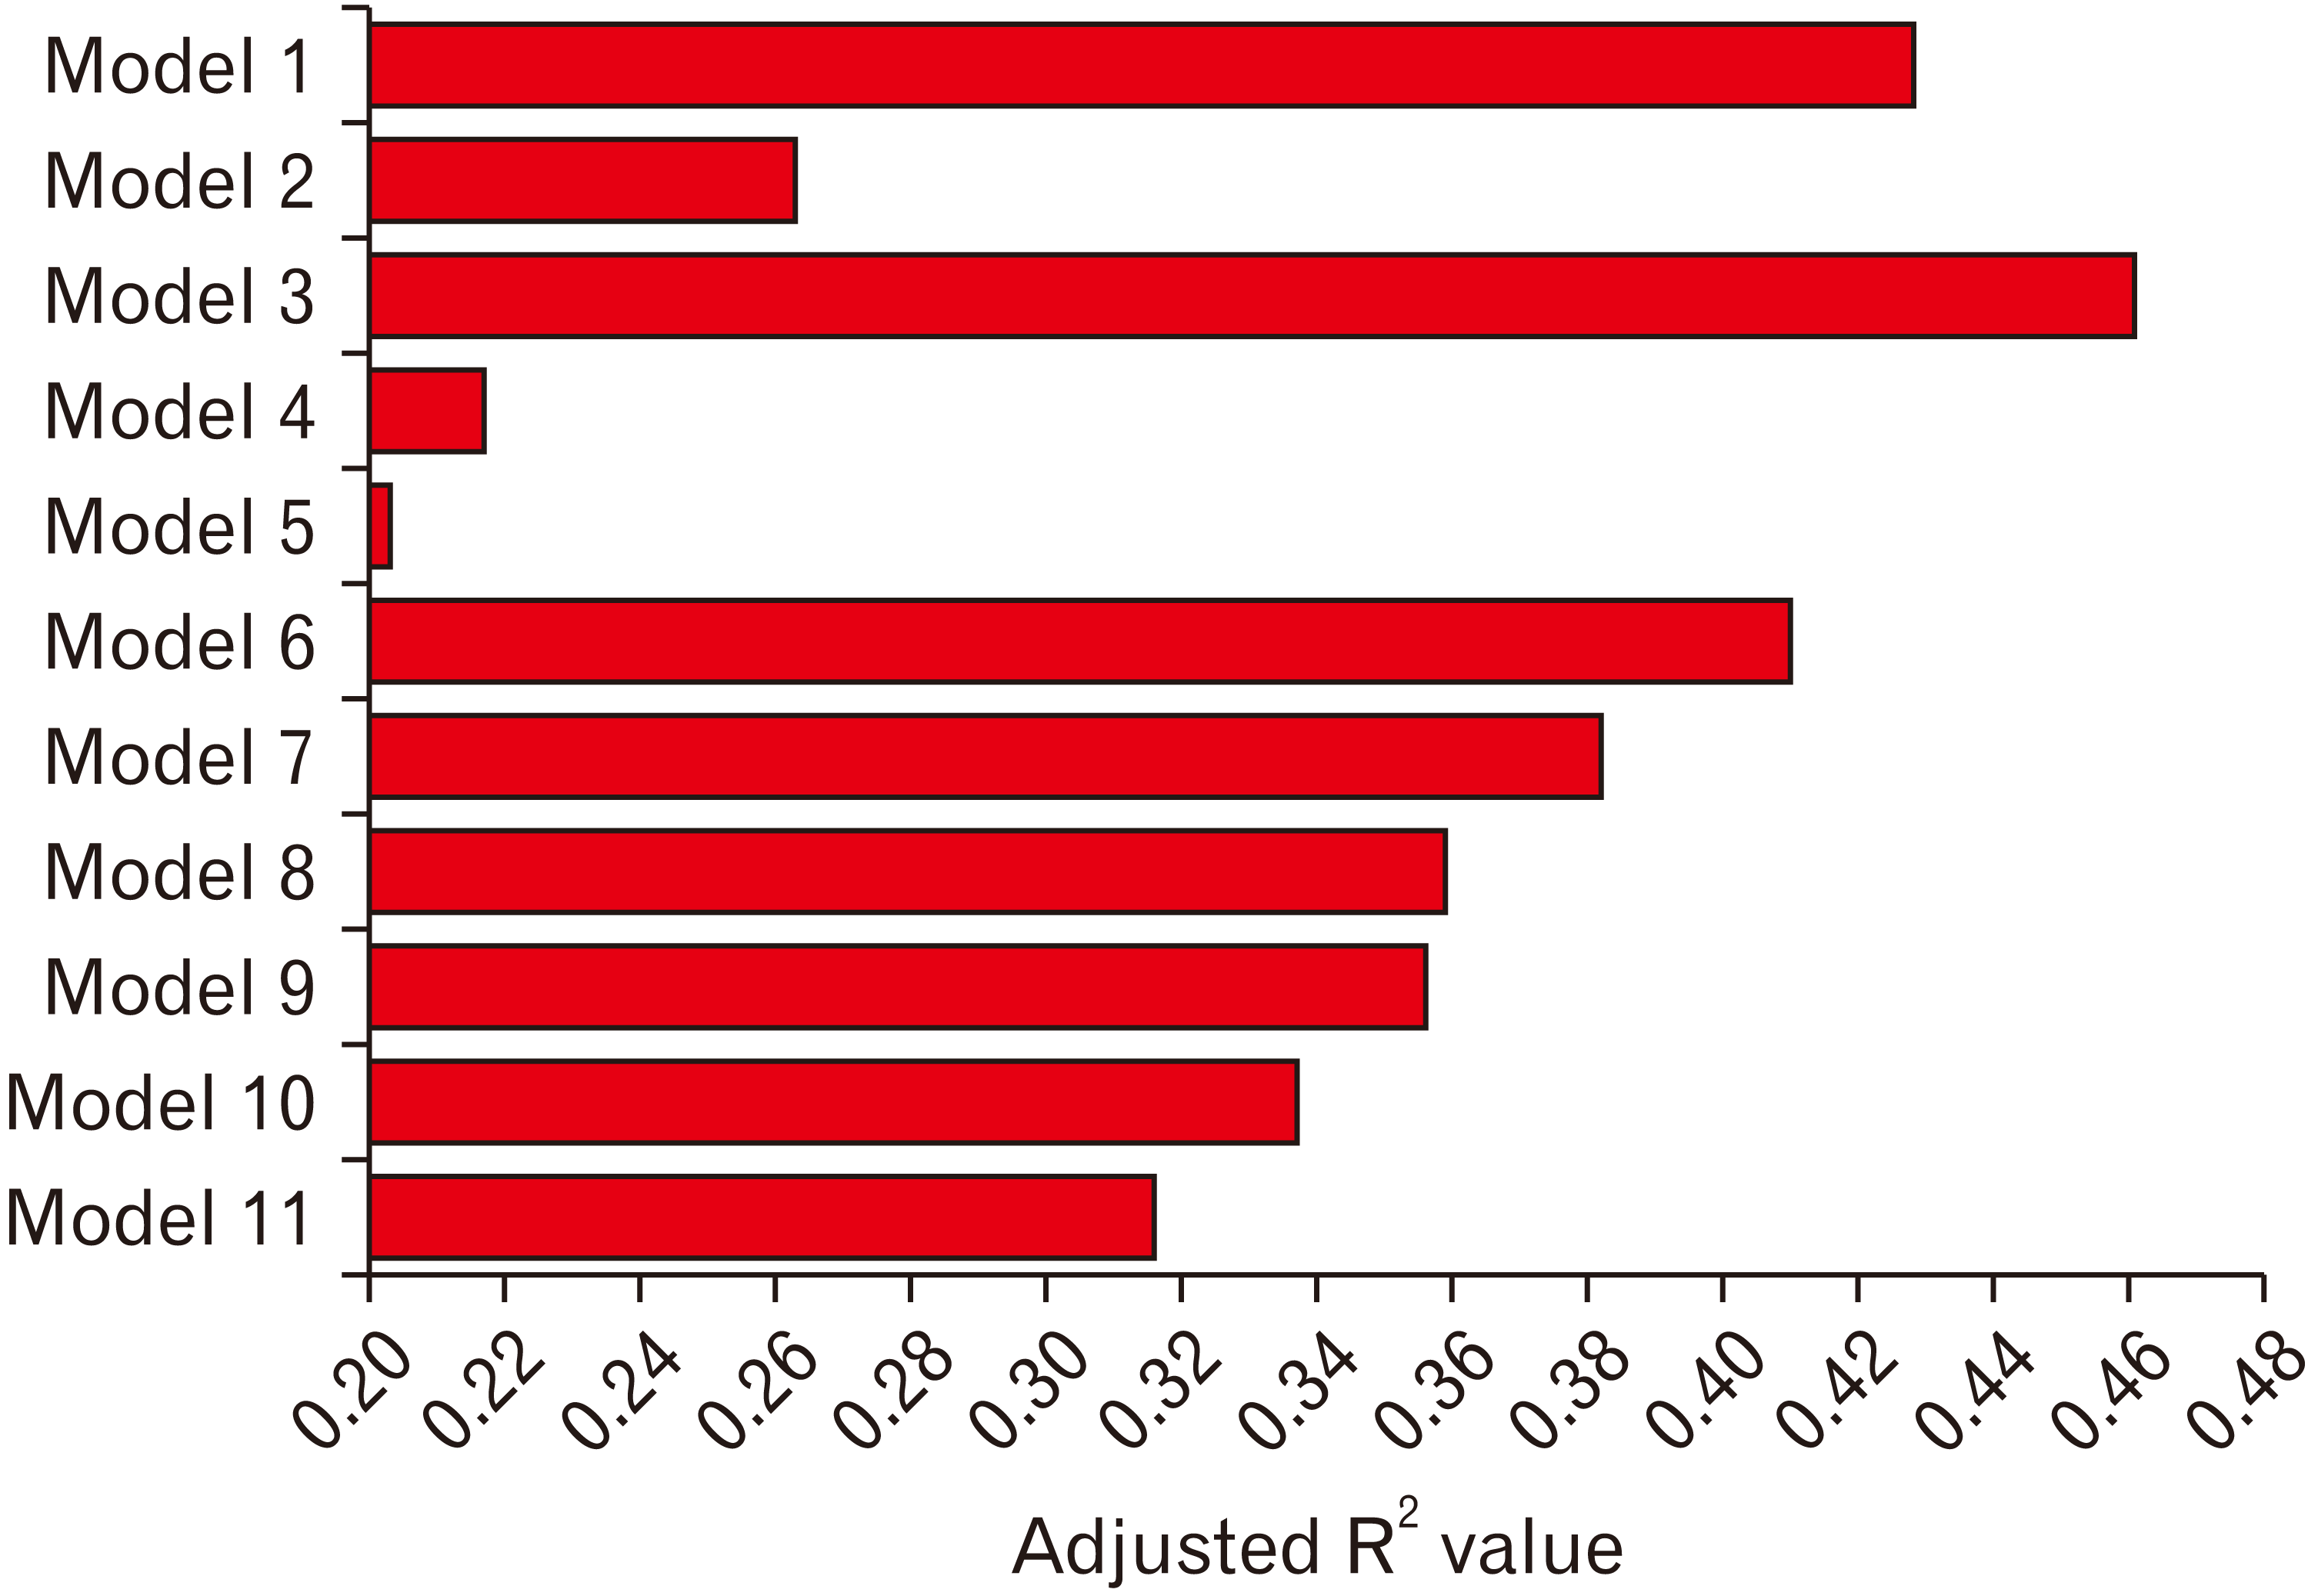
Table 6
Pearson’s correlation coefficients between the number of dental codes for each tooth type and chronological age
Tooth type Pearson’s correlation coefficient
V X T F P L
11 –0.4156* 0.3126* 0.0682 –0.0124 0.3015* 0.0815
12 –0.4031* 0.3148* 0.0493 0.0298 0.2666* 0.0924
13 –0.4451* 0.2428* 0.1310* 0.0510 0.3372* 0.0932
14 –0.3466* 0.2158* 0.1698* –0.0065 0.2932* 0.0965*
15 –0.4176* 0.3664* 0.0448 –0.0279 0.2948* 0.1477*
16 –0.3364* 0.3809* 0.0491 –0.2219* 0.2578* 0.2121*
17 –0.3965* 0.4551* 0.0761 –0.2349* 0.2509* 0.2048*
21 –0.3961* 0.3412* 0.0537 –0.0472 0.2780* 0.1231*
22 –0.4188* 0.3009* 0.0888 0.0526 0.2679* 0.0819
23 –0.4252* 0.2446* 0.1886* 0.1038* 0.3019* 0.1368*
24 –0.3085* 0.1532* 0.1213* –0.0434 0.3080* 0.1430*
25 –0.4041* 0.3763* –0.0027 –0.1216* 0.2908* 0.2228*
26 –0.3356* 0.3940* 0.0194 –0.2451* 0.2458* 0.2231*
27 –0.4486* 0.4461* 0.1385* –0.1858* 0.2756* 0.1676*
31 –0.4091* 0.3379* 0.1436* 0.0816 0.3372* N/A
32 –0.4113* 0.2100* 0.2440* 0.0894 0.3393* 0.0812
33 –0.4388* 0.1453* 0.2473* 0.1072* 0.3545* 0.1219*
34 –0.2717* 0.0312 0.1922* –0.0284 0.3319* 0.0686
35 –0.4119* 0.2591* 0.1579* –0.1139* 0.3661* 0.2425*
36 –0.3201* 0.3320* 0.0039 –0.2641* 0.3069* 0.2616*
37 –0.3992* 0.3975* 0.0111 –0.2186* 0.2463* 0.2385*
41 –0.4461* 0.3339* 0.1747* 0.0610 0.3504* 0.0727
42 –0.3928* 0.2780* 0.1707* 0.0459 0.3236* 0.0907
43 –0.3982* 0.2141* 0.2453* 0.0725 0.3114* 0.0988*
44 –0.2922* 0.0135 0.1763* 0.0641 0.3143* 0.1469*
45 –0.3769* 0.2350* 0.0909 –0.0789 0.3217* 0.2089*
46 –0.2889* 0.2995* 0.0492 –0.2943* 0.3274* 0.2738*
47 –0.2999* 0.3585* 0.0906 –0.3371* 0.3543* 0.2752*

All teeth were noted by FDI two-digit teeth designation system [26]. The definitions for each code are provided in Table 2. N/A, not applicable because no corresponding tooth features were observed on this tooth. *P<0.05 indicates a statistically significant difference.

Table 7
Regression coefficients and intercepts for each regression model
Model Regression coefficient Intercept RMSE Adjusted R2
X T F P L
1 1.2297 –0.8000 1.3630 0.6146 44.6007 15.23 0.428
2 2.7104 0.8056 4.0983 2.0237 0.1095 47.7651 17.29 0.263
3 2.1843 –0.1606 –0.9838 2.0053 1.3055 43.2551 14.78 0.461
4 5.1009 0.3975 2.8551 3.2191 –0.0197 48.6726 17.82 0.217
5 3.9631 4.9724 4.4389 2.0375 2.6087 50.1641 17.97 0.203
6 4.3936 –0.3069 –1.0094 3.2746 2.3317 43.9809 15.47 0.410
7 3.7016 1.1833 –2.0332 2.5289 3.0484 45.2356 15.84 0.382
8 8.2244 1.0174 –0.8828 5.0656 5.3541 44.6858 16.12 0.359
9 8.1377 –0.9491 –1.4448 5.1323 4.3783 45.1623 16.16 0.356
10 7.6472 1.3545 –2.0642 3.9179 7.0789 45.1088 16.40 0.337
11 6.4304 2.3798 –3.5051 3.8799 5.0626 47.1227 16.66 0.316

This multiple linear regression was performed with the number of teeth observed for dental codes and chronological age. The estimated age can be calculated as the sum of the products of each number of teeth observed for a dental code and its respective coefficient plus its respective intercept. The definitions for each code are provided in Table 2. RMSE, root mean square error; adjusted R2, coefficient of determination.

TOOLS
Similar articles