Introduction
Materials and Methods
Subjects
Immunohistochemistry
Gene Scores Using the Cancer Genome Atlas (TCGA) Database
Cell Lines and Transfection
RNA Extraction and Quantitative PCR
Western Blot Analysis
DL-Serine Assay
Human PHGDH Small Interfering (si) RNA and PHGDH Inhibitor (NCT-503)
Cell Migration Assay
Statistics
Results
High Expressed PHGDH is Positively Correlated with GLUT1 Expression, and Related to Tumor Aggressiveness
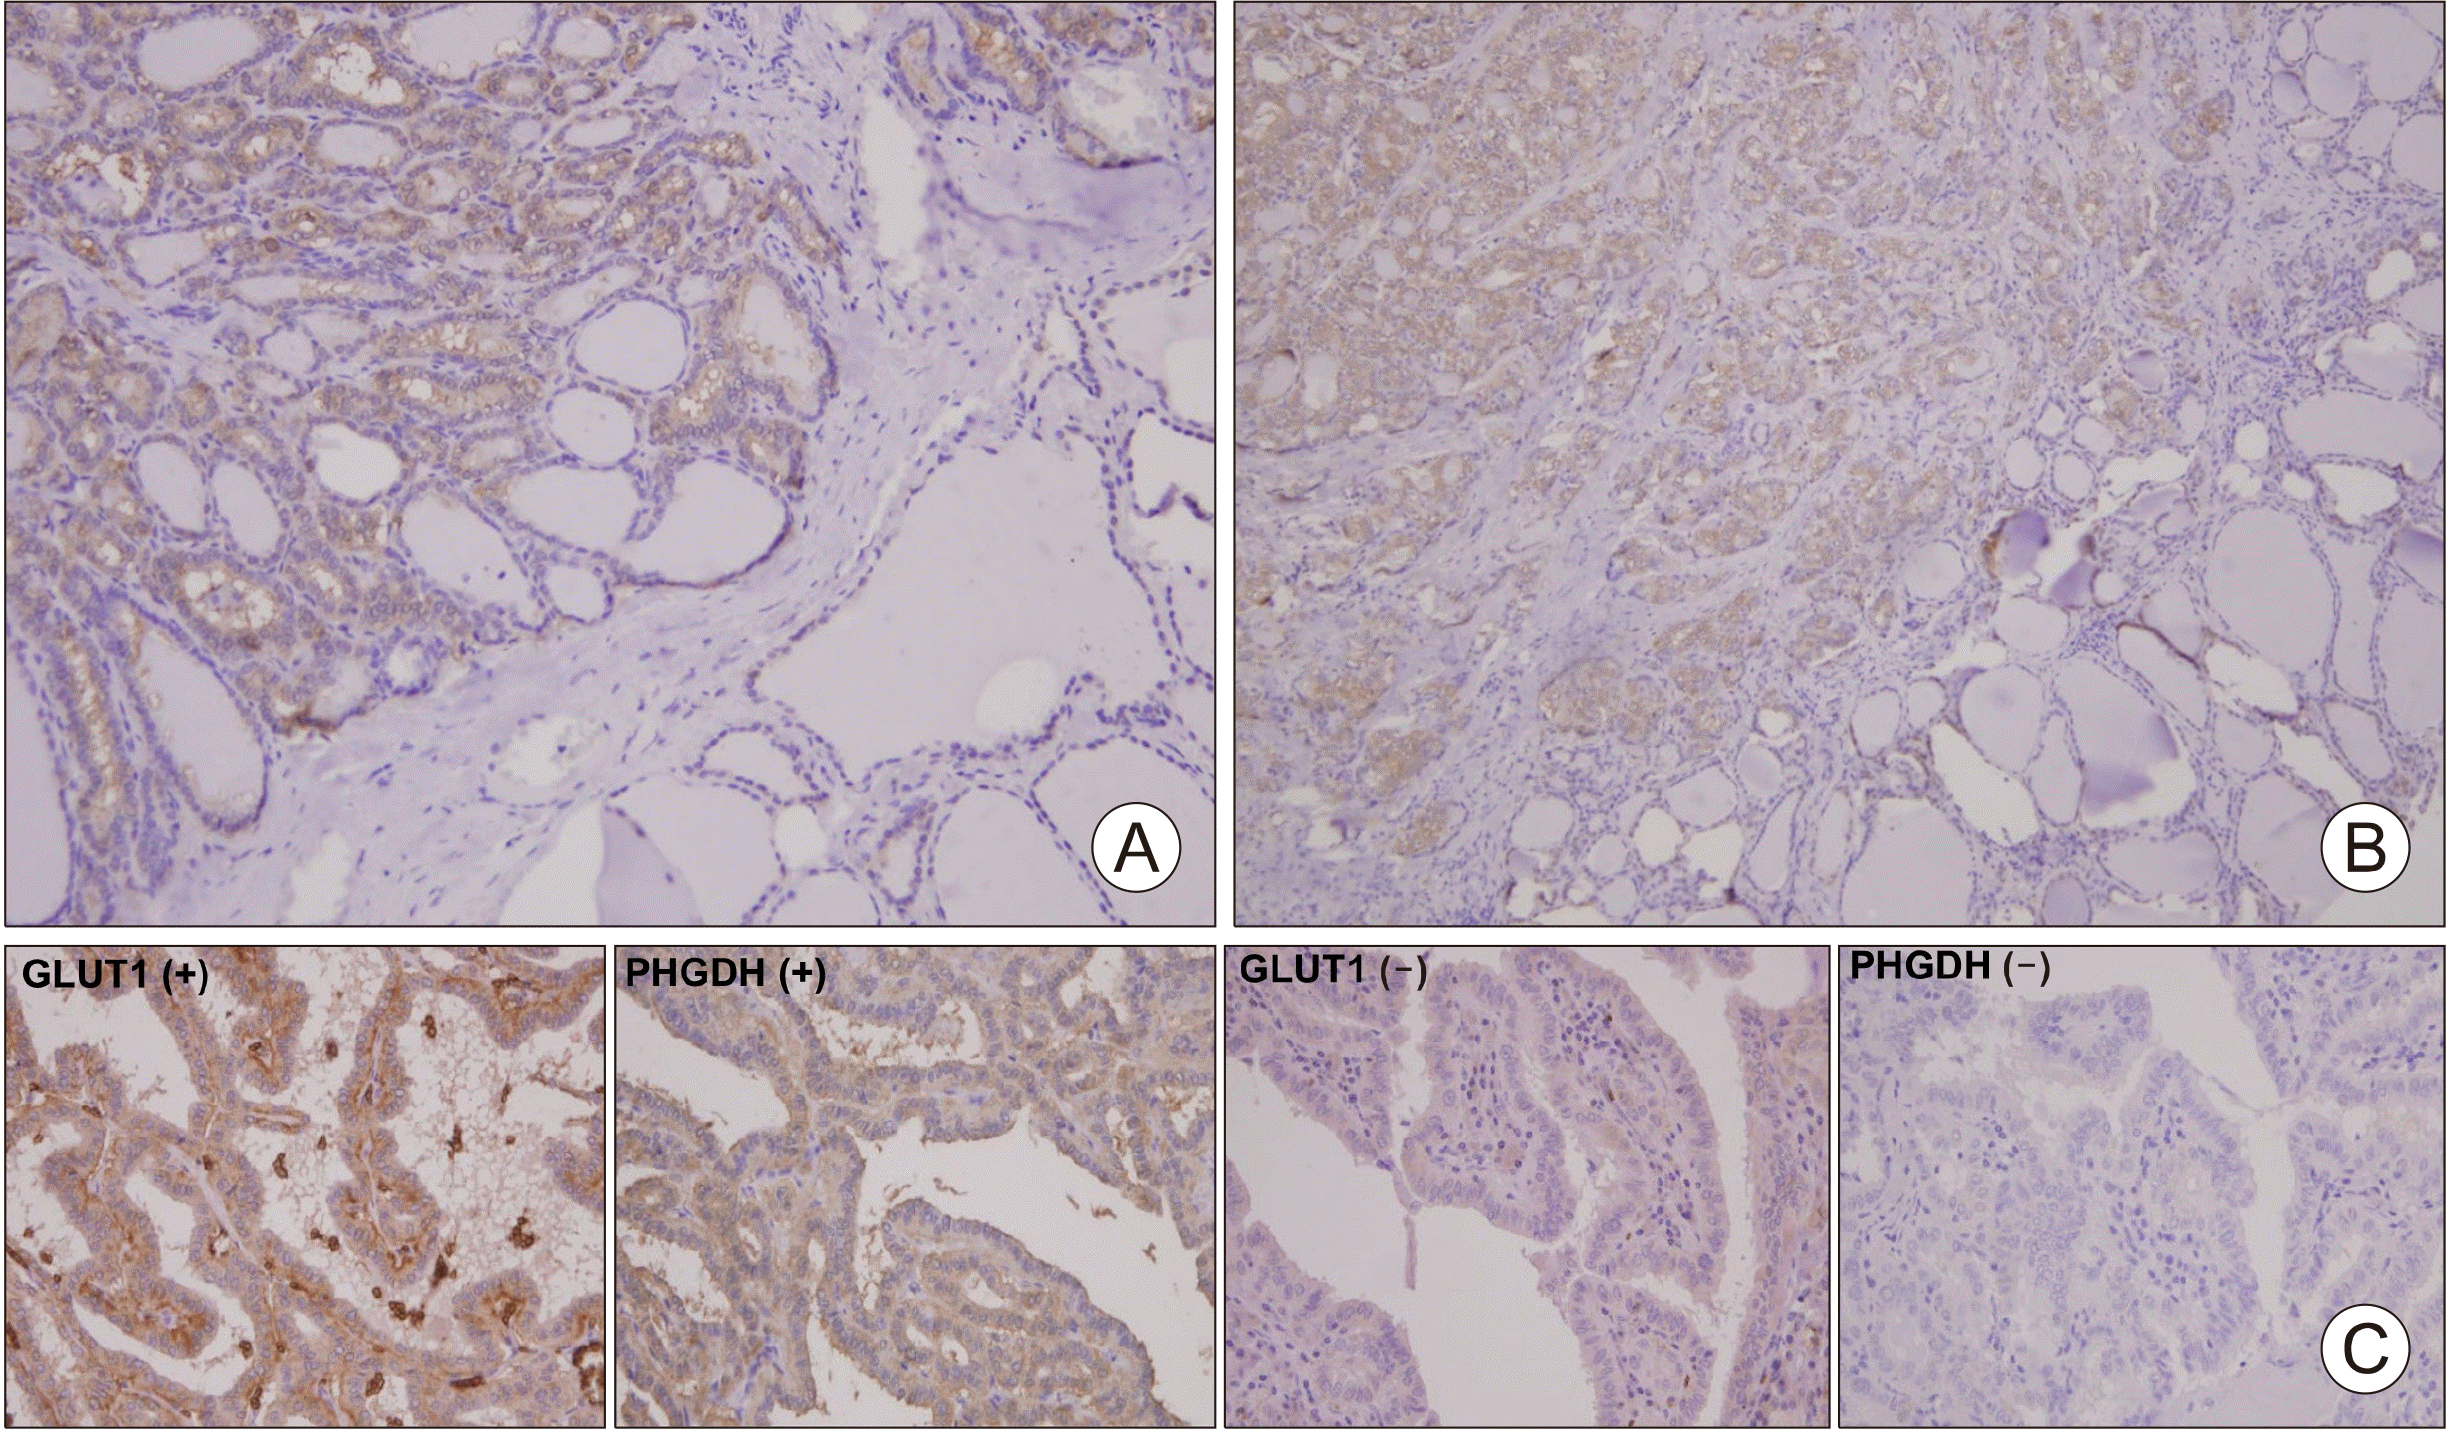
 | Fig. 1Immunohistochemical evaluation of PHGDH and GLUT1 expression in papillary thyroid carcinoma (PTC) tissue. (A, B) Representative immunohistochemical images of PHGDH (×50). (C) Representative immunohistochemical images of PHGDH and GLUT1 (×100). |
Table 1
Data are presented as n (%) or mean±standard deviation unless otherwise noted. p-values were obtained from unpaired t-tests for continuous parametric variables and the Mann–Whitney U test for nonparametric variables. The chi-squared test and Fisher’s exact test were used to evaluate the significance of the correlations of PHGDH expression with clinical and pathological parameters. AJCC: American Joint Committee on Cancer, GLUT1: glucose transporter 1, ETE: extrathyroidal extension, LNM: lymph node metastasis, LVI: lymphovascular invasion, PHGDH: phosphoglycerate dehydrogenase
The Glucose Utility are Significantly Associated with de novo Serine Biosynthetic Pathway in Papillary Thyroid Cancer
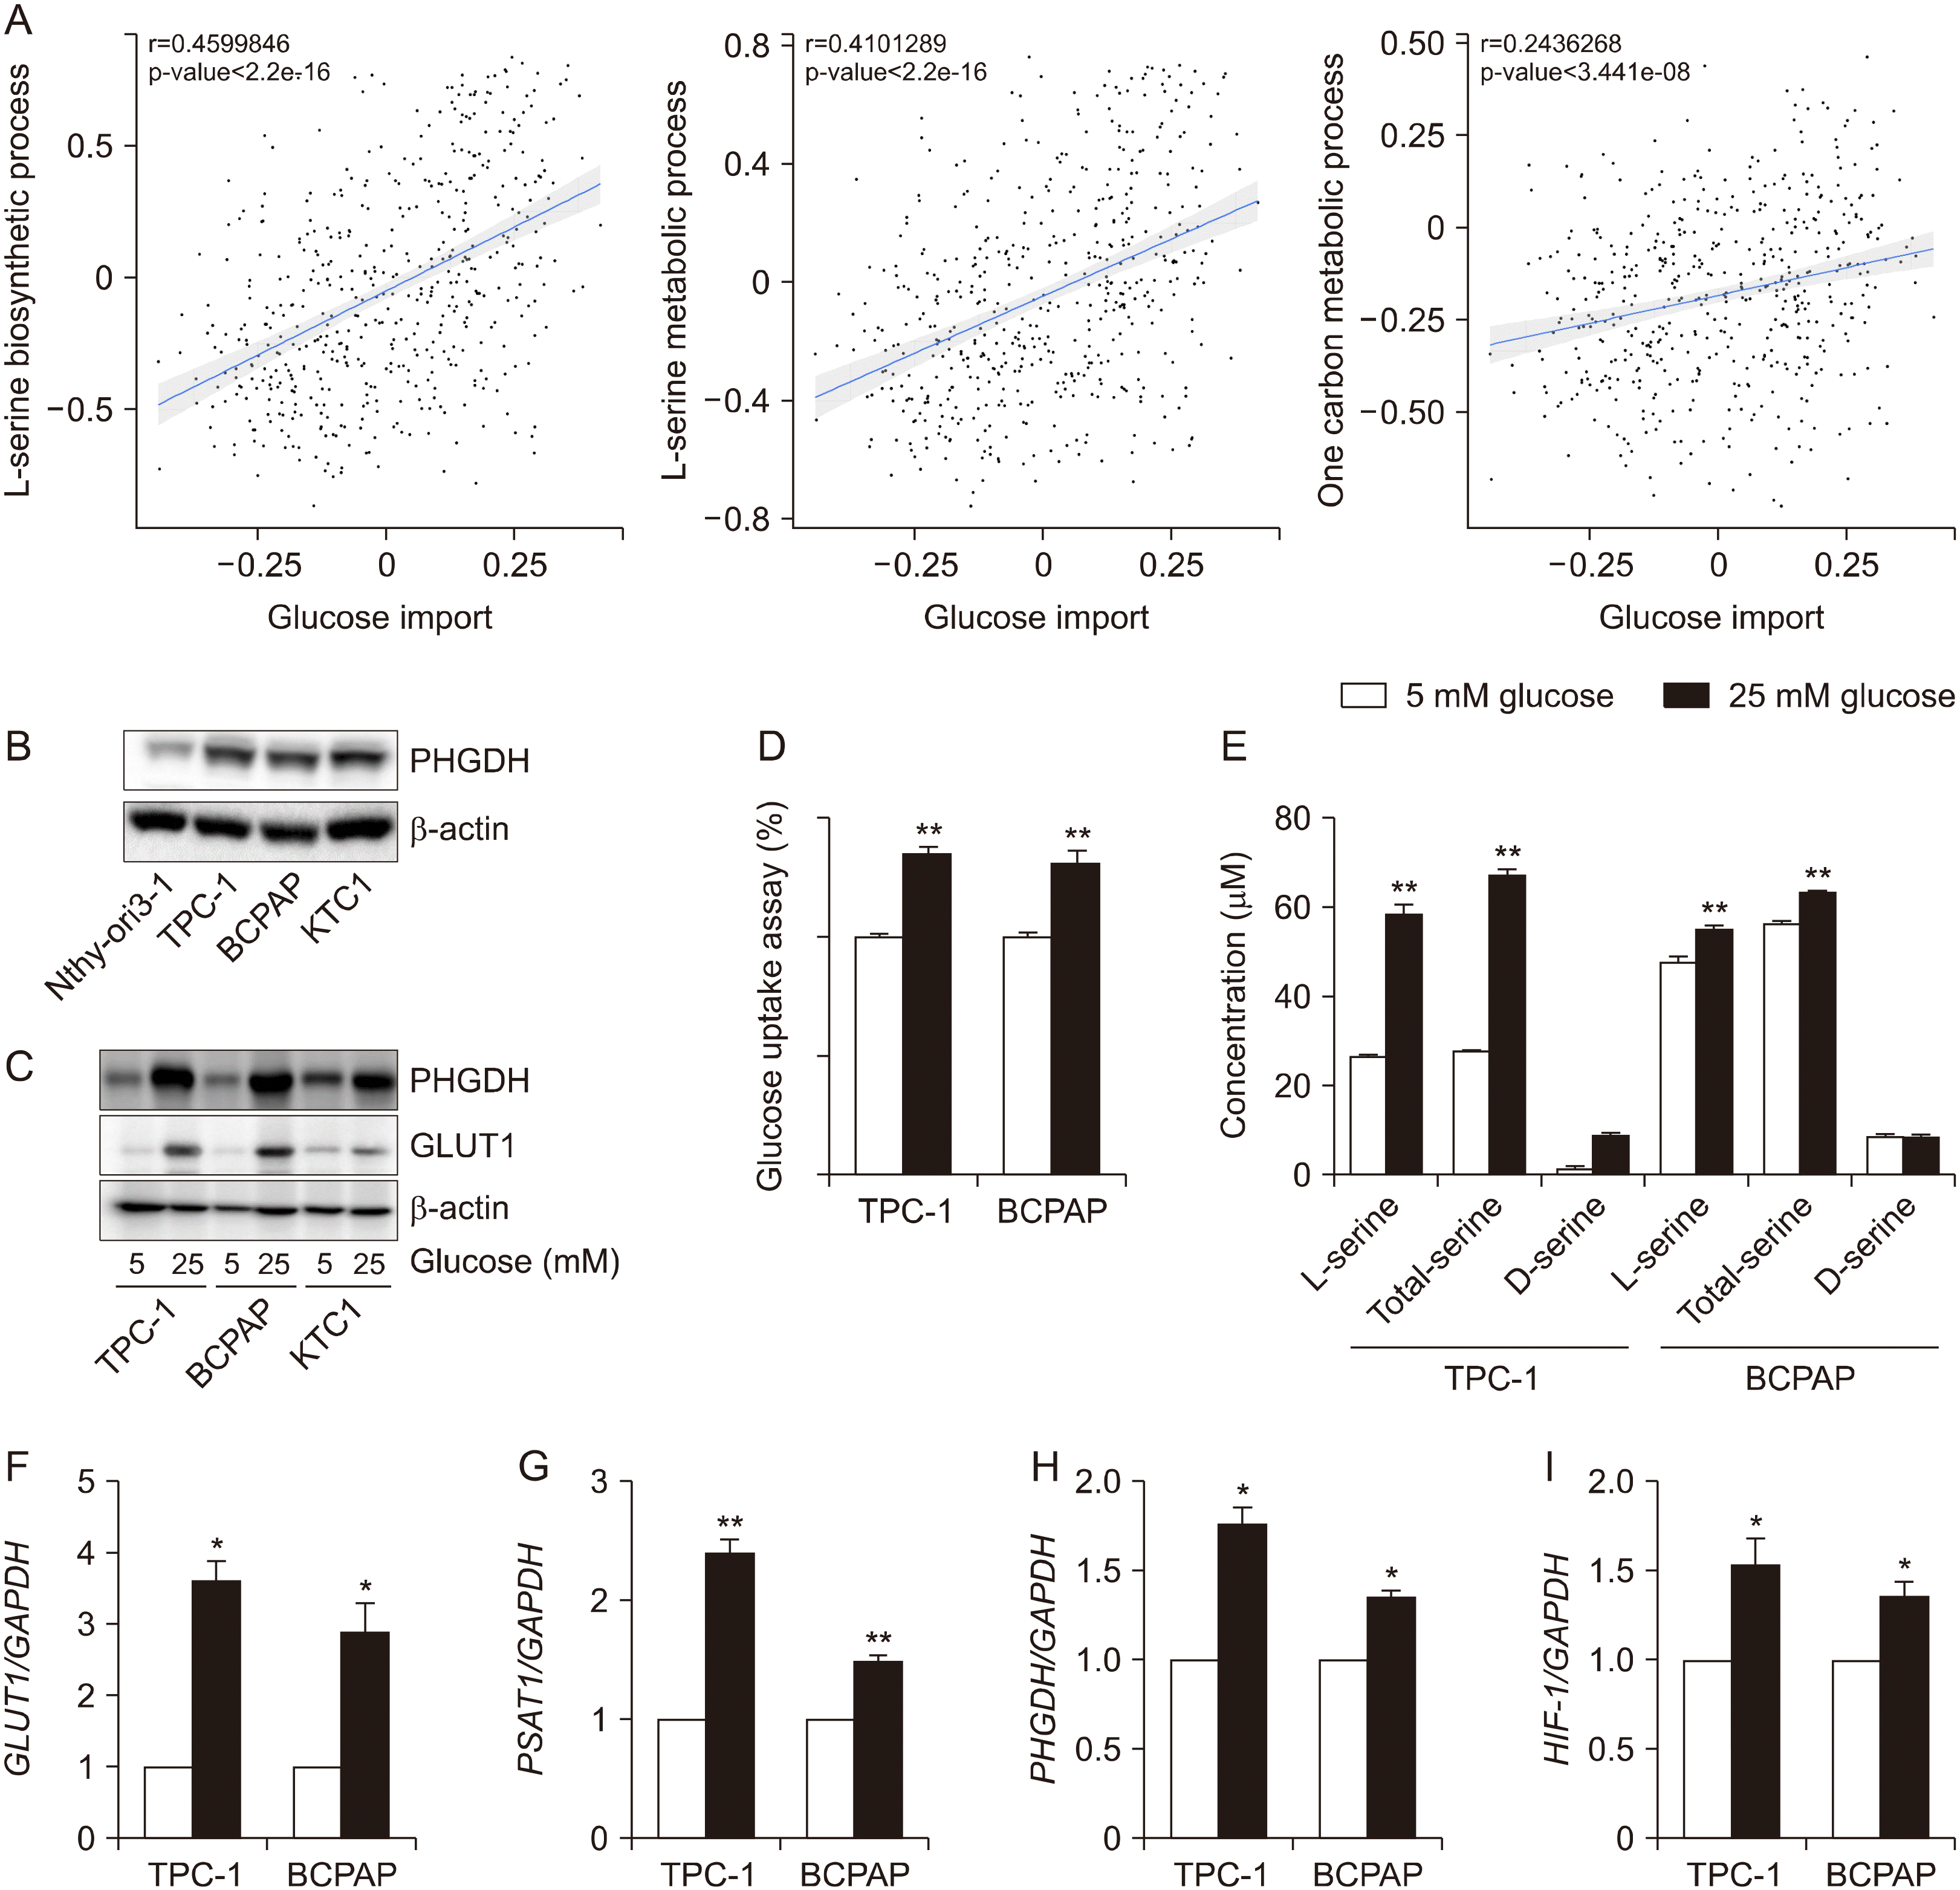
 | Fig. 2The relationship of glucose import and serine biosynthetic pathway through PHGDH in papillary thyroid cancer. (A) The correlation plot of glucose import and serine related pathway using Gene score in TCGA-THCA cohort. (B) Representative Western blot images of PHGDH expression in thyroid cell lines. (C) Representative Western blot images of GLUT1 expression and PHGDH expression in thyroid cell lines in relation to glucose concentrations in media. (D) Glucose uptake in TPC-1 and BCPAP cells in relation to glucose concentrations in media. (E) Serine concentrations in TPC-1 and BCPAP cells in relation to glucose concentrations in media. (F-I) Real time PCR analysis of GLUT1, PSAT1, PHGDH, and HIF-1a in TPC-1 and BCPAP cells in relation to glucose concentrations in media. These experiments are representative of more than three independent experiments. *p<0.05, **p<0.01 |
The Effect of Downregulation or Inhibition of PHGDH were More Increased in High Glucose Utility Condition
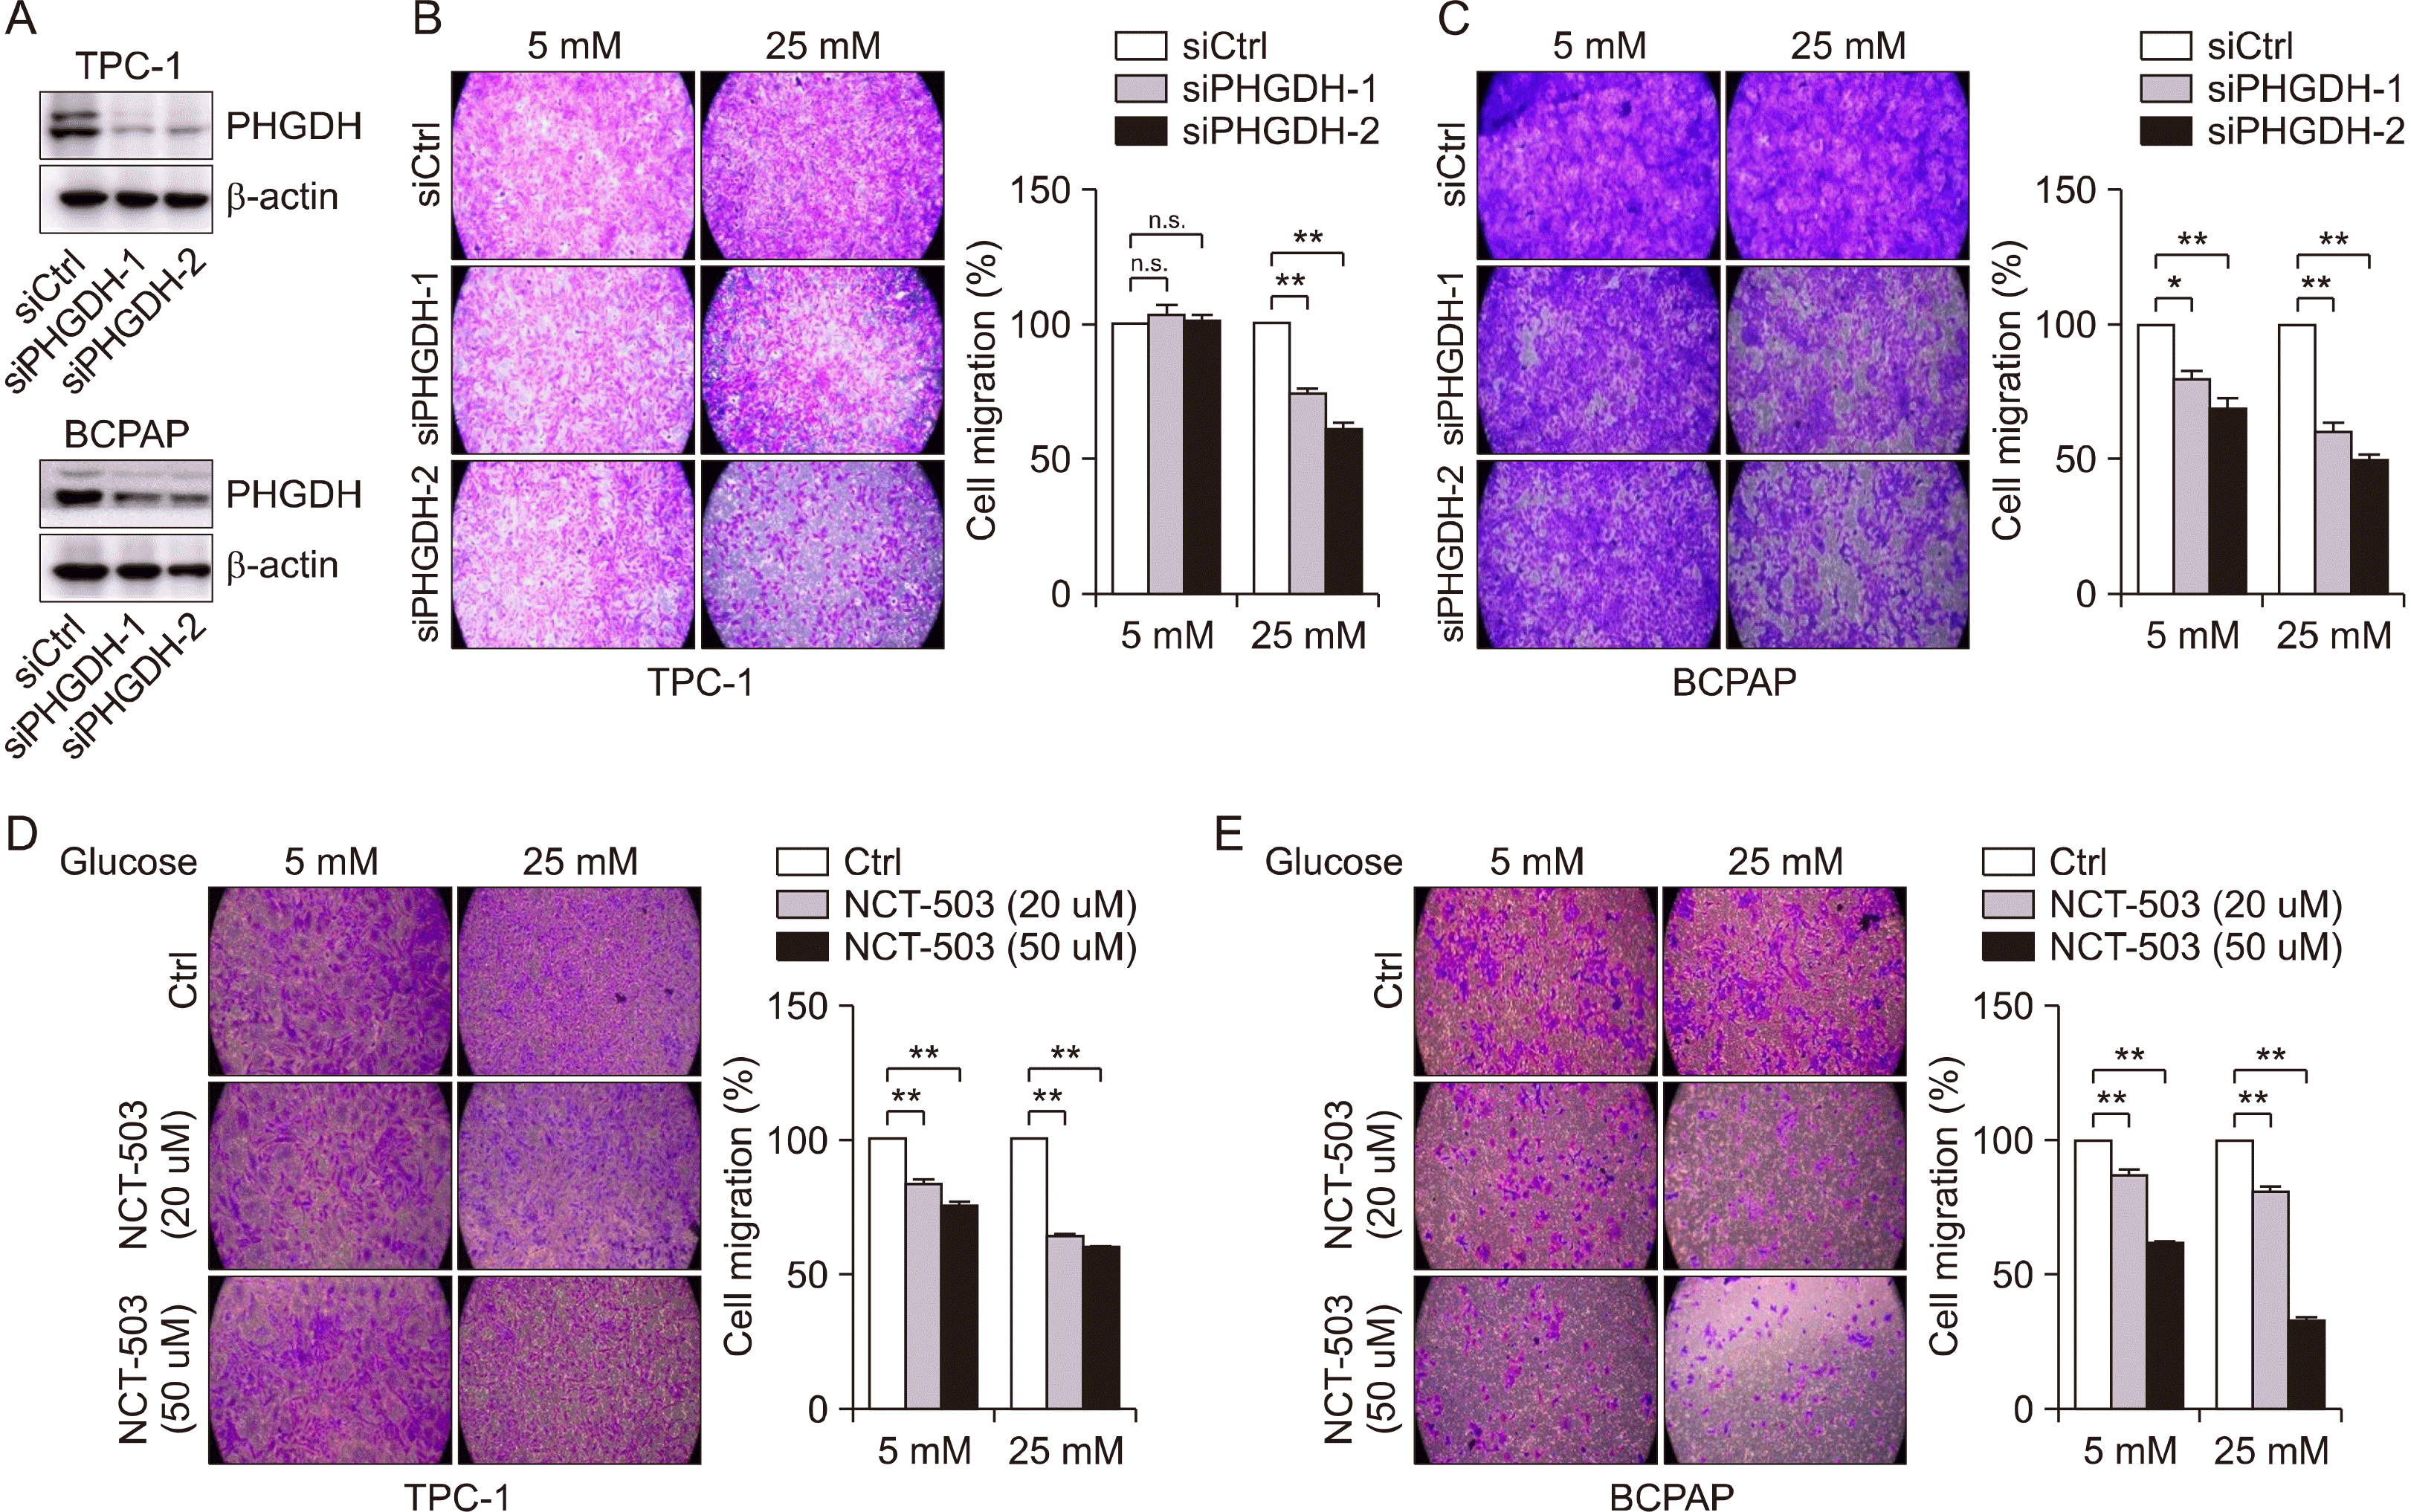
 | Fig. 3Decrease of cell migration by siPHGDH or NCT503 in papillary thyroid cancer cell lines in relation to glucose utility. (A) Representative Western blot images of PHGDH expression in TPC-1 and BCPAP cells after knockdown of PHGDH. (B) Migration assay in TPC-1 cells with siPHGDH in relation to glucose concentrations in media. (C) Migration assay in BCPAP cells with siPHGDH in relation to glucose concentrations in media. (D) Migration assay in TPC-1 cells with NCT503 in relation to glucose concentrations in media. (E) Migration assay in BCPAP cells with NCT503 in relation to glucose concentrations in media. These experiments are representative of more than three independent experiments. *p<0.05, **p<0.01 |


 PDF
PDF Citation
 Print
Print


 XML Download