INTRODUCTION
MATERIALS AND METHODS
Definitions
Indications for surgery
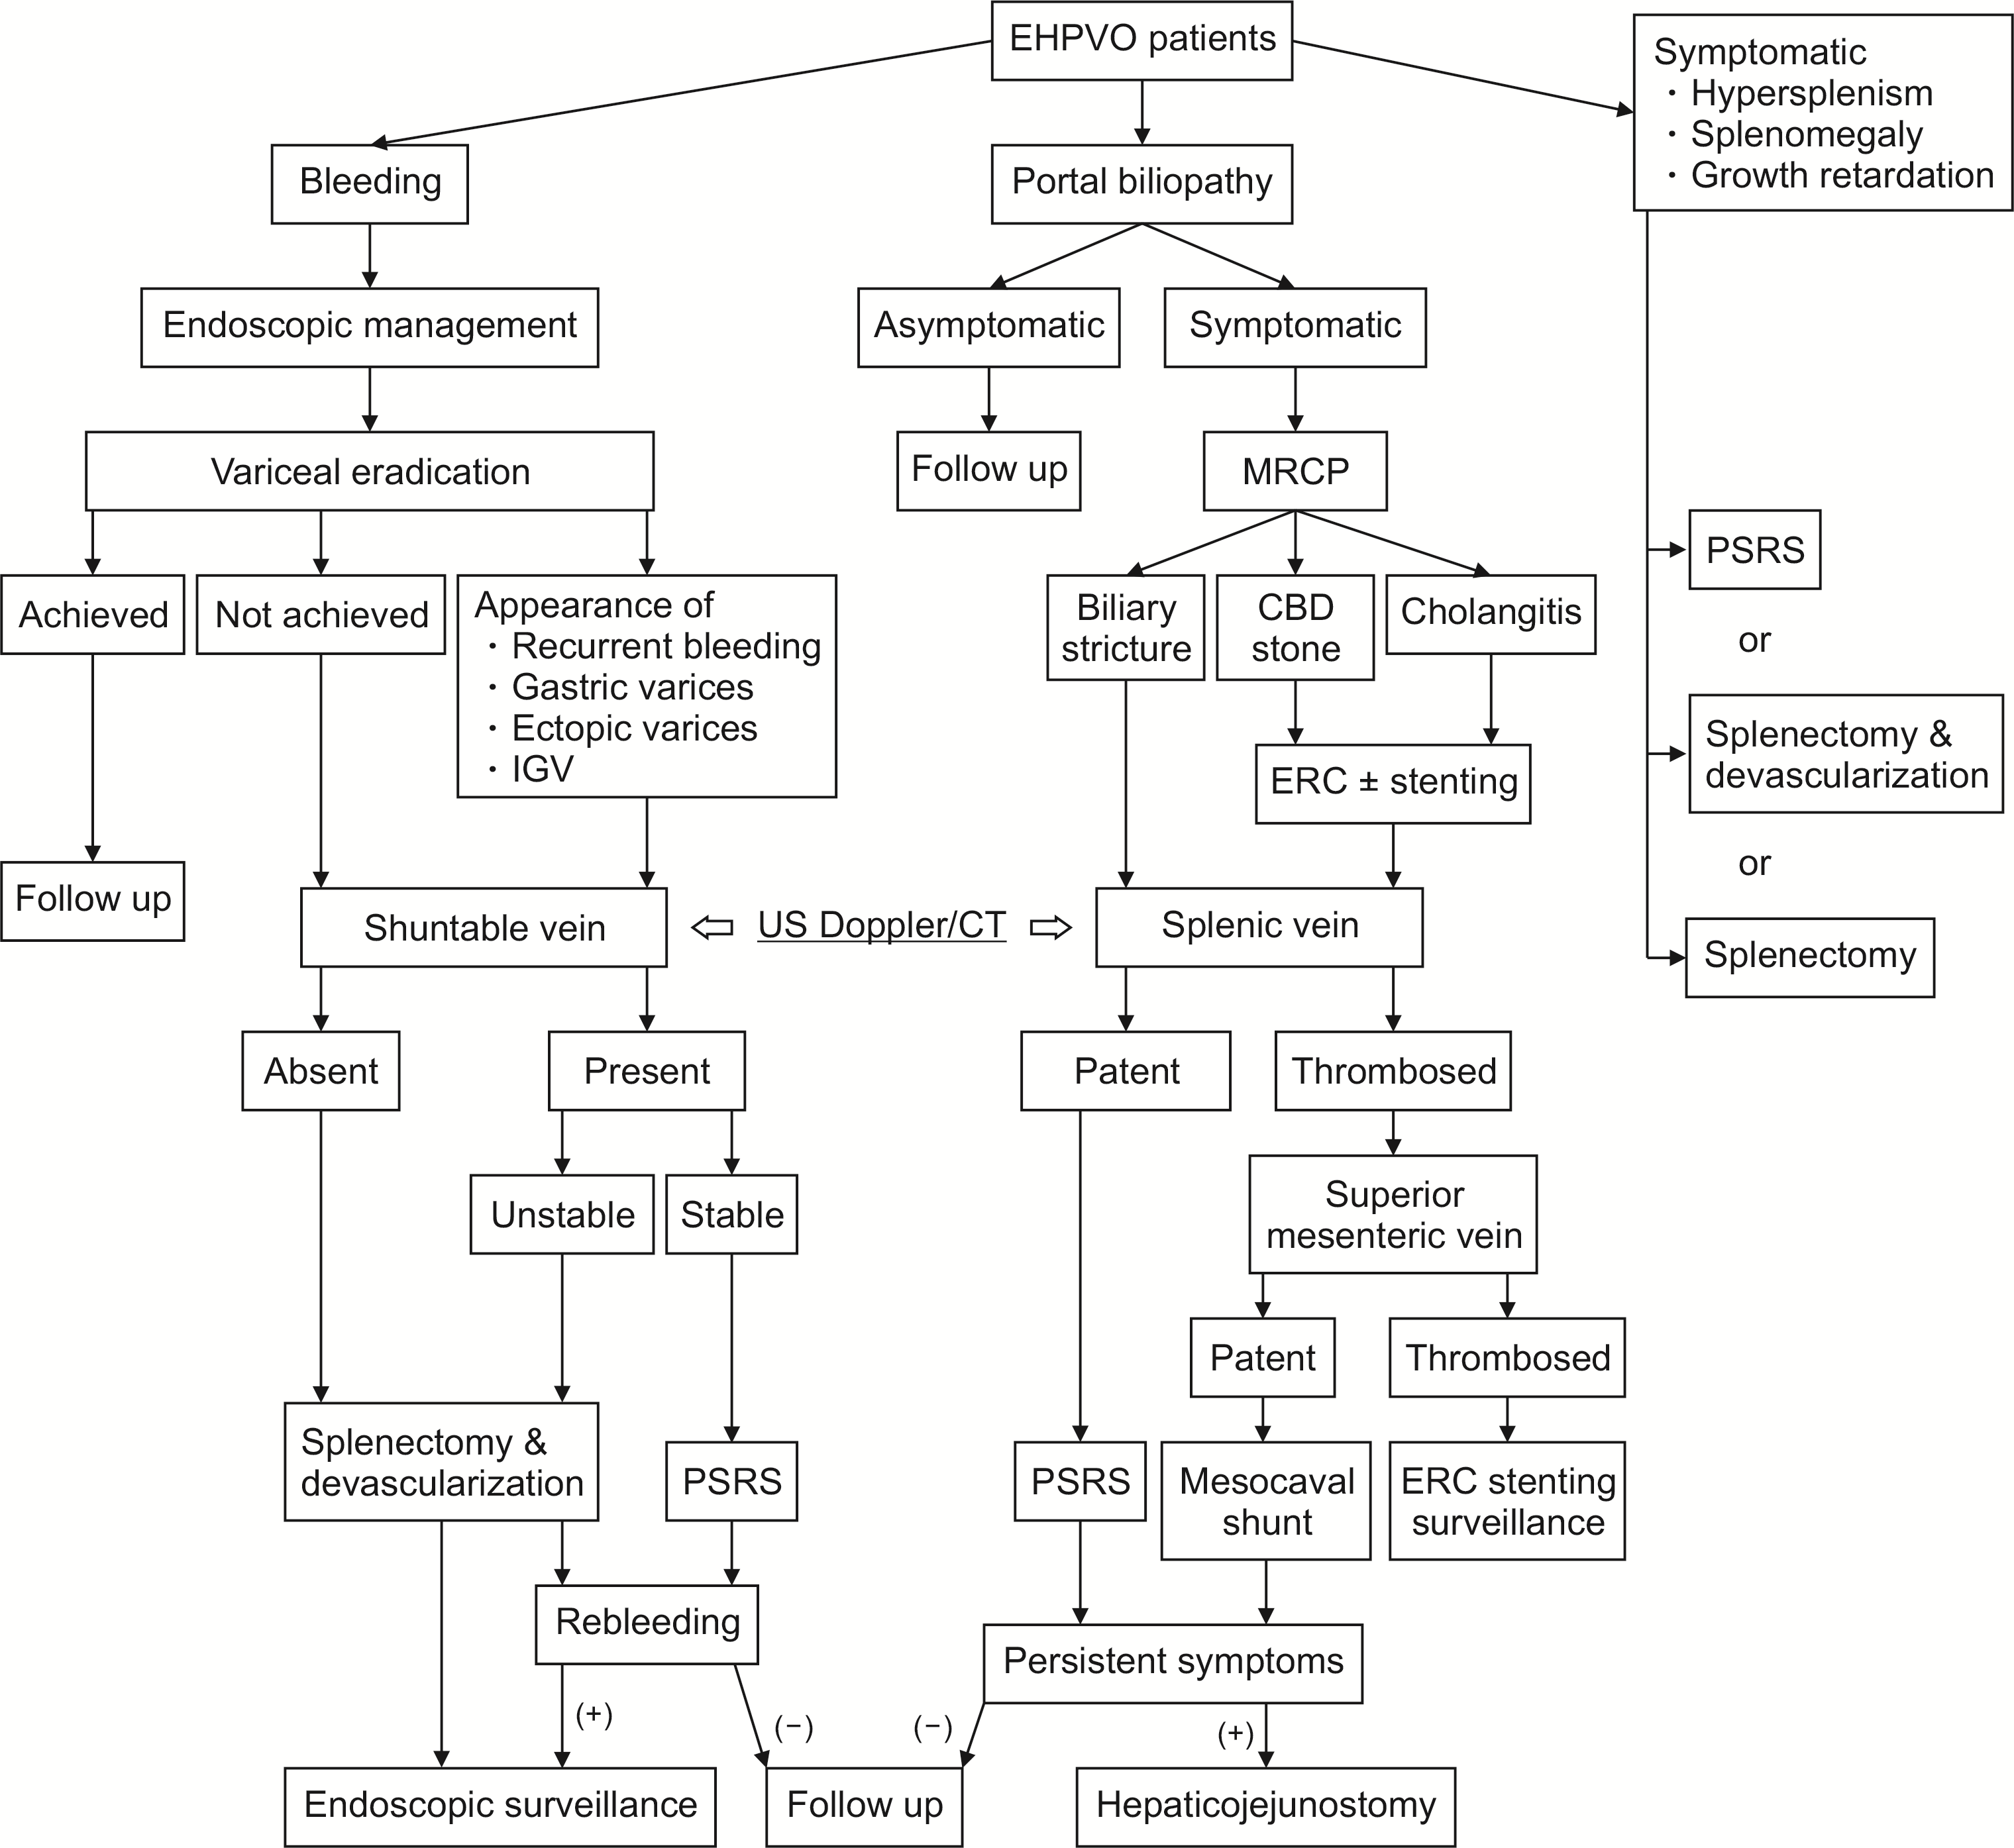
 | Fig. 2Treatment algorithm. EHPVO, extra hepatic portal venous obstruction; IGV, isolated gastric varix; MRCP, magnetic resonance cholangiopancreatography; CBD, common bile duct; ERC, endoscopic retrograde cholangiography; US, ultrasonography; CT, computed tomography; PSRS, proximal splenorenal shunt. |
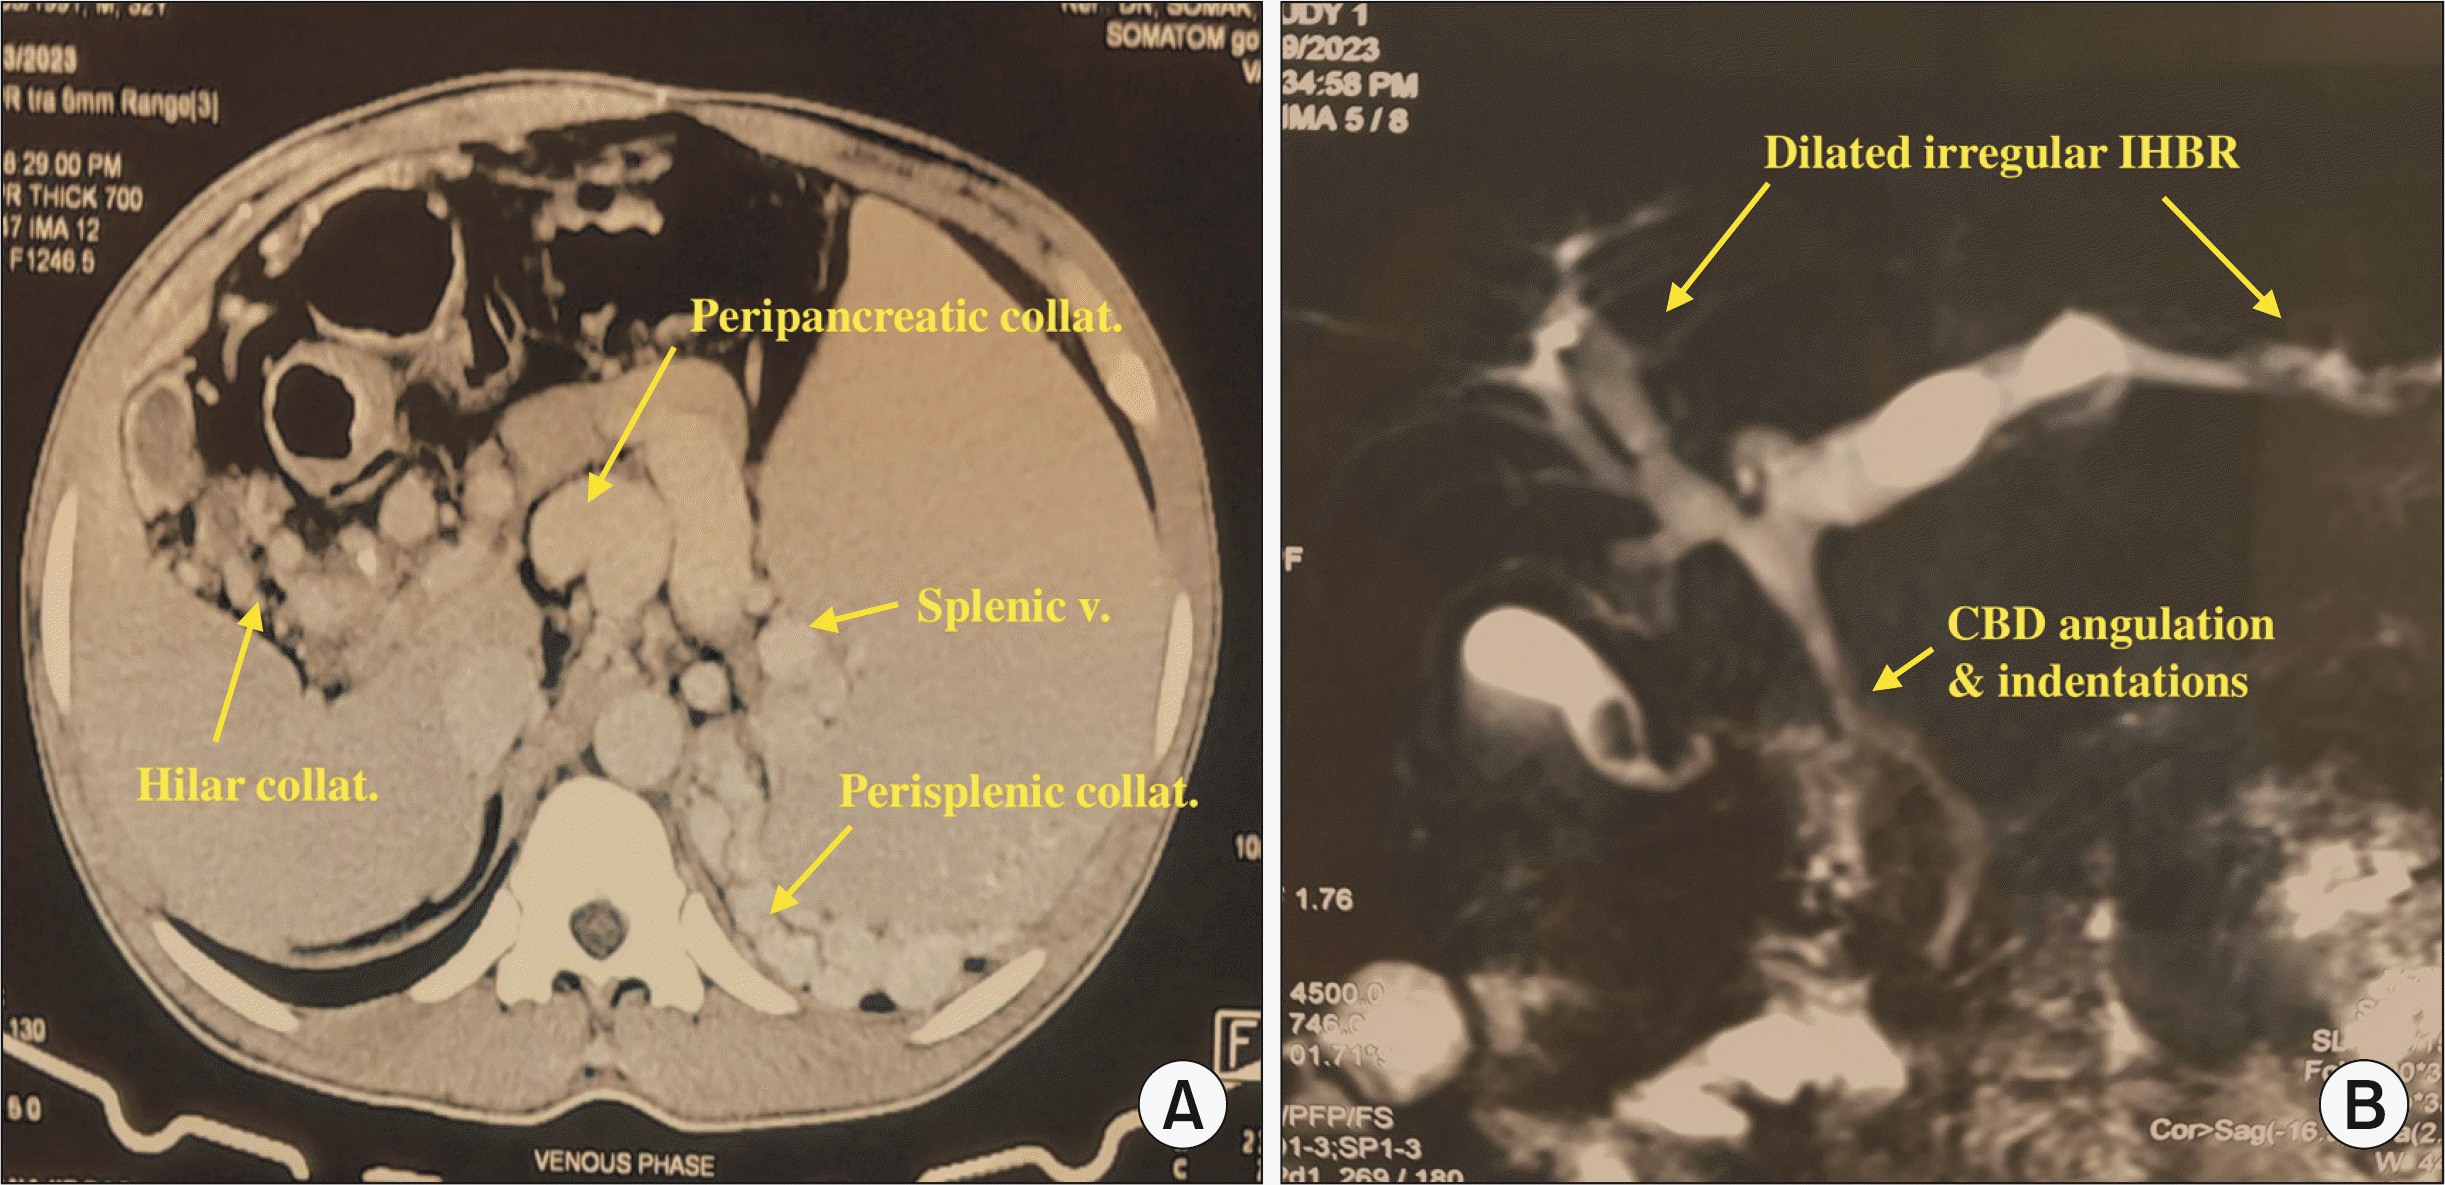
 | Fig. 3Imaging of EHPVO with PB. (A) CECT abdomen showing multiple hilar, peripancreatic, and perisplenic collaterals, and dilated splenic vein at splenic hilum. (B) MRCP showing irregular and dilated IHBR, angulation, and indentations of extrahepatic biliary tract due to compression by portal collaterals. EHPVO, extra hepatic portal venous obstruction; PB, portal biliopathy; CECT, contrast enhanced computed tomography; MRCP, magnetic resonance cholangiopancreatography; IHBR, intrahepatic biliary radicles; CBD, common bile duct. |
Surgery
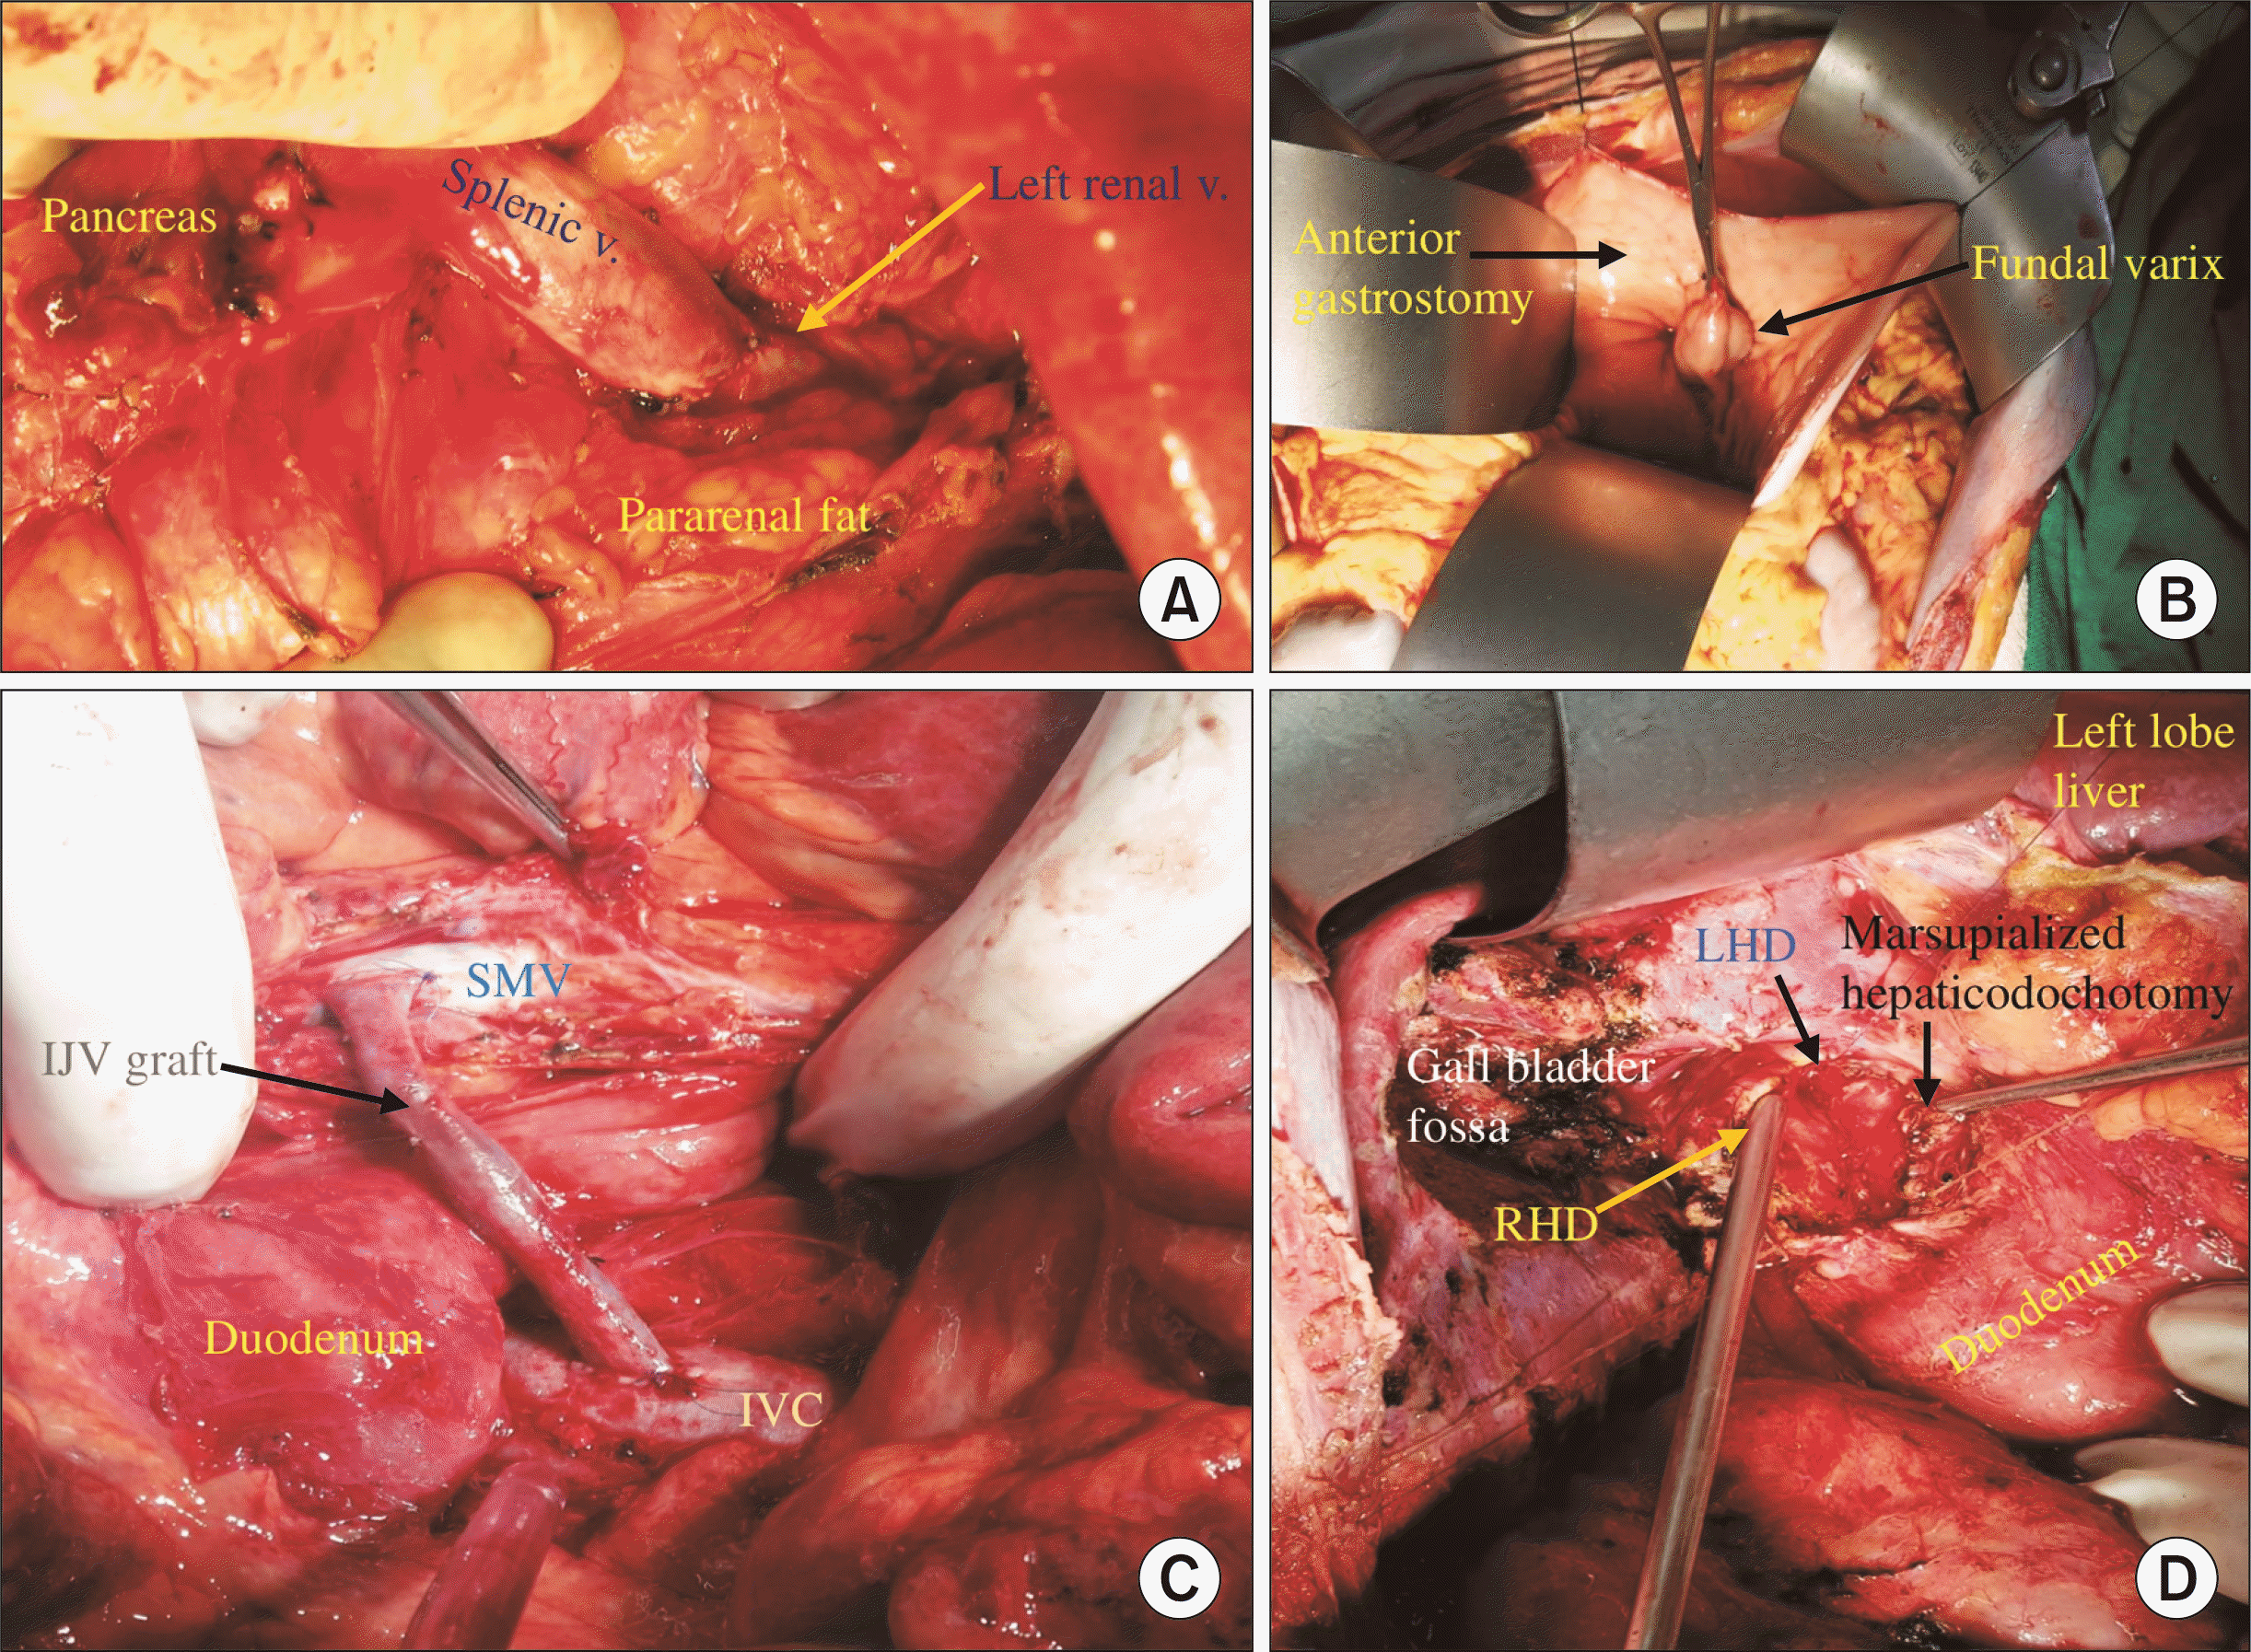
 | Fig. 4Operative figures. (A) A completed splenorenal shunt–end of splenic vein is anastomosed with side of left renal vein. (B) Isolated fundal gastric varix is grasped with tissue forceps through wide anterior gastrostomy for direct suture ligation before splenectomy & devascularization. (C) A completed mesocaval shunt–SMV and IVC are anastomosed with interposition right IJV graft. (D) Hepaticodochotomy for interval hepaticojejunostomy after splenorenal shunt–common hepatic duct is opened and extended superiorly and leftwards to expose LHD and right RHD. Hepaticodochotomy margin is marsupialised with 5-0 polypropelene suture to prevent anastomotic bleeding, and is now ready for hepaticojejunostomy. SMV, superior mesenteric vein; IVC, inferior vena cava; IJV, internal jugular venous; LHD, left hepatic duct; RHD, right hepatic duct. |
Data collections
Statistical analysis
RESULTS
Table 1
EHPVO, extra hepatic portal venous obstruction; PRBC, packed red blood cell; EST, endoscopic sclerotherapy; EVL, esophageal varix; ERC, endoscopic retrograde cholangiography; PTBD, percutaneous trans-hepatic biliary drainage; TLC, total leukocyte count; INR, international normalized ratio; AST, aspartate aminotransferase; ALT, alanine transaminase; USG, ultrasonography; CECT, contrast enhanced computed tomography; MRCP, magnetic resonance cholangiopancreatography.
Table 2
Table 3
Table 4
| Follow-up parameter | Value |
|---|---|
| Duration of follow-up (mon) | 56 (15–156) |
| Rebleeding | 6 (3.0) |
| Follow up endoscopy (n = 54) | |
| Normal | 42 (77.8) |
| Esophageal varices | 7 (13.0) |
| GOV | 2 (3.7) |
| IGV | 1 (1.9) |
| PHG | 1 (1.9) |
| Ulcer | 1 (1.9) |
| Shunt patency (n = 166) | 155 (93.4) |
| Subsequent surgery | |
| Not required | 185 (91.6) |
| Devascularization | 1 (0.5) |
| Mesocaval shunt | 1 (0.5) |
| Open cholecystectomy | 2 (1) |
| Laparoscopic cholecystectomy | 3 (1.5) |
| Hepaticojejunostomy | 6 (3.0) |
| Others | 1 (0.5) |
| Bleeding during subsequent surgery (mL) (n = 14) | 477.27 ± 278.71 |
| Blood transfusion in subsequent surgery (units of PRBC) (n = 10) | 1.50 ± 1.43 |
| Outcome (n = 194) | |
| Asymptomatic | 166 (85.6) |
| Non-bleeder varices requiring endotherapy | 8 (4.1) |
| Rebleeding requiring endotherapy | 4 (2.1) |
| Rebleeding requiring surgery | 1 (0.5) |
| Portal bilioparty requiring ERC | 10 (5.2) |
| Portal biliopathy requiring HJ | 5 (2.6) |
| Overall mortality | |
| Operative death, 90-day mortality = 1 (0.5)a) | 8 (4.0) |
Table 5
| Parameter | Univariate analysis | Multivariate analysis | ||||
|---|---|---|---|---|---|---|
| Favourable long-term outcome (n = 166) | Unfavourable long-term outcome (n = 28) | p-value | Exp (B) (OR) | p-value (95% CI) | ||
| Age (yr) | 19.32 ± 9.86 | 22.93 ± 9.01 | 0.71 | |||
| Sex | > 0.999 | |||||
| Male (n = 88) | 75 (85.2) | 13 (14.8) | ||||
| Female (n = 106) | 91 (85.8) | 15 (14.2) | ||||
| Age of onset (yr) | 12.33 ± 10.64 | 14.45 ± 10.46 | 0.33 | |||
| Index presentation | 0.57 | |||||
| Bleeding (n = 160) | 136 (85.0) | 24 (15.0) | ||||
| Portal biliopathy (n = 15) | 12 (80.0) | 3 (20.0) | ||||
| Biliary lithiasis (n = 5) | 4 (80.0) | 1 (20.0) | ||||
| Symptomatic splenomegaly (n = 9) | 9 (100) | 0 | ||||
| Symptomatic hypersplenism (n = 5) | 5 (100) | 0 | ||||
| Duration of illness (mon) | 84.94 ± 67.55 | 102.25 ± 89.86 | 0.235 | |||
| Bleeding episodes | 3.78 ± 6.16 | 5.32 ± 8.18 | 0.244 | |||
| No. of blood transfusions | 5.86 ± 9.54 | 8.29 ± 12.43 | 0.237 | |||
| No. of endoscopy | 9.32 ± 8.74 | 9.93 ± 10.38 | 0.74 | |||
| Conntrol of bleeding | 0.370 | |||||
| EST (n = 10) | 7 (70.0) | 3 (30.0) | ||||
| EVL (n = 89) | 76 (85.4) | 13 (14.6) | ||||
| Glue (n = 4) | 3 (75.0) | 1 (25.0) | ||||
| Combinations (n = 66) | 59 (89.4) | 7 (10.6) | ||||
| Compliance to endotreatment | 0.022* | 0.30 | 0.298 (0.03–2.86) | |||
| Good | 141 (87.6) | 20 (12.4) | ||||
| Poor | 11 (64.7) | 6 (35.3) | ||||
| Variceal obliteration | 0.827 | |||||
| Yes | 90 (86.5) | 14 (13.5) | ||||
| No | 61 (84.7) | 11 (15.3) | ||||
| Jaundice | 0.121 | |||||
| Yes | 46 (79.3) | 12 (20.7) | ||||
| No | 120 (88.2) | 16 (11.8) | ||||
| Cholangitis | 0.014* | 0.27 | 0.204 (0.04–2.03) | |||
| Yes | 17 (68.0) | 8 (32.0) | ||||
| No | 149 (88.2) | 20 (11.8) | ||||
| Gall stone | 0.043* | 0.42 | 0.260 (0.09–1.91) | |||
| Yes | 30 (75.0) | 10 (25.0) | ||||
| No | 136 (88.3) | 18 (11.7) | ||||
| Bile duct stone | 0.003* | 0.93 | 0.947 (0.10–8.23) | |||
| Yes | 9 (56.3) | 7 (43.8) | ||||
| No | 157 (88.2) | 21 (11.8) | ||||
| Secondary biliary cirrhosis | 0.375 | |||||
| Yes | 2 (66.7) | 1 (33.3) | ||||
| No | 164 (85.9) | 27 (14.1) | ||||
| Ascites | 0.476 | |||||
| Yes | 15 (93.8) | 1 (6.2) | ||||
| No | 151 (84.8) | 27 (15.2) | ||||
| Splenic artery aneurysm | 0.010* | 0.01 | 0.007* (0.00–0.31) | |||
| Yes | 1 (25.0) | 3 (75.0) | ||||
| No | 165 (86.8) | 25 (13.2) | ||||
| Liver atrophy | ||||||
| Yes | 3 (75.0) | 1 (25.0) | 0.495 | |||
| No | 163 (85.8) | 27 (14.2) | ||||
| Appearance of gastric varices | ||||||
| Yes | 51 (83.6) | 10 (16.4) | 0.661 | |||
| No | 115 (86.5) | 18 (13.5) | ||||
| Bleeder | ||||||
| Yes | 88 (84.6) | 16 (15.4) | 0.838 | |||
| No | 78 (86.7) | 12 (13.3) | ||||
| Hypersplenism | ||||||
| None | 113 (84.3) | 21 (15.7) | 0.374 | |||
| Asymptomatic | 32 (84.2) | 6 (15.8) | ||||
| Symptomatic | 21 (95.5) | 1 (4.5) | ||||
| Portal biliopathy | 0.004* | 0.86 | 0.885 (0.12–6.16) | |||
| Yes | 37 (72.5) | 14 (27.5) | ||||
| No | 129 (90.2) | 14 (9.8) | ||||
| Mode of surgery | > 0.999 | |||||
| Elective | 150 (85.2) | 26 (14.8) | ||||
| Emergency | 16 (88.9) | 2 (11.1) | ||||
| Esophageal varices at the time of surgery | 0.456 | |||||
| Grade 0 | 99 (85.3) | 17 (14.7) | ||||
| Grade 1 | 19 (95.0) | 1 (5.0) | ||||
| Grade 2 | 32 (80.0) | 8 (20.0) | ||||
| Grade 3 | 16 (88.9) | 2 (11.1) | ||||
| Gastroesophageal varices | 0.481 | |||||
| Present | 124 (95.4) | 6 (4.6) | ||||
| Absent | 42 (89.4) | 5 (10.6) | ||||
| Isolated gastric varices | 0.023* | 0.07 | 0.004* (0.01–0.43) | |||
| Present | 151 (87.8) | 21 (12.2) | ||||
| Absent | 15 (68.2) | 7 (31.8) | ||||
| Portal hypertensive gastropathy | 0.403 | |||||
| No | 133 (86.4) | 21 (13.6) | ||||
| Mild | 29 (85.3) | 5 (14.7) | ||||
| Severe | 4 (66.7) | 2 (33.3) | ||||
| Ectopic varices | 0.330 | |||||
| Present | 161 (86.1) | 26 (13.9) | ||||
| Absent | 5 (71.4) | 2 (28.6) | ||||
| Colopathy | 0.467 | |||||
| Present | 163 (85.8) | 27 (14.2) | ||||
| Absent | 3 (75.0) | 1 (25.0) | ||||
| ERC & stenting | 0.002* | 0.06 | 0.015* (0.01–0.59) | |||
| Yes | 155 (88.6) | 20 (11.4) | ||||
| No | 11 (57.9) | 8 (42.1) | ||||
| Hemoglobin (gm%) | 8.86 ± 2.54 | 9.07 ± 1.93 | 0.678 | |||
| TLC (×103/cumm) | 3.74 ± 3.17 | 4.56 ± 3.71 | 0.221 | |||
| Bilirubin (mg/dL) | 1.44 ± 1.19 | 2.39 ± 2.85 | 0.003* | 0.99 | 0.976 (0.66–1.49) | |
| INR | 1.35 ± 0.98 | 1.35 ± 0.61 | 0.990 | |||
| AST (U/L) | 49.50 ± 50.10 | 64.04 ± 55.09 | 0.163 | |||
| ALT (U/L) | 41.64 ± 52.37 | 47.39 ± 33.75 | 0.541 | |||
| Alkaline phosphatase (IU/L) | 207.84 ± 222.04 | 390.21 ± 883.81 | 0.023* | 1.00 | 0.279 (1.00–1.00) | |
| Type of surgery | 0.274 | |||||
| Shunt procedure | 140 (84.3) | 26 (15.7) | ||||
| Non-shunt procedure | 21 (75.0) | 7 (25.0) | ||||
| Splenic vein diameter (mm) | 9.11 ± 4.42 | 10.52 ± 4.32 | 0.135 | |||
| Shunt size (mm) | 11.83 ± 4.3 | 12.48 ± 4.3 | 0.520 | |||
| Duration of surgery (min) | 270.61 ± 75.6 | 295.21 ± 93.53 | 0.126 | |||
| Operative blood loss (mL) | 332.35 ± 251.08 | 485.71 ± 427.28 | 0.009* | 1.00 | 0.435 (1.00–1.00) | |
| PRBC (unit) | 0.72 ± 1.29 | 0.75 ± 1.38 | 0.901 | |||
| Postoperative stay (day) | 7.16 ± 3.42 | 7.75 ± 5.75 | 0.449 | |||
| Shunt patency | < 0.001* | 0.03 | < 0.001* (0.00–0.19) | |||
| Present | 135 (90.0) | 15 (10.0) | ||||
| Absent | 3 (33.3) | 6 (66.7) | ||||
Binary logistic regression in Wald methodology was used to know the predictive factors responsible for unfavourable outcome.
OR, odds ratio; CI, confidence interval; EST, endoscopic sclerotherapy; EVL, endoscopic variceal ligation; ERC, endoscopic retrograde cholangiography; TLC, total leukocyte count; INR, International normalized ratio; AST, aspartate aminotransferase; ALT, alanine transaminase; PRBC, packed red blood cell.
DISCUSSION
Pathophysiology
Epidemiology & features
Endoscopy
Imaging
Surgery
Long-term outcome
Table 6
| Author | Year | Type of PSS | No. of Patients | Operative mortality (%) | Shunt patency (%) | Re-bleeding (%) | Follow-up period | Survival |
|---|---|---|---|---|---|---|---|---|
| Bismuth et al. [36] | 1980 | Central splenorenal, mesocaval, portocaval | 52 | 0 | 94 | 2 | 50 mon | 100% |
| Warren et al. [61] | 1988 | Distal splenorenal shunt | 25 | Nil | 96 | 12 | 5 yr | 96% |
| Mitra et al. [32] | 1993 | SSLR | 81 | Nil | 84 | 11 | 54 mon | 100% |
| Prasad et al. [30] | 1994 | PSRS | 160 | 1.9 | NA | 11 | 12–156 mon | 95% at 15 yr |
| Orloff et al. [31] | 1994 | PSRS, SSLR, mesocaval | 162 | Nil | 98 | 2 | 5–35 yr | 96% at 10 yr |
| Rao et al. [33] | 2004 | SSLR, PSRS | 20 | NA | 95 | Nil | 3–5 yr | 95% |
| Superina et al. [60] | 2006 | Rex shunt | 34 | NA | 95 | NA | 1–7 yr | 100% |
| Sharif et al. [62] | 2010 | Rex shunt | 24 | Nil | 96 | 2 | 5.3–8.8 yr | NA |
| Das et al. (current study) | 2023 | PSRS, mesocaval | 166 | 0.6 | 93.4 | 0.6 | 1–13 yr | 96% |


 PDF
PDF Citation
 Print
Print


 XML Download