

 PDF
PDF Citation
 Print
Print


In Korea, a large number of migrant workers now occupy the section of the labor market that is typically avoided by citizens. This accounts for a substantial portion of the so-called “3D” industry, referring to jobs that are difficult, dirty, and dangerous. These workers are allowed to remain in Korea through either the non-professional employment visa (E-9) or visiting employment visa (H-2).1 In 2021, official reports showed that 217,729 and 125,493 individuals, respectively, were living in South Korea under these provisions, accounting for 17.5% of all foreign residents nationwide.12 In general, migrant workers are physically and mentally vulnerable due to the difficult nature of their working conditions.34 This imposes a risk of disease that not only results in poor labor services, but also makes it difficult to maintain livelihood, and can even threaten the right to health. According to the 1946 World Health Organization Charter, the right to health is defined as “everyone’s basic right to enjoy the highest achievable level of health, regardless of race, religion, political beliefs, economic or social conditions.” However, the reality in South Korea is that migrant workers currently face a higher threshold than that of citizens. This is both due to financial and linguistic barriers when using medical services and restrictions on access to relevant information.5 In this regard, the decision to seek or forego health insurance is a representative indicator of health rights guarantees. For context, the annual health insurance subscription rate among registered foreigners increased from 55.3% in 2018 to 76.8% in 2021, as the local voluntary subscription shifted to a mandatory provision in 2019, but this rate is still at 70%.6 Over this period, migrant workers have been placed in a medical insurance “blind spot,” wherein service use is restricted due to the requirement of being a resident of South Korea for at least 6 months before achieving local subscriber status. Under these conditions, their health is often threatened. In fact, the annually increasing health risks incurred by migrant workers is quickly becoming a social problem.7 Many studies in the humanities fields have identified important conditions and problems related to the health rights guarantee among domestic migrant workers.58910 While their findings provide various suggestions for improvement, few studies have medically analyzed the actual health status of migrant workers to objectively improve these issues.111213 To address this gap, the current study evaluated the health status of migrant workers living in Cheonan, with a focus on identifying specific vulnerabilities. From this perspective, we hope to ensure that migrant workers are afforded the right to health while living in the aforementioned medical service “blind spot.”
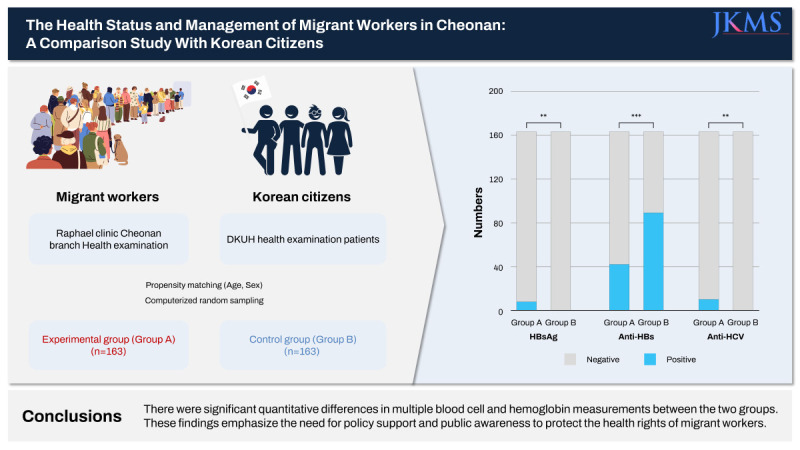
To enable comparisons, we investigated health examination records from 2 groups, including migrant workers (Group A) and Korean citizens (Group B). On December 19, 2021, and June 19, 2022, 86 and 81 migrant workers, respectively, underwent medical examination at the Cheonan Branch of the Raphael Clinic (Fig. 1). After excluding 4 individuals who received medical examinations on both dates, Group A consisted of data from 163 migrant workers (113 males and 50 females). We then considered data from Korean citizens compiled by the health examination center at Dankook University Hospital (DKUH) from August 2021 to July 2022. Of 14,350 patients who visited DKUH, we used propensity matching to ensure that Group B (the control) consisted of data from 163 Korean citizens (113 males and 50 females) (Table 1). Groups A and B underwent urine analyses, chest radiographs, and blood tests, including complete blood count (CBC) examination, serum analysis, a hepatitis viral marker test (involving hepatitis B virus (HBV) surface antigen [HBsAg], anti-hepatitis B surface (HBs), and anti-hepatitis C virus [HCV]), and thyroid function test (TFT). Group B was also eligible for other provisions if desired, including a survey of past medical history and lifestyle, chest computed tomography, and thyroid or breast ultrasonography. All subjects fasted midnight onward on the day of the examination. In this study, we only compared intergroup data from the blood tests, urinalyses, and chest radiographs. We quantitatively and qualitatively analyzed the blood test results based on the normal range suggested by the Clinical and Laboratory Standards Institute (CLSI) EP28-A3c criteria (Table 2), qualitatively assessed the urine using the dipstick test (range, normal to 6+), and classified the chest radiographs as normal or abnormal (need further sputum smear test). We performed all statistical analyses using IBM SPSS ver. 21.0 (IBM Corporation, Armonk, NY, USA). In this context, we compared all results via independent t-test and χ2 test. Specifically, we used the independent t-test to compare mean values of the CBC, serum analyses, urine analyses, and TFT findings. For the hepatitis viral marker tests, we used the χ2 test to identify correlations between viral hepatitis morbidity and antibody status in Groups A and B.
 | Fig. 1Photographs of the Raphael Clinic Cheonan Branch on the day of the medical health examination.
|
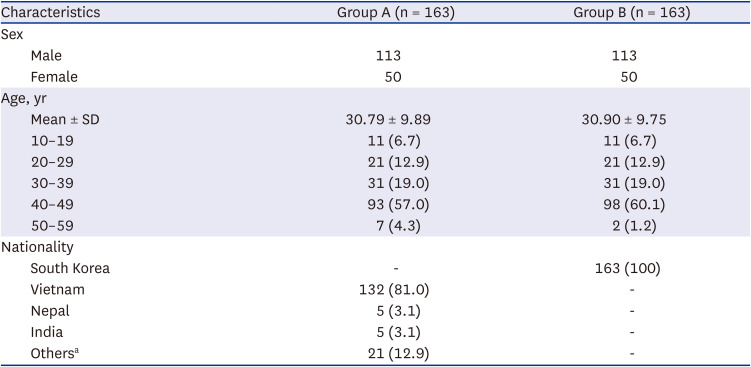
Table 1
Overall patients’ characteristics
SD = standard deviation.
aThere were 3 Philippines, 3 Bangladesh, 2 Egypt, 2 Laos, 2 Myanmar, 1 Kazakhstan, 1 Mongolia, 1 Rwanda, 1 East Timor, 1 Malaysia, 1 Uganda, 1 Russia, 1 Kenya, 1 nondisclosure in others.
![]()
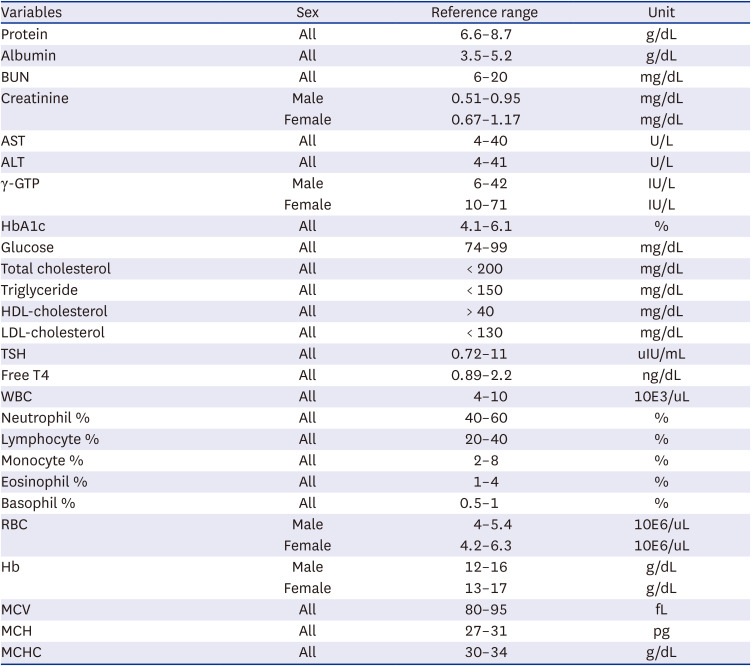
Table 2
Reference range for blood test variables according to the Clinical and Laboratory Standards Institute (CLSI) EP28-A3c criteria
BUN = blood urea nitrogen, AST = aspartate aminotransferase, ALT = alanine aminotransferase, γ-GTP = gamma-glutamyl transpeptidase, HbA1c = hemoglobin A1c, HDL = high-density lipoprotein, LDL = low-density lipoprotein, TSH = thyroid stimulating hormone, WBC = white blood cell, RBC = red blood cell, Hb = hemoglobin, MCV = mean corpuscular volume, MCH = mean corpuscular hemoglobin, MCHC = mean corpuscular hemoglobin concentration.
![]()
The mean ages (years) were very similar between groups at 30.79 ± 9.89 (Group A) and 30.90 ± 9.75 (Group B) years. Group A comprised 113 men (69.33%) and 50 women (30.67%); as for origins, 133 were from Vietnam, 5 from Nepal, 5 from India, and 21 from 13 other countries. All patients in Group B were from Korea, with no naturalized foreigners (Table 1). Group A showed a significantly higher rate of HBsAg-positive patients (Group A at 4.91% vs. Group B at 0%, P = 0.007). We also found statistically significant intergroup differences in the rates of anti-HBs patients (Group A at 68.46% vs. Group B at 25.77%, P < 0.001) and anti-HCV patients (Group A at 6.13% vs. Group B at 0%, P = 0.002) (Fig. 2). To establish statistical significance, we compared Groups A and B using the independent t-test and χ2 test. Table 3 shows the blood test findings. We found statistically significant quantitative differences in albumin, blood urea nitrogen (BUN), creatinine, alanine aminotransferase (ALT), total cholesterol (TC), low-density lipoproteins (LDLs), and thyroid-stimulating hormone (TSH). The specific results were as follows: the albumin level was higher in Group B (Group A at 4.53 ± 0.23 vs. Group B at 4.87 ± 0.28, P < 0.001), BUN level was higher in Group A (Group A at 15.23 ± 4.16 vs. Group B at 12.05 ± 2.72, P < 0.001), creatinine level was higher in Group B (Group A at 0.80 ± 0.16 vs. Group B at 0.84 ± 0.16, P = 0.021), ALT level was higher in Group B (Group A at 24.43 ± 21.16 vs. Group B at 31.39 ± 36.41, P = 0.036), TC level was higher in Group B (Group A at 179.63 ± 35.26 vs. Group B at 189.83 ± 34.87, P = 0.009), LDL level was higher in Group B (Group A at 104.10 ± 29.45 vs. Group B at 114.39 ± 32.29, P = 0.003), and TSH level was higher in Group B (Group A at 1.72 ± 2.26 vs. Group B at 2.46 ± 1.66, P = 0.001). Next, we found statistically significant qualitative differences in the albumin, BUN, gamma glutamyl transpeptidase, glucose, TC, and TSH levels, with the levels of all except BUN being higher in Group B (Table 3). Regarding the CBC, we found statistically significant quantitative differences in the white blood cell (WBC), neutrophil, lymphocyte, monocyte, basophil, and red blood cell (RBC) counts; hemoglobin levels; hematocrit levels; mean corpuscular hemoglobin (MCH); and mean corpuscular hemoglobin concentration (MCHC) (Table 4). Specifically, the levels of all the following parameters were higher in Group A: WBC count (Group A at 7.28 ± 1.73 vs. Group B at 5.93 ± 1.55, P < 0.001), neutrophil count (Group A, 56.17 ± 8.66 vs. Group B, 54.03 ± 8.14, P = 0.022), monocyte count (Group A, 7.59 ± 1.83 vs. Group B, 7.14 ± 1.77, P = 0.023), basophil count (Group A, 0.66 ± 0.31 vs. Group B, 0.46 ± 0.25, P < 0.001), RBC count (Group A, 5.21 ± 0.48 vs. Group B, 4.96 ± 0.44, P < 0.001), and hematocrit level (Group A, 45.77 ± 3.94 vs. Group B, 44.13 ± 3.56, P < 0.001). By contrast, Group B showed a higher lymphocyte count (Group A, 32.67 ± 7.80 vs. Group B, 35.92 ± 7.96, P < 0.001) and hemoglobin level (Group A, 14.74 ± 1.48 vs. Group B, 15.08 ± 1.46, P = 0.035). Finally, we found intergroup qualitative differences in the WBC, eosinophil, basophil, and RBC counts; hematocrit level; mean corpuscular volume; MCH; and MCHC qualitatively. We found statistically significant intergroup differences in urine protein levels and leukocyte rate, wherein both were higher in Group B (Table 5). Further research is needed to determine the cause of proteinuria. In Group A, 114 patients had normal chest radiograph findings, while 5 showed abnormality. In Group B, 160 patients had normal chest radiograph findings, while 3 had abnormal results (Table 6). All abnormal findings noted were due to old cases of tuberculosis. We performed multivariate logistic regression analysis with hepatitis B and C antigen/antibody as dependent variables due to the significant prevalence difference in the two groups. While Group A showed no significance in positive HBsAg and anti-HCV in analysis, low albumin levels were related to HCV prevalence. And older age showed statistically significant relation to positive HBsAg (Table 7). Despite not finding statistical significance in the regression analysis, it would be premature to conclude that there is no correlation between hepatitis B or C and the groups. Notably, Group B did not have any positive HBsAg and anti-HCV cases, resulting in a P value exceeding 20 million in the Exp(B) indicator. The study suggests that obtaining more data to ascertain the prevalence of Hepatitis in both groups is necessary for drawing meaningful conclusions.
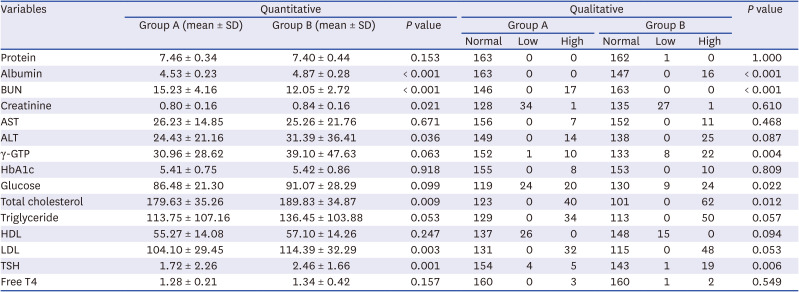
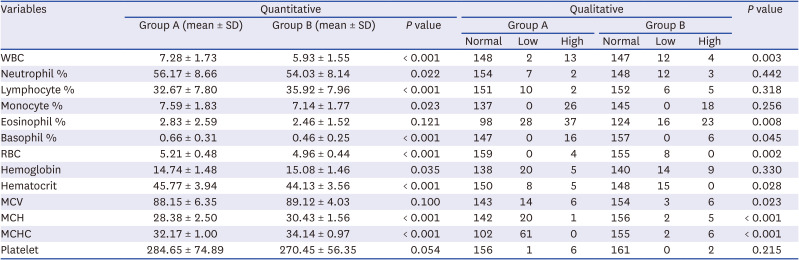
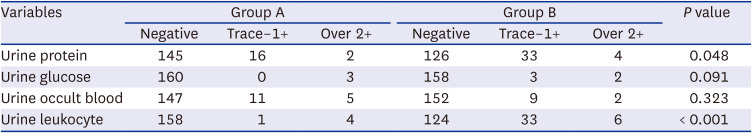

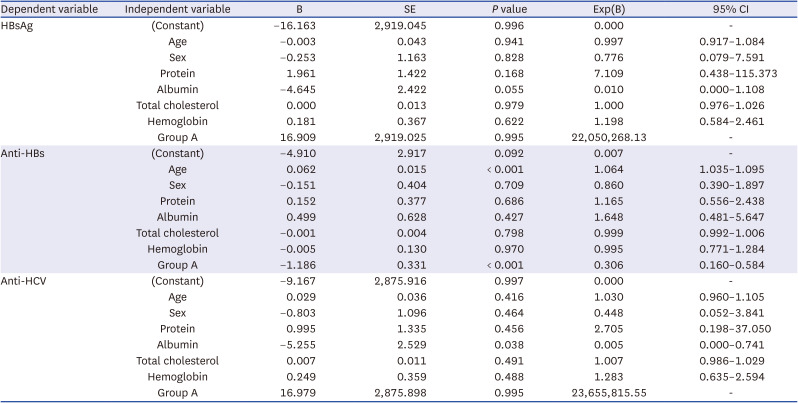
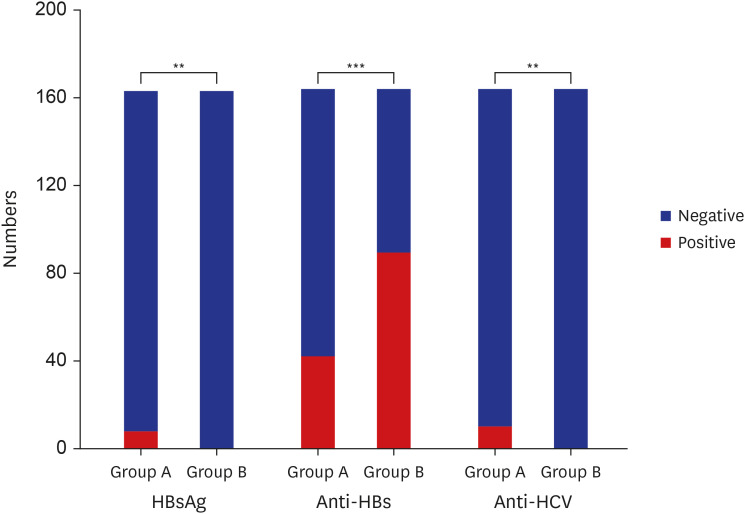
Table 3
Comparison of blood chemistry test between two groups
Group A, Migrant workers; Group B, South Koreans.
SD = standard deviation, BUN = blood urea nitrogen, AST = aspartate aminotransferase, ALT = alanine aminotransferase, γ-GTP = gamma-glutamyl transpeptidase, HbA1c = hemoglobin A1c, HDL = high density lipoprotein, LDL = low density lipoprotein, TSH = thyroid stimulating hormone.
![]()
Table 4
Comparison of complete blood count between two groups
Group A, Migrant workers; Group B, South Koreans.
SD = standard deviation, WBC = white blood cell, RBC = red blood cell, MCV = mean corpuscular volume, MCH = mean corpuscular hemoglobin, MCHC = mean corpuscular hemoglobin concentration.
![]()
Table 5
Qualitative analysis of urine tests between the two groups
![]()
Table 6
Analysis of the chest radiograph findings between the two groups
| Variables | Group A | Group B | P value | ||
|---|---|---|---|---|---|
| Normal | Abnormal | Normal | Abnormal | ||
| Chest X-ray | 114 | 5 | 160 | 3 | 0.288 |
![]()
Table 7
Multivariate logistic regression analysis for hepatitis B or C
HBsAg = hepatitis B virus surface antigen, HBs = hepatitis B surface, HCV = hepatitis C virus, SE = standard error, CI = confidence interval.
![]()
Considering the hepatitis antibody results, Group A comprised 8 HBsAg-positive patients (4.91%), indicating that they were carriers of HBV. Group B contained a higher number of patients who tested positive for anti-HBs (infection protective antibodies for HBV) (89 [68.46%] in Group B vs. 42 [25.77%] in Group A). As many HBV carriers existed in Group A, the migrant workers appeared to have a lower vaccination rate than that of native Koreans. This can most likely be attributed to the Korean vaccination policy, which may be more robust than policies in the countries from which the migrant workers originated.14 In the case of Korea, nationwide vaccinations were conducted from 1984 to 1985. Since then, infants and toddlers have been receiving vaccinations at 0, 1, and 6 months of age. By comparison, the policy in Vietnam (accounting for 133 patients [81.60%] in Group A) has only stipulated nationwide vaccinations since 2003,15 which likely did not benefit a large number of migrant workers in Group A, given their average age of 30.79 years. In other cases, Nepal and India have implemented infant vaccination policies since the 2000s, so their results should be very similar.161718 Regarding the anti-HCV antibody, positive results can indicate a symptomatic infection, which requires additional measures such as HCV RNA testing. Group A contained a higher number of patients with anti-HCV antibodies (10 [6.13%] in Group A vs. 0 [0%] in Group B). In the case of hepatitis C, 80% of individuals develop chronic disease, while 20 to 30% develop chronic cirrhosis. If the condition progresses to cirrhosis, the risk of liver cancer also increases.192021 Our findings suggest that migrant workers need confirmation tests for hepatitis C, with additional treatment if confirmed. As for nutrition levels, the albumin level was lower in Group A. Of note, albumin levels are associated with all-cause mortality in all age groups.22 Migrant workers are often malnourished because they have difficulty adapting to Korean food culture, which may differ significantly from their traditional eating habits. Moreover, a previous study reported that albumin levels may vary depending on income level.23 In cases of low-income, this is likely due to health-related factors that affect nutrition and low household earnings. In 2020, Koreans showed an average earned income of 36.92 million won, while foreign workers showed an average of 29.26 million won.2425 As it pertains to this study, Group A was expectedly characterized by lower income because it did not include workers from the United States and China, which incur the first and second largest reported tax amounts, respectively. In turn, intergroup nutrition differences were likely due to variations in both the eating culture and income level.
Considering the WBC counts, Group A showed an abnormally high number (13 patients in Group A vs. 4 patients in Group B, P < 0.001). In general, leukocytosis is manifested due to infection, physical stress, emotional stress, and medication (e.g., corticosteroid, lithium, beta agonist).26 In the case of migrant workers, this may be related to relatively higher engagement in the 3D industry, severe physical labor, and easy exposure to infection.2728 In sum, the health of migrant workers is more problematic in several areas when compared to that of Koreans. Given the threats posed to their health rights, it is critical to address these issues. Although the right to health is not directly specified in the Constitution of the Republic of Korea, it can still be interpreted that this issue is covered under the right to live a human life in Article 34. Under this framework, migrant workers employed in the Republic of Korea are provided basic rights and can thereby claim the right to health. Here, it should be noted that the Raphael Clinic was established in 1997 and currently operates a free clinic in Seoul every week to guarantee the health rights of migrant workers falling under medical “blind spots.” The Cheonan Branch of the Raphael Clinic opened in 2019 and currently features internal medicine, general surgery, and a dental clinic. Even during the coronavirus disease 2019 (COVID-19) pandemic in 2021, 1,460 migrant workers reportedly visited free clinics; thus, workers from various nations, including Vietnam, India, the Philippines, and Mongolia, received non-face-to-face or face-to-face treatment. Many migrant workers have also been treated for chronic disease and other conditions, including rheumatoid heart disease, insulin-independent diabetes, dental caries, and gastroesophageal reflux disease. These individuals should be afforded continuous medical care in the future. In this context, it is also important to reiterate our finding that migrant workers were particularly vulnerable to hepatitis. To protect the health rights of these individuals, the following 3 policy improvements are needed. First, vaccination and management for hepatitis should be provided at the national level. It is necessary to perform health checkups for migrant workers to determine whether they have vaccine-related antibodies and support necessary vaccinations based on the results. In addition, treatment and support are needed for migrants infected with hepatitis. Each country also has different vaccination rates and requirements, including variations for those that are essential for children. This highlights the need to educate the overseas populations by providing them with vaccination recommendations, such as in the West.29 Second, in the case of foreigners residing in Korea, health insurance benefits are restricted immediately upon failure to pay premiums. For native Koreans, such benefits are merely limited upon failure to pay premiums for more than 6 months, showing that excessive restrictions are imposed on foreigners. In 2020, approximately 12.0% had experienced arrears. From the humanitarian perspective, it is better to propose a remedy for unpaid premiums rather than restricting insurance benefits.30 Third, undocumented immigrants are not subject to insurance coverage, so other solutions are needed to protect their health rights. In August 2000, the Ministry of Health and Welfare prepared health management guidelines for such individuals. Although these were delivered to public health centers across the nation, they have not actually been implemented. In addition, many illegal immigrants are afraid to enter public institutions (including health centers) due to their unstable residency status. It is also often difficult for them to make weekday visits due to long working hours. Therefore, policy support is needed to help migrant workers with unstable residency status visit health centers without anxiety. This will promote the use of health care guidelines established for illegal residents. This study also had some limitations. First, our analysis of Group A was limited due to fewer examination items (e.g., the lack of lifestyle surveys). This prevented us from offering specific health solutions in certain contexts. Second, we did not have certain data on body composition (e.g., height and weight) and therefore populated the control group solely based on age and sex. Third, 81.6% of patients in Group A were from Vietnam, and more than 80% of all study subjects were under 30 years of age. This limited our potential to conduct multi-ethnic and multi-age analyses. Finally, the study’s scope was limited to the Cheonan area. Moreover, there was no specific institution in South Korea dedicated to examining the health status of migrant workers in “blind spots,” and the Raphael Clinic Cheonan Branch conducted only two medical checkups over a period of four years. To minimize regional disparities and enhance the study’s comparability, a control group of Korean individuals from the Cheonan area was established. Meanwhile, if further research will be conducted to explore these aspects using more representative data, such as data from the Korean National Health and Nutrition Examination Survey, this larger and more comprehensive dataset would provide valuable insights for future studies in this area.
In conclusion, the ratio of foreign residents to the total Korean population increased from 4.21% in 2017 to 4.87% in 2019. Although this subsequently decreased to 3.79% in 2021 in the aftermath of the COVID-19 pandemic,31 many such individuals are still present. There are also situations where, often, health rights are not guaranteed in Korea; this particularly includes problems associated with liver health. Given these conditions, it is important to provide continued policy support and increase public interest in protecting the health rights of vulnerable populations.
Ethics statement
The present study protocol was reviewed and approved by the Institutional Review Board (IRB) of Dankook University Hospital (IRB No. DKUH 2023-01-008). Owing to the nature of retrospective study, consent was not required from all participants because the study implied less than the minimum risk.
Go to : 
 XML Download