

 PDF
PDF Citation
 Print
Print


INTRODUCTION
Cardiovascular disease (CVD) is the most prevalent cause of fatalities worldwide and is a global medical concern. According to a recent study by Benjamin et al.1, just in the United States, in 2017, there were 69,255 more resident deaths (2,813,503) than there were in 2016. Additionally, 17.8 million deaths worldwide (an increase of 21.1% from 2007) were due to CVD in 2017. Moreover, the global burden of CVD is predicted to rise significantly over the next few decades, driven by aging populations and unhealthy lifestyle habits.2 While behavioral and environmental factors are known to contribute to CVD development, genetic factors also play a substantial role.345 As the science develops in high-throughput genotyping technologies,67 particularly genome-wide association studies (GWAS),8910 have identified numerous genetic loci that are robustly associated with various CVD subtypes,1112 including coronary artery disease (CAD),131415 coronary heart disease,161718 heart failure,19 and atrial fibrillation.20 These discoveries present opportunities for precision medicine and personalized interventions, but pose significant computational and analytical challenges. This is due to the vast amounts of genomic and clinical data generated by these studies, which necessitate the application of advanced machine learning (ML) and artificial intelligence (AI) algorithms for accurate and efficient analysis.21222324
AI comprises a group of methods that draw on concepts like ML and deep learning (DL)252627282930313233343536 which can be applied to integrate and decipher complicated and vast amounts of genetic and medical data in circumstances where conventional statistical methods may be inadequate.373839 It has revolutionized the healthcare field, including CVD risk prediction, especially with the incorporation of polygenic risk scores (PRS) derived from genomics data.4041
In the field of CVD, the adoption of AI-based PRS (aiPRS) models can dramatically improve our comprehension of CVD pathophysiology and provide more efficient prevention and therapy methods.42 The aiPRS (originally coined by AtheroPoint™, Roseville, CA, USA) basically refers to the use of AI in the context of PRS models for CVD risk prediction. It combines the complete PRS approach to measuring CVD risk with the power of AI technologies, such as ML or DL techniques. It can analyze enormous volumes of data, spot trends, and offer more accurate risk evaluations by incorporating AI techniques. As a result, “aiPRS” does in this case refer to a classification algorithm based on DL4344 or ML374045 techniques that are especially employed in the field of CVD risk prediction. While AI can analyze vast amounts of data and identify patterns that may otherwise go unnoticed, PRS provide a more comprehensive and personalized approach to risk assessment by considering the complex interplay between various genetic and environmental factors.46 Incorporating AI in PRS has improved patient outcomes by enabling more precise and accurate risk assessment. AI-based algorithms can also stratify patients based on their risk profiles and forecast and uncover novel biomarkers of CVD, enabling the development of customized therapy regimes.4748
The promise of aiPRS for CVD research has recently been shown by studies. Fig. 1 shows the CVD PRS system and treatment planning using the aiP3 model. A test patient’s personal information, lifestyle biomarkers, omics-based biomarkers, laboratory-based biomarkers, and radiomics-based biomarkers are all collected first. The PRS system, an offline model that creates risk predictions based on the gathered data, is then trained using this data. Real-time risk prediction and customized treatment planning are made possible using this offline trained system. This is via the integration of the PRS system into an online prediction system. The aiP3 model is then used to create a precise, individualized, and preventative treatment plan that considers the individual’s unique CVD risks. To optimise CVD preventive and management techniques, this holistic process integrates data-driven risk assessment, online prediction capabilities, and personalised interventions. As an illustration, a study published in Circulation demonstrated that a genetic risk score based on 6.6 million variations could identify those at higher risk of getting CVD, even without conventional risk indicators like high blood pressure and cholesterol levels.49 Another study published in Medical Oncology emphasizes the crucial roles that ML algorithms play in precision and genomic medicine, highlighting their importance in enhancing individualized healthcare. These algorithms help the healthcare professionals to improve patient care, customize medicines to each patient’s needs, and use prediction models to promote precision medicine by harnessing the power of AI and integrating it with genomics.50 New opportunities for early disease identification, individualized treatment, and disease prevention have been made possible by developing PRS.51 Additionally, applying AI algorithms to PRS analysis has shown to be a viable method for locating previously unknown risk factors and enhancing prediction precision.38 Better patient outcomes and more successful interventions may follow as a result.
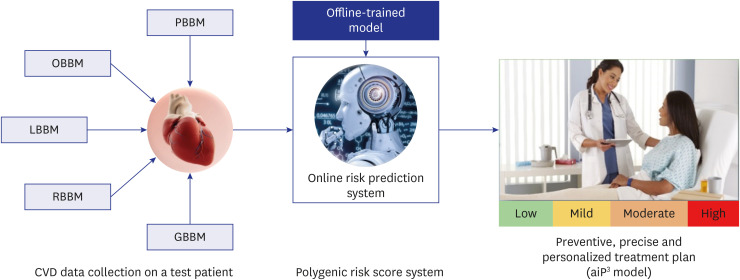 | Fig. 1CVD PRS system and treatment planning using aiP3 model.OBBM = office-based biomarker, LBBM = laboratory-based biomarker, RBBM = radiomics-based biomarker, GBBM = genomics-based biomarker, PBBM = proteomics-based biomarker, PRS = Polygenic Risk Score, aiP3 = AI for preventive, precise, and personalized system, CVD = cardiovascular disease.
|
Despite these encouraging advantages, implementing aiPRS models in clinical practice poses many difficulties. These difficulties include addressing data privacy and ethical issues, ensuring the model’s interpretability and transparency, and assessing the model’s effectiveness across a range of patient populations and clinical settings.52 However, it is impossible to overlook the potential of aiPRS models to revolutionize preventive measures by enabling early detection of high-risk individuals and focused interventions to lower the burden of CVD globally. Given the rising prevalence of CVD globally, AI offers a potent method to meet the urgent demand for appropriate risk assessment and management strategies.
In this comprehensive study, we further discuss the utility of PRS obtained from genetic data as an effective tool for predicting CVD.53 We offer a critical evaluation of recent developments in aiPRS for CVD, a ground-breaking framework that combines the strengths of genetic data and AI to improve the precision and accuracy of CVD risk prediction.54 We dig into the severe obstacles and bright prospects that the creation of aiPRS presents for CVD. The most promising fields for an upcoming study and clinical application were also determined. We hope to encourage new methodologies for CVD risk prediction and allow more efficient preventive interventions by illuminating the strength and promise of aiPRS-CVD.
Go to : 
SEARCH STRATEGY AND STATISTICAL DISTRIBUTIONS
The PRISMA model
Fig. 2 shows the Preferred Reporting Items for Systematic Reviews and Meta-Analyses (PRISMA) search technique. The keywords used for the search are “Polygenic Risk Score and cardiovascular disease,” “Polygenic Risk Score and AI,” “Polygenic Risk Score and genomics,” “Cardiovascular diseases and AI,” “CVD, PRS and AI,” “Polygenic Risk Score and Deep Learning,” “Genomics and AI,” “Cardiovascular Diseases and PubMed and Google Scholar screened pertinent papers.” Among other electronic databases, PubMed, Google Scholar, and Science Direct were searched extensively. The following inclusion standards were chosen: papers written in English; (a) initial research publications or reviews that examined the application of AI in bioinformatics frameworks for forecasting CVD risk. Letters to the editor, conference proceedings, and publications irrelevant to the research subject were not considered. Out of the total of 740 studies identified, 112 were found to be duplicates. After removing the duplicates, the number of unique studies left was 628. Further screening was conducted, resulting in the exclusion of 358 studies that were unrelated to the research topic. Additionally, 56 studies were deemed irrelevant, and 18 studies lacked sufficient data. As a result, a total of 194 studies met the inclusion criteria and were selected for analysis. Following this search strategy, we aimed to discover the AI and genomics-based approaches to investigate the relationship between PRS and CVD.

Statistical distribution
Fig. 3 represents the statistical distribution of the various studies employed in the present article. Fig. 3A shows the comparison of PRS studies versus study type in the four different categories: 1) PRS with AI but without CVD: 25 studies involved using AI in conjunction with PRS but did not focus on CVD as the outcome. 2) PRS without AI but with CVD: 20 studies did not involve the use of AI but focused on CVD as the outcome using PRS. 3) PRS with both CVD and AI: 13 studies involved both PRS and CVD as the outcome and utilized AI techniques. 4) for PRS without CVD and without AI: 12 studies did not involve PRS or AI and did not focus on CVD as the outcome. Fig. 3B shows the number of studies that utilized PRS as a variable across five years, from 2018 to 2022. The number of studies increased from 5 in 2018 to 16 in 2022, with the most significant increase occurring between 2018 and 2019. The trend suggests a growing interest in PRS research over time.
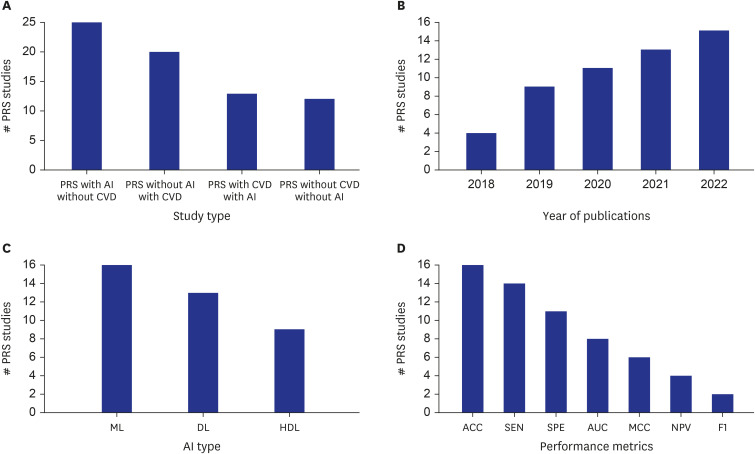 | Fig. 3Statistical distribution of various studies involved in PRS.PRS = Polygenic Risk Score, AI = artificial intelligence, CVD = cardiovascular diseases, ML = machine learning, DL = deep learning, HDL = hybrid deep learning, ACC = accuracy, SEN = sensitivity, AUC = area under curve, MCC = Mathews orrelation coefficient, SPE = specificity, NPV = net present value.
|
Fig. 3C represents the number of RA studies utilizing different AI techniques, including ML, DL, and hybrid deep learning (HDL). ML was used in 16 PRS studies, DL was used in 13 PRS studies, and HDL was used in 9 PRS studies. In our context, HDL refers to an approach that combines two different DL methods. Example of HDL are by combining two DL models.555657585960616263 This may be serial two DL connections or parallel connection of two DL models. In the literature of AI, HDL has also been called as the fusion of ML and DL models.18 These results suggest that AI is increasingly utilized in PRS research, with ML being the most used technique. Fig. 3D shows the performance metrics used in studies, and the number of studies that utilized each metric. The performance metrics listed are Accuracy (ACC), Sensitivity (SEN), Specificity (SPE), Area-Under-the-Curve (AUC), Matthews Correlation Coefficient (MCC), Negative Predictive Value (NPV), and F1-Score (F1). The number of studies that reported these metrics are as follows: ACC (16 studies), SEN (14 studies), SPE (11 studies), AUC (8 studies), MCC (6 studies), NPV (4 studies), and F1 (2 studies). This figure provides an overview of the usage of different performance metrics in the studies, with ACC being the most reported metric and F1 being the least commonly reported metric.
Go to :
CVD RISK PREDICTION AND MANAGEMENT USING GENOMIC APPROACHES
The study of genes and DNA in people and other living organisms, known as genomics, sheds light on their genetic make-up and the expression and regulation of features. As genetic changes can play a role in the development and risk of CVD, understanding gene activity correlations at the molecular level can assist in identifying risk factors and forecasting disease outcomes. Genomics in CVD involves identifying genetic variants, such as single nucleotide polymorphisms (SNPs), contributing to disease development.6465 By analyzing individual patient genomes, doctors can develop personalized treatment plans based on their genetic makeup, improving the chances of successful intervention and prevention.66
Genomic methods and technology have become effective tools in the research of CVD, providing fresh perspectives on disease causes and new treatment targets. These include next-generation sequencing, which has revolutionized the field of genomics by enabling the rapid and affordable sequencing of entire genomes or targeted regions of interest, thereby allowing for the identification of rare genetic variants associated with CVD. To find genetic variants linked to complicated diseases like CVD, GWAS examines the whole genomes of large populations.67 The term “actual values in a large population” refers to the real-world outcomes related to the trait or disease being studied. This means gathering data on whether individuals in a large population develop the trait or disease over time. It is sometimes also called a gold standard or ground truth value.68697071 In particular, GWAS is a tool that evaluates genetic information to uncover differences in genes related to traits or disorders in an individual.910
Additionally, the study of the whole transcriptome, proteome, and metabolome through the disciplines of transcriptomics, proteomics, and metabolomics has shed light on the patterns of gene and protein expression and metabolic pathways linked to CVD.7273747576 The function of epigenetic alterations in the onset and development of CVD has also been clarified by epigenomics.7677 Finally, the function of genes linked to CVD has been studied and new treatments for the condition have been created using CRISPR/Cas9 gene editing technology.78 Together, these genomic tools and methods have uncovered previously unattainable details about the molecular underpinnings of CVD, paving the way for discovering new therapeutic targets for the condition.
Go to :
CONVENTIONAL PRS USING GWAS
PRS are statistical measures used to identify the likelihood of developing heritable diseases or traits, such as CVD. Conventional PRS techniques, like GWAS, assess DNA samples from enormous populations to locate specific SNPs linked to the target condition or trait.7980 In particular, GWAS examines the relationships between genetic variations, including SNPs, and the traits or diseases of interest.81
Fig. 4 shows elements for calculating PRS for CVD. A region in the genome known as an SNP indicates a distinction in an individual's genetic makeup by harboring one nucleotide in many forms.82 In GWAS, DNA samples from a large population are usually gathered, the genetic variations present in each sample are identified, and the data are then analyzed to find SNPs associated with the characteristic or disease of interest. While GWAS has been used to examine a variety of traits and diseases, including cancer, type 2 diabetes (T2D), and CAD, it is crucial to remember that SNPs are only one of many potential risk factors for disease.838485868788 Finding a novel SNP does not necessarily mean that the disease will be caused by it. Additionally, each gene has two copies, or alleles, present in pairs at each chromosomal locus and inherited from each parent. The many gene combinations that can produce distinct traits dictate the expressiveness of each trait in the body. To identify individuals with SNPs of interest, researchers calculate the frequency of alleles by dividing the number of individuals with the disease or trait of interest by the total number of individuals in the genotyping experiment. Then weights are assigned to each SNPs based on their effect size, determining the strength of the association between the SNPs and the trait or disease. A positive effect size denotes that a specific allele is attributed to a higher risk of the trait or disease, while a negative effect size denotes that a specific allele is attributed to a lower risk.8990
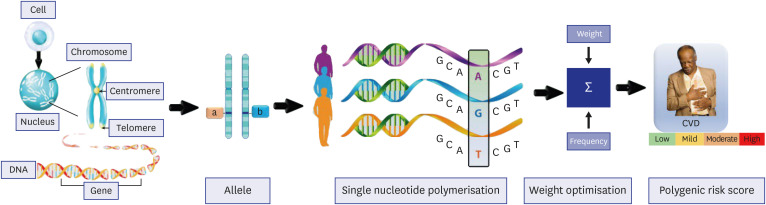
The statistical analysis calculates the P value, which represents the probability of the association between the SNP and the trait or disease occurring by chance. Researchers multiply the effect size by the genotype of individual p at SNP i, assigning weights to each SNP. These weights are then summed up to obtain the PRS for one participant. The accuracy of the PRS is assessed by comparing predicted risk scores with actual values in a large population, which can help to improve its predictive ability.
Where N is the total number of SNPs in the PRS,[INSERT FIGURE 002] signifies the effect size (or beta) of variant i, and [INSERT FIGURE 003]reflects the number of replicas of SNP i in the genotype of individual p.5391 After calculating the PRS we validate it by comparing the PRS with the actual value in many populations. It will assess the accuracy of PRS and can help to improve its predictive ability. PRS helps take clinical decisions regarding the concerned disease, however it should not be the only tool to identify the risk in patients because it does not consider the environmental factors, lifestyle, and family history, which could be different for every individual. If we combine the PRS with other risk factors, the accuracy and predictive capability of the PRS would increase manifolds.92
The flowchart in Fig. 5 illustrates the many procedures needed to compute and decipher a weighted PRS using SNPs. In step 1, we select a collection of SNPs that have been previously associated with the trait or condition of interest. Consult published studies, databases, or consortia studies that have identified genetic variants linked to the specific trait to accomplish this. In step 2, one must determine the effect size (beta) of each SNP after identifying the pertinent SNPs. This can be done by conducting a GWAS specific to the trait or by leveraging the results of a previously published GWAS. The effect size (beta) reveals the strength of the association between the SNP and the desired attribute. The risk allele for each SNP can be chosen depending on the impact sizes you obtained in step 2. Risk alleles are frequently found by examining the direction of the effect magnitude. For instance, if the allele associated with that influence exhibited a higher risk for the trait, it would be referred to as the risk allele. For each person, the weighted PRS is calculated by multiplying the number of risk alleles for each SNP by the effect size (beta) that each of those risk alleles has. By summing the total of these products across all the chosen SNPs and dividing each SNP’s impact size by the number of risk alleles a person carries for each SNP, this may be done. A genetic risk score for the desired characteristic or illness should be considered when interpreting the PRS. Higher PRS levels imply a greater genetic risk for the trait whereas lower readings indicate a reduced genetic risk. It is critical to keep in mind that the PRS is only one aspect of genetic risk and that environmental and behavioral factors that can increase the chance of getting a disease should be considered in addition to genetic risk.
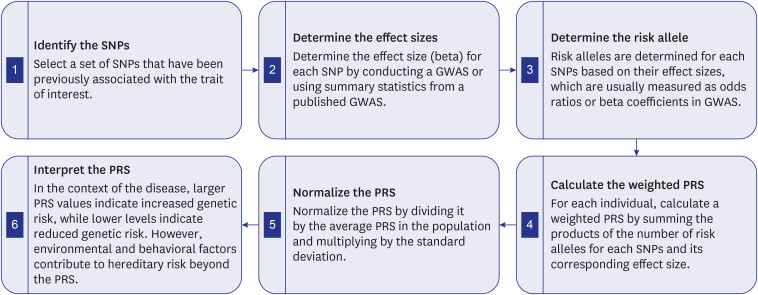 | Fig. 5GWAS analysis for calculating and interpreting PRS. A simplified illustration of the related phases involved in GWAS analysis is provided by this flowchart. The first step in the procedure is to locate the SNPs associated with the desired phenotype (Box 1) and calculate their effect sizes (Box 2). The weighted PRS is then determined by identifying the risk allele (Box 3 and 4). To allow for inter-individual comparisons, the PRS is then normalized (Box 5). The trait under investigation is then taken into consideration when interpreting the PRS (Box 6). Please take note that although the steps are listed sequentially for clarity, they are actually interrelated and iterative in nature.SNP = single nucleotide polymorphism, GWAS = Gene Wide Association Studies, PRS = Polygenic Risk Score.
|
Go to :
ROLE OF AI IN PRS
In genomics, PRS is an effective instrument for predicting complex features like CVD.93 The PRS is constructed by selecting markers from a preliminary training sample and then constructing a weighted sum of associated alleles within each participant. This approach has been implemented to develop risk prediction models for CVD and to determine a shared genetic foundation for associated diseases.94 More complex models for predicting CVD based on PRS have been developed as a result of recent breakthroughs in AI.959697
Determining which genetic variants are most useful for predicting disease risk is a significant use of AI in developing PRS.9598 The polymorphisms most strongly related to disease risks can be found using ML algorithms that analyze large-scale genomic data from varied populations.99100 By utilizing the expanding body of big data in medicine, AI may enable the best creation of patient-specific models for enhancing CVD diagnosis, intervention, and outcome. AI can also be utilized to generate advanced approaches, such as neural networks, and DL algorithms, for amalgamating genetic variations into a single PRS.43101102103104
Additionally, it can assist in improving the weighting of specific genetic variations in PRS by accounting for their effect magnitude and other variables including gene-gene interactions and environmental factors that could affect their influence on disease risk. This may result in more accurate and individualized risk evaluations.105106107 AI may also be employed to create risk stratification tools that are more sophisticated and account for various risk factors as well as their interactions.108 For instance, using AI, risk assessments and preventative plans can be tailored to subgroups of people with various risk profiles depending on their genetic makeup and environmental exposure.109 AI can speed up the creation of new PRS models and increase their ability to generalize to various populations. AI can generate more precise and individualized risk models that can be used to guide therapeutic decision-making by analyzing massive and diverse datasets to find genetic and environmental factors that may be more significant in certain populations or subgroups. Based on a person’s risk profile, AI-powered decision support tools can also assist in identifying effective screening and preventative initiatives.110111 For instance, those with a high risk of developing a particular type of cancer could be advised to undergo earlier and more frequent screening, whilst those with a low risk might be able to skip a few screening procedures. Table 1112113114115116117118119120 lists details on various CVD risk assessment programs, including their risk ratings, citations, and distinguishing characteristics. Based on several variables like age, gender, blood pressure, cholesterol levels, family history, and ethnicity, these programs are intended to assess a person's risk of acquiring cardiovascular illnesses.
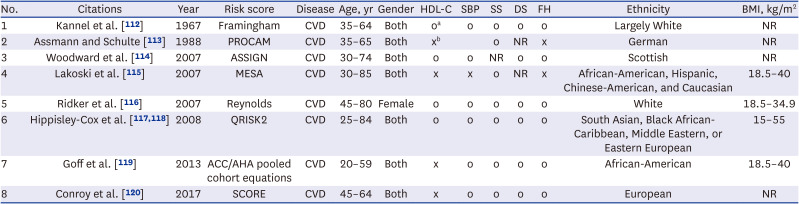
Table 1
Comparative analysis of patient characteristics and risk scores
| No. | Citations | Year | Risk score | Disease | Age, yr | Gender | HDL-C | SBP | SS | DS | FH | Ethnicity | BMI, kg/m2 |
|---|---|---|---|---|---|---|---|---|---|---|---|---|---|
| 1 | Kannel et al. [112] | 1967 | Framingham | CVD | 35–64 | Both | oa | o | o | o | o | Largely White | NR |
| 2 | Assmann and Schulte [113] | 1988 | PROCAM | CVD | 35–65 | Both | xb | o | NR | x | German | NR | |
| 3 | Woodward et al. [114] | 2007 | ASSIGN | CVD | 30–74 | Both | o | o | NR | o | o | Scottish | NR |
| 4 | Lakoski et al. [115] | 2007 | MESA | CVD | 30–85 | Both | x | x | o | NR | x | African-American, Hispanic, Chinese-American, and Caucasian | 18.5–40 |
| 5 | Ridker et al. [116] | 2007 | Reynolds | CVD | 45–80 | Female | o | o | o | o | o | White | 18.5–34.9 |
| 6 | Hippisley-Cox et al. [117118] | 2008 | QRISK2 | CVD | 25–84 | Both | o | o | o | o | o | South Asian, Black African- Caribbean, Middle Eastern, or Eastern European | 15–55 |
| 7 | Goff et al. [119] | 2013 | ACC/AHA pooled cohort equations | CVD | 20–59 | Both | x | o | o | o | o | African-American | 18.5–40 |
| 8 | Conroy et al. [120] | 2017 | SCORE | CVD | 45–64 | Both | x | o | o | o | o | European | NR |
HDL-C = high density, SBP = systolic blood pressure, SS = smoking status, DS = diabetes status, FH = family history, BMI = body mass index, CVD = cardiovascular disease, NR = not reported, PROCAM = Prospective Cardiovascular Münster, ASSIGN = ASsessing cardiovascular risk using SIGN guidelines, MESA = Multi-Ethnic Study of Atherosclerosis, QRISK = QRESEARCH cardiovascular risk algorithm(www.qresearch.org), SCORE = Systematic COronary Risk Evaluation, ACC = American College of Cardiology, AHA = American Heart Association.
ao = included, bx = not included.
![]()
Additionally, AI-powered decision support solutions can offer patients educational materials and resources to aid in their understanding of their PRS and any associated health effects. Patients might be advised to make lifestyle changes, such as dietary and activity adjustments, that can lower their risk of contracting specific diseases. In summary, AI has the potential to revolutionize the use of PRS information to improve healthcare by delivering more individualized risk assessments, better-targeted screening and preventative efforts, and more successful patient engagement and education. Fig. 6 shows the various ways AI is used in genomic medicine. It displays the various phases of the genomic medicine pipeline, such as the gathering and preprocessing genomic data, genomic analysis and interpretation, and clinical decision-making. AI approaches including forecasting, amalgamation, and genomic inference are applied to increase the precision and dependability of genetic analysis. Some of the clinical applications of AI in genomic medicine include routine mode practice, pharmacological trials, and system design. AI can also be used to analyze gene variations and PRS to forecast a person’s chance of contracting a specific disease. The figure highlights ways AI is helping to advance genomic medicine and enhance patient outcomes.

Deep learning model dimensionality reduction for gene analysis
In this section, we discuss the diverse methodologies and strategies researchers have employed to mitigate the challenge posed by high-dimensional gene data, which comprises many variables or features.121 The intricacies of analyzing and interpreting such data require dimensionality reduction, whereby the number of variables is reduced to a more manageable level, thereby enhancing the performance of DL models.122
Dimensionality reduction has been well established in the field of medical imaging before.123124 They offer several advantages in our current context. First, by lowering the number of features, these strategies boost computational performance, enabling a quicker and more effective analysis of high-dimensional gene data. Given the prevalence of large-scale datasets in gene analysis, such a paradigm is very helpful. Second, dimensionality reduction improves DL model performance by reducing the dimensionality curse. These methods increase the generalization and prediction accuracy of the models by concentrating on the most instructive aspects and removing noise and extraneous data. Additionally, dimensionality reduction aids in tackling multicollinearity, which can develop when strongly associated predictor variables. Dimensionality reduction assures that the DL models are built on independent and uncorrelated variables by finding and removing correlated characteristics, producing more consistent and understandable results. Moreover, these techniques facilitate visualization and interpretation of high-dimensional gene data. By reducing the data to a lower-dimensional space, patterns and relationships within the data become easier to comprehend. This helps in gaining insights into the underlying structure and mechanisms of gene-related phenomena. In conclusion, dimensionality reduction methods in gene analysis include benefits like increased computing effectiveness, improved model performance, addressing multicollinearity, facilitating visualization and interpretation, and extracting significant features. In our research we explore the details on the various dimensionality reduction techniques implemented in DL models for gene analysis, like GWAS-based dimensionality reduction, Binary Particle Swarm Optimization (BPSO)-based dimensionality reduction, and Random Walk Restart-CNN-based dimensionality reduction.125126 Each of these approaches involves distinctive strategies for selecting the most pertinent features, transforming the data into a lower-dimensional format, and utilizing DL models to explore the data. Several methods have been applied for dimensionality reduction for ML/DL models. Previously principal component analysis (PCA)127128 and PCA-polling128129 methods have been applied. In genomics-based research, statistical test has been for feature dimensionality reduction.130 BPSO and Random Walk Research-CNN based approaches are evolutionary methods mainly for compression (or dimensionality reduction) objective and iterative in nature,131 unlike PCA and PCA-polling methods are less iterative in nature and straight forward to implement. BPSO have shown to have different applications in pruning AI systems and yields higher dimensionality reduction ratio. Peng et al.132 proposed the deep PRS model which encodes the genotype information into feature vectors, which are then sent into a deep neural network with a Bi-LSTM layer to capture long-distance interactions between genes. This method reduced the dimensionality of genetic data.
According to the deep PRS risk analysis, people with high deep PRS are more likely to develop the disease than people with low deep PRSs. Deep PRS can be employed as a disease early warning indication for screening and disease prevention in high-risk populations. For Alzheimer’s disease (AD), inflammatory bowel disease (IBD), T2D, and breast cancer (BC), deep PRS performed better than two other state-of-the-art approaches using the UK Biobank dataset. Also, it assessed deep PRS ability to produce PRSs for these diseases. The findings demonstrated that deep PRS performed well in predicting disease risk. The AUC values for AD, IBD, T2D, and BC were 0.7245, 0.6517, 0.6508, and 0.6227, respectively. Furthermore, when Deep PRS was combined with clinical features, the AUC values improved to 0.8624, 0.6585, 0.7316, and 0.6660 for AD, IBD, T2D, and BC, respectively. These results demonstrate the strong performance of Deep PRS when evaluated in conjunction with clinical characteristics. Deep PRS also outperforms methods that use genotype weight estimates from GWAS and requires less prior knowledge than conventional methods.
Khalifa et al.125 employed the BPSO algorithm as a feature selection technique to isolate the most pertinent genes from high-dimensional gene expression data. These genes were then transformed into a low-dimensional image format and fed into a CNN for tumor classification. Preprocessing is the initial step, which entails utilizing BPSO-DT to choose the best features from the high-dimensional RNA-seq data and transform the selected features into 2D pictures. The second stage is augmentation, which multiplies the initial dataset of 2,086 samples by five while having the least impact on the image's features. This aids in overcoming the issue of overfitting and educates the model to be more accurate. The third stage is the deep CNN phase, which has two primary convolutional layers for feature extraction and two fully connected layers for classification. The proposed method was tested on five different cancer types: uterine corpus endometrial carcinoma, lung squamous cell carcinoma, lung adenocarcinoma, and kidney renal clear cell carcinoma. The findings demonstrate that the suggested method exceeded comparable works in testing accuracy for the five kinds of cancer, achieving an overall testing accuracy of 96.90%. Additionally, the suggested method requires less memory and is less complicated.
Peng et al.126 devised a model for predicting gene function that used semi AE, a unique version of AE which stands for autoencoders, a class of neural networks frequently employed for unsupervised learning. They proposed an innovative approach for predicting gene function based on several heterogeneous networks, known as Deep MNE-CNN. The Deep MNE-CNN design was primarily composed of two components. The semi AE was employed in the first section to combine various networks and produce low-dimensional feature representations of the genes. The semi AE was trained in a semi-supervised manner using the labelled and unlabeled data. The association between genes was captured using the pairwise correlation coefficients, which further increased the precision of the feature learning procedure. On yeast and human datasets, the Deep MNE-CNN method's performance was assessed and contrasted with that of four cutting-edge techniques. The outcomes demonstrated that the Deep MNE-CNN method performed better in prediction accuracy than the other methods.
Xu et al.133 used the autoencoder dimensionality is reduced by feeding the autoencoder a low-dimensional representation of the input gene expression data, which is then used for matrix factorization. This method emphasizes the potential of dimensionality reduction methods based on autoencoders for handling high-dimensional gene expression data. The autoencoder can identify significant patterns and correlations within the data while minimizing noise and redundancy by compressing the data into a lower-dimensional representation.
Zeng et al.134 proposed a DL framework, the deep matrix factorization model DMFLDA, to forecast lncRNA-disease relationships. Deep autoencoders, feature learning, and disease semantic similarity are all used in the framework to effectively learn the low-dimensional representations of lncRNA and disease features. The learned representations predict the associations between lncRNAs and disease and then fed into a classification model. The research illustrates the promise of DL-based techniques for analyzing high-dimensional genomic data and demonstrates the efficacy of DMFLDA in identifying lncRNA-disease connections. The authors used AUC to assess the model’s performance. The DMFLDA model had strong predictive performance, evidenced by its AUC score of 0.8393. In addition, the DMFLDA model beat numerous cutting-edge approaches, including RWRMDA, SimNMF, and LRLSLDA, to predict lncRNA-disease relationships. According to the comparative analysis, DMFLDA has much higher prediction accuracy, sensitivity, specificity, and precision.
Zhao et al.135 proposed an ML method utilizing k-means dimensional reduction for predicting survival outcomes in BC patients. The recommended method reduces the high-dimensional gene expression data to a lower-dimensional framework using k-means clustering. The support vector machine (SVM) classifier is trained on the reduced data to forecast patient survival outcomes.
Furey et al.136 used PCA and linear discriminant analysis for dimensionality reduction. The authors train an SVM classifier for cancer classification using the reduced-dimensional data as input. The suggested strategy is assessed and contrasted with other cutting-edge approaches on several benchmark datasets. The outcomes demonstrate that the suggested strategy performs well in accuracy and, in some circumstances, outperforms alternative approaches.
Gu et al.137 used heterogeneous graph neural networks (HGNN), a technique for integrating various forms of genomic data, such as protein-protein interaction networks and gene expression networks, using an HGNN. By mixing information from several modalities and using the connections between various forms of data, the HGNN develops a low-dimensional representation of the genomic data.
Go to :
CRITICAL DISCUSSION
First, by combining various genetic variations and other risk factors, using aiPRS for CVD risk prediction can improve the accuracy of predicting a person's likelihood of developing CVD. Second, aiPRS models can get beyond the limits of conventional PRS calculators by using a more extensive range of genetic and non-genetic factors in the risk assessment process, leading to more accurate and unique risk estimates. Third, by employing AI approaches to reduce the dimensionality of massive genomic datasets, disease risk prediction models can be improved and made more effective.
Benchmarking analysis
Table 2 provides an overview of studies conducted on different statistical/AI/ML algorithms used for the construction of PRS for different diseases.84132138139140141142143
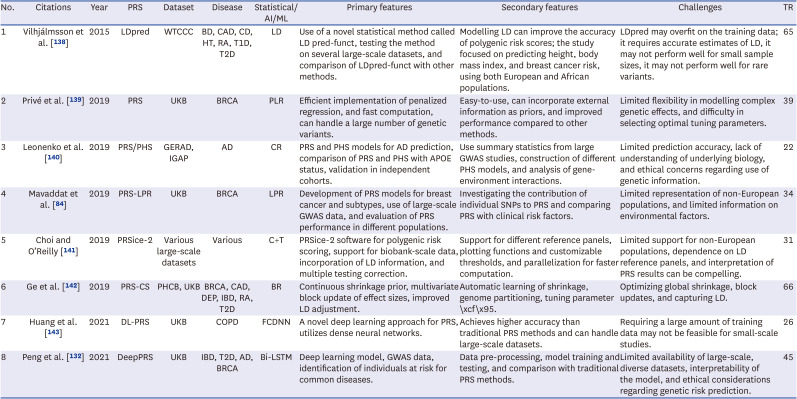
Table 2
Benchmarking analysis of studies
| No. | Citations | Year | PRS | Dataset | Disease | Statistical/AI/ML | Primary features | Secondary features | Challenges | TR |
|---|---|---|---|---|---|---|---|---|---|---|
| 1 | Vilhjálmsson et al. [138] | 2015 | LDpred | WTCCC | BD, CAD, CD, HT, RA, T1D, T2D | LD | Use of a novel statistical method called LD pred-funct, testing the method on several large-scale datasets, and comparison of LDpred-funct with other methods. | Modelling LD can improve the accuracy of polygenic risk scores; the study focused on predicting height, body mass index, and breast cancer risk, using both European and African populations. | LDpred may overfit on the training data; it requires accurate estimates of LD, it may not perform well for small sample sizes, it may not perform well for rare variants. | 65 |
| 2 | Privé et al. [139] | 2019 | PRS | UKB | BRCA | PLR | Efficient implementation of penalized regression, and fast computation, can handle a large number of genetic variants. | Easy-to-use, can incorporate external information as priors, and improved performance compared to other methods. | Limited flexibility in modelling complex genetic effects, and difficulty in selecting optimal tuning parameters. | 39 |
| 3 | Leonenko et al. [140] | 2019 | PRS/PHS | GERAD, IGAP | AD | CR | PRS and PHS models for AD prediction, comparison of PRS and PHS with APOE status, validation in independent cohorts. | Use summary statistics from large GWAS studies, construction of different PHS models, and analysis of gene-environment interactions. | Limited prediction accuracy, lack of understanding of underlying biology, and ethical concerns regarding use of genetic information. | 22 |
| 4 | Mavaddat et al. [84] | 2019 | PRS-LPR | UKB | BRCA | LPR | Development of PRS models for breast cancer and subtypes, use of large-scale GWAS data, and evaluation of PRS performance in different populations. | Investigating the contribution of individual SNPs to PRS and comparing PRS with clinical risk factors. | Limited representation of non-European populations, and limited information on environmental factors. | 34 |
| 5 | Choi and O’Reilly [141] | 2019 | PRSice-2 | Various large-scale datasets | Various | C+T | PRSice-2 software for polygenic risk scoring, support for biobank-scale data, incorporation of LD information, and multiple testing correction. | Support for different reference panels, plotting functions and customizable thresholds, and parallelization for faster computation. | Limited support for non-European populations, dependence on LD reference panels, and interpretation of PRS results can be compelling. | 31 |
| 6 | Ge et al. [142] | 2019 | PRS-CS | PHCB, UKB | BRCA, CAD, DEP, IBD, RA, T2D | BR | Continuous shrinkage prior, multivariate block update of effect sizes, improved LD adjustment. | Automatic learning of shrinkage, genome partitioning, tuning parameter \xcf\x95. | Optimizing global shrinkage, block updates, and capturing LD. | 66 |
| 7 | Huang et al. [143] | 2021 | DL-PRS | UKB | COPD | FCDNN | A novel deep learning approach for PRS, utilizes dense neural networks. | Achieves higher accuracy than traditional PRS methods and can handle large-scale datasets. | Requiring a large amount of training data may not be feasible for small-scale studies. | 26 |
| 8 | Peng et al. [132] | 2021 | DeepPRS | UKB | IBD, T2D, AD, BRCA | Bi-LSTM | Deep learning model, GWAS data, identification of individuals at risk for common diseases. | Data pre-processing, model training and testing, and comparison with traditional PRS methods. | Limited availability of large-scale, diverse datasets, interpretability of the model, and ethical considerations regarding genetic risk prediction. | 45 |
PRS = Polygenic Risk Score, AI = artificial intelligence, ML = machine learning, TR = total references, LD = linkage disequilibrium, WTCCC = Wellcome Trust Case Control Consortium, BD = bipolar disorder, CAD = coronary artery disease, CD = Crohn’s disease, HT = hypertension, RA= rheumatoid arthritis, T1D = type 1 diabetes mellitus, T2D = type 2 diabetes mellitus, UKB = United Kingdom Biobank, BRCA = breast cancer, LPR = Lasso penalized regression, PLR = penalized logistic regression, GERAD = Genetic and Environmental Risk in Alzheimer’s Disease Consortium, IGAP = International Genomics of Alzheimer’s Project, AD = Alzheimer’s disease, CR = cox regression, PHS = Polygenic Hazard Score, APOE = apolipoprotein E, GWAS = Gene Wide Association Studies, SNP = single nucleotide polymorphism, C+T = clumping+thresholding, PRS-CS = Polygenic Risk Score–Continuous Shrinkage, PHCB = Partners HealthCare Biobank, DEP = depression, IBD = inflammatory bowel disease, BR = Bayesian regression, FCDNN = fully connected deep neural network, Bi-LSTM = bidirectional long short term memory.
![]()
Vilhjálmsson et al.138 proposed a novel statistical method called LD pred-funct. The purpose of their study was to improve the accuracy of PRS by incorporating linkage disequilibrium (LD) information. They used LDpred to analyse several sizable datasets and evaluated their effectiveness in comparison to other approaches. They concentrated on phenotypic prediction for conditions such as type 1 diabetes, type 2 diabetes, rheumatoid arthritis, CAD, Crohn’s disease, hypertension, and bipolar disorder. When predicting these traits, LDpred outperformed other approaches due to the inclusion of LD information. They used both European and African populations to predict height, body mass index, and BC risk. Modelling LD patterns—the non-random connection of alleles at various loci—allows LDpred to act on the genome. The goal of LDpred is to enhance the predictive accuracy of PRS by capturing the associated effects of genetic variations. However, the study highlighted some LDpred flaws. First, LDpred might overfit the training data, which would mean that it might perform incredibly well there but struggle to generalise to new data. Correct LD calculations are necessary for the strategy to function. Additionally, LDpred could not perform well with small sample sizes since the little data might make it impossible to faithfully replicate LD patterns. Finally, LDpred might not be the ideal technique for predicting uncommon variations because they might have different LD patterns than common ones.
Privé et al.139 calculated PRS on UK Biobank dataset using the Penalized Logistic Regression. The goal of the study was to manage a high number of genetic variants while increasing the computing efficiency of PRS computations. They were able to lessen the processing strain and speed up the computation process by adopting penalized regression. Their strategy’s user-friendliness was a major plus. The technique was created to be simple to apply, allowing researchers to calculate PRS rather quickly. Additionally, their method permitted the insertion of outside data as priors, which might improve the precision of PRS predictions. Compared to other approaches, their method performed better, which suggested that it accurately identified the genetic contributions to BC risk. However, the study highlighted some flaws. Their strategy was not very adaptable for simulating intricate genetic processes. Although it handled a lot of genetic variants well, it might not have captured more complex linkages or interactions between genetic factors. Additionally, it is challenging to choose the best tuning settings for the penalised regression model. The level of penalization and regularisation used throughout the model fitting phase is controlled by tuning parameters. To get the optimum performance, choosing the proper parameters can be difficult and requires significant thought.
Leonenko et al.140 evaluated the age-specific genetic risk for AD using the PRS and compare the findings with the Polygenic Hazard Score (PHS). They used the data from IGAP (IGAP: International Genomics of Alzheimer’s Project) and GERAD (Genetic and Environmental Risk in Alzheimer’s Disease Consortium). Their goal was to measure individual variations in age-specific genetic risk for AD and to assess how well PRS and PHS can predict the development of the disease. Based on SNPs found in GWAS that were related with AD, PRS and PHS were determined for each participant. The age-specific genetic risk for AD with PRS was quantified using Cox Regression analysis, and PHS scores were calculated for the same individuals. The usefulness of PRS and PHS in determining the genetic risk for AD that is age-specific was established in this study. Even though the results showed that PRS based on genome-wide significant SNPs showed the strongest association, more research is required to examine the specific benefits and restrictions of PHS compared to PRS in the prediction of AD risk, especially when considering various SNP selection criteria and the Cox Proportional Hazard Regression model.
Mavaddat et al.84 used the Lasso Penalized Regression (LPR) technique to choose pertinent factors and account for overfitting when constructing the PRS. LPR finds the most useful SNPs related to BC. While minimising the impact of noise or irrelevant genetic variants, the PRS-LPR approach’s usage of LPR enabled for the identification of a subset of SNPs that contribute the most to the prediction of BC risk. They built PRS models using extensive GWAS data and assessed how well they performed at predicting the risk of BC. The study showed PRS increased risk prediction beyond only clinical risk variables. However, there were drawbacks, such as the need for more thorough environmental data and the inadequate representation of non-European groups.
Choi and O’Reilly141 made a software PRSice-2 similar to PRSice to calculate the PRS by using the “C+T” approach, which clumps single-nucleotide polymorphisms (SNPs) based on LD and P value thresholding. The key characteristics of PRSice-2 are its capacity to conduct large-scale PRS analyses on genotyped and imputed data, compute empirical association P values to address overfitting, analyse numerous target phenotypes concurrently, and provide options for imputing missing genotypes. It supports various inheritance models (additive, dominant, recessive, and heterozygous) and automatically creates dummy variables for categorical covariates. The complexity of PRSice-2, which offers a variety of features and options for PRS analysis, is one possible drawback. Because of this intricacy, users may need to have a certain level of experience in genomics and statistical analysis in order to completely understand and use the application. Additionally, because PRSice-2 uses several different parameters and calculations, including clumping and P value thresholding, comprehending the findings it produces can be difficult. To achieve proper interpretation and valuable insights from the analysis, adequate knowledge of these factors is required.
Ge et al.142 used the Bayesian Regression framework and GWAS summary statistics to develop PRS-CS. The inclusion of a continuous shrinkage (CS) prior on SNP effect sizes is a crucial component of PRS-CS. The heterogeneity in genomic layouts across many traits and disorders is addressed by this prior. The PRS-CS method improves resilience in its predictions and offers computational advantages over other approaches by utilising the CS prior. The Partners HealthCare Biobank was used to use PRS-CS to estimate the probability of six prevalent complicated diseases and six quantitative features. In comparison to other approaches, the results demonstrated PRS-CS’s superiority in terms of prediction accuracy. By adding a CS prior and a Bayesian regression framework, PRS-CS represents a development in the field of polygenic prediction. The accuracy of risk prediction is improved by its capacity to capture local patterns of LD and adapt to various genomic architectures.
Huang et al.143 designed a DL neural network strategy for GWAS and PRS. The condition known as chronic obstructive pulmonary disease (COPD) is complicated and varied, impacted by both genetic and environmental factors. Traditional techniques, such as GWAS and PRS, have proved effective in locating risk variations, but they operate under the supposition that each allele’s effects are independent and unaffected by other variables. To get over these constraints DL-PRS was made. It makes less assumptions regarding the genetic effects that are being modelled since DL models can capture gene-gene interactions and non-additive effects. Several populations based GWAS studies of COPD were used by the researchers to apply the DL technique to genetic association data. Comparing the DL-PRS method to other PRS methods, it showed superior predictive ability, expanding the ranges of risk prediction and establishing a stronger connection with lung function measurements. However, DL-PRS implementation requires a significant investment in processing power and DL technique knowledge. This study emphasizes how ML methods could improve risk prediction models for difficult-to-diagnose conditions like COPD.
Peng et al.132 developed a DL model called DeepPRS using the GWAS data obtained from UK Biobank to identify people at risk of four different diseases such as IBD, BRCA, T2D, AD using the Bi-LSTM. It was trained to discover the intricate patterns and relationships between genetic variations and disease risk using the GWAS data as its input. The process included several crucial components. The GWAS data first underwent pre-processing, which included quality control steps to guarantee data dependability and integrity. To model the links between genetic variations and disease outcomes, the Bi-LSTM architecture was then used. A vast amount of labelled data was used to train the model where everyone’s genetic makeup and disease state were known. They evaluated DeepPRS effectiveness by contrasting its prognostic capabilities with those of conventional PRS techniques. They assessed DeepPRS’s precision, sensitivity, and specificity in predicting the risk of developing IBD, T2D, AD, and BRCA diseases. To learn more about the genetic factors impacting disease susceptibility, they also looked at the model's interpretability. However, there are some challenges associated with it. The lack of large-scale, diverse datasets was one of the primary drawbacks, which could have affected the model’s resilience and generalizability. The DL model’s interpretability presented another difficulty because of its complicated design, which may make it challenging to comprehend the precise genetic elements influencing illness risk estimates.
A short note on AI for PRS
The PRS is a technique for estimating a person’s genetic risk for contracting a complex disease. PRS creates a composite score that can be used to calculate an individual's total genetic susceptibility to the disease by combining data from numerous genetic variants, each of which has a negligible impact on disease risk. Due to improvements in genotyping technology and the accessibility of extensive genetic data from GWAS, PRS has grown in popularity in recent years.9 However, determining PRS precisely can be difficult, especially when working with big datasets including millions of genetic variants. AI is useful in this situation. The use of AI techniques has improved the precision and effectiveness of PRS estimates, especially ML models.144 The creation of more precise PRS models is made possible by the ability of these models to analyze massive amounts of genetic data and pinpoint the key genetic variants for determining disease risk.
The gradient boosting machine (GBM) is one ML method applied to PRS computation.145 Even in noisy or correlated data, the potent ML algorithm GBM can precisely identify the most pertinent genetic variations for predicting disease risk. For a variety of complicated diseases, including T2D,146147 BC,84 and AD,148 GBM has been utilized to create PRS models. The neural network is another ML method that has demonstrated potential in PRS computation.149 A DL algorithm known as a neural network can recognize intricate patterns in genetic data and produce precise forecasts of disease risk. A PRS model for colorectal cancer was created in one study using a neural network, and it performed more accurately than conventional PRS models.150 AI has been used to find new genetic variations linked to illness risk and increase PRS accuracy. For instance, a recent study that examined GWAS data for schizophrenia using a deep neural network discovered numerous unique genetic variations linked to the condition.151
The role of bias and variance in AI
The assessment of bias and variance in AI models has gained significant importance in recent years.152153 Previous computer-aided diagnosis techniques have revealed shortcomings not only in evaluating bias but also in managing variance effectively.154 To address these challenges comprehensively, a multifaceted approach is essential. To mitigate both bias and variance, a range of strategies can be employed.70155 Utilizing large sample sizes can help in reducing bias by ensuring a more representative dataset, while also aiding in mitigating variance by providing a broader data spectrum. Conducting appropriate clinical testing is crucial for evaluating model performance under different conditions, thereby tackling both bias and variance issues.
Additionally, utilizing big data configurations can assist in minimizing bias by capturing a more comprehensive view of the data distribution, while it also has implications for managing variance by introducing higher dimensionality and variability. Analyzing unseen data is vital to uncover both bias and variance, as it helps identify how well the model generalizes to new, unobserved cases. Finally, scientifically validating the training model design plays a crucial role in reducing both bias and variance, as a well-designed model is less prone to systematic errors and overfitting. Key steps in patient risk stratification encompass assessing not only the AI risk of bias155156157 but also considering the AI risk of variance (RoV). It is essential to appropriately modify diagnostics and treatment plans to account for both bias and variance in AI models. This holistic approach ensures that AI-based medical decisions are not only fair but also consistently reliable across different patient populations and scenarios. In summary, addressing bias and variance in AI models is essential for achieving both fairness and reliability in healthcare applications. By implementing a combination of strategies and considering both aspects, we can enhance the quality of AI-driven diagnostics and patient risk stratification.
The role of explainability in AI
Understanding how AI’s “black box” functions are critical for effective AI design. The role of AI Explainability practitioners is more likely to comprehend this “black box” if the results it produces can be interpreted and questioned.158 By employing tools such as Local Interpretable Model-Agnostic Explanations and Shapley Additive Explanations, AI models can provide insights into complex disorders, which has garnered trust among medical professionals.159160 Additionally, techniques like GradCAM, GradCAM+, or GradCAM++ can be utilized to visualize carotid lesions and facilitate wider acceptance of AI models in the medical domain.161 This emphasis on interpretability enables the improvement and cost-effectiveness of AI devices.162
The role of cloud-based paradigms
Cloud-based XAI, can be used for calculating the PRS.163 The PRS is a score calculated based on an individual’s genetic information to estimate their risk of developing certain diseases or conditions.164 Cloud-based XAI refers to a system where ML algorithms are hosted on cloud servers and can be accessed remotely through the internet.165166 Consequently, processing massive amounts of data—like genetic data from a vast population—can be done more effectively and flexibly. In order to calculate PRS using cloud-based XAI, the algorithm would examine a sizable dataset of genetic data to pinpoint the precise genetic markers linked to a higher risk for a specific disease or condition.167 Based on each person’s unique genetic profile, the algorithm would utilise this data to determine a PRS for each person in the dataset. Using cloud based XAI for PRS computation is advantageous since it makes the findings more transparent and understandable. By using explainable AI, the algorithm can provide a detailed explanation of how it arrived at a particular PRS for an individual, making it easier for healthcare providers and patients to understand and make informed decisions about their health. Overall, cloud based XAI for PRS calculation can help to improve personalized medicine by providing more accurate and transparent risk assessments based on an individual's genetic information.
The role of pruning in AI systems
With the development of the internet and cloud-based systems, edge devices are becoming increasingly important.168 In mobile frameworks, these devices are crucial for utilising trained AI models for future predictions or illness risk stratifications.169 Compressed models must be used because it may not be possible to install huge data models on edge devices.131 Image-based DL models such as Fully Convolutional Networks or Segmentation Networks can be pruned using evolutionary algorithms like particle swarm optimization, genetic algorithms, wolf optimization, and differential evolution.170 The future of genetically-based paradigms and radiomics-based CVD risk stratification can be compacted and implemented on edge devices to serve rural areas, especially in developing countries.171
The role of big data
The focus of study has shifted from radiography and pathology to genetics as a result of the development of radiogenomics.172 Through the fusion of radiomics, genetic information, and clinical records, this change has led to the expansion of the radiogenomics field over the past ten years.173 By developing novel algorithms, procedures, and techniques, DL and big data programming have considerably advanced radiogenomics research.174 The creation of a completely automated system that interfaces with a radiological process in the big data realm is a significant advancement in the area.175 By decreasing the amount of time spent on tedious and repetitive tasks, this approach has increased productivity.176177 The ability to compare numerous images from the database concurrently allows for real-time therapy monitoring.175177
Special note on generalization of aiPRS
The use of AI in medical diagnosis, such as the detection and prediction of CVD, is one example of how generalisation in AI models can go beyond specialized domains and include a wide range of topics. The objective of generalization in this context is to create models capable of efficiently learning from a wide range of patient data, such as symptoms, medical history, and diagnostic tests, and producing precise predictions about unrecognized CVD cases. These AI models could help medical professionals by assisting in the early diagnosis, risk assessment, and personalized treatment recommendations for individuals with CVD. Generalization is vital in other AI disciplines in addition to medical applications. For instance, in natural language processing, even if a generalized language model has never encountered a particular sentence before, it may comprehend and produce coherent statements across a variety of themes.178 The same is true in computer vision, where a well-generalized model can identify items or patterns in photos, such as skin tones, objects in various surroundings, and more.124179180181 Effective generalization enables AI models to behave consistently in real-world circumstances outside the bounds of their training data. It is important to note that finding the ideal balance between memorization and generalization is essential in the development of AI.182 A model’s ability to perform well on fresh, untested data might be hampered by an excessive reliance on memorization without generalization. While some memorizing may be useful in capturing details or personalized preferences. AI systems can adapt and make precise predictions in a variety of changing situations by aiming for generalization.183184 To promote generalization and reduce overfitting, which is a type of memorizing, researchers and practitioners use strategies including regularization, cross-validation, and early stopping. AI solutions have a stronger and better ability to generalize compared to conventional-based methods, making them suitable for composite data analysis in CVD risk assessment. aiPRS leverage the power of AI on composite data for CVD risk assessment.3740185 This composite risk combines the PRS values derived from gene data and a combination of other biomarkers such as office-based, laboratory-based, radiomics-based, and genomics-based.186 Office-based biomarkers are the conventional risk biomarkers that constitute basic biomarkers namely height, weight, body mass index, hypertension values (systolic and diastolic blood pressure), smoking conditions, and family conditions. Laboratory-based biomarkers are blood-based conventional biomarkers namely cholesterol levels such as LDL, HDL, Total Cholesterol, triglycerides, fasting glucose, renal biomarkers like eGFR, arthritis biomarkers namely ESR, and homocysteine. Radiomics-based biomarkers, it includes the actual image-based biomarkers namely direct or surrogate biomarkers namely carotid plaque burden, carotid-intima thickness (maximum, minimum, and average), maximum carotid plaque height, and intima-media thickness variability. Genomics is the other risky genetic atherosclerotic biomarker.
When all such data are composited, the system becomes nonlinear and that is when the supervised DL systems are well fit for CVD risk prediction. Thus, it does not matter if the AI system is fed by the UK bio-bank data sets or ERIC database, or NIH-based data sets. It is worth noting that the DL layers allow to extract the powerful features from the composite data which can then be used for precise CVD risk prediction. It is the forward and backward propagation of the neural networks which allows to reduce the error between the weight propagation values and the gold standard. The number of iterations during the propagation (so-called epochs), besides the batch size in the DL system are supportive ingredients for a preventive, precise, and personalized (aiP3) approach for CVD risk estimation.4145187188
Strengths, weaknesses, and extensions
Conventional PRS is a straightforward and economical method that uses genetic data already available, but it is limited in its capacity to predict complex features since it cannot take complicated data interactions into account. Contrarily, aiPRS can effectively analyze multidimensional data, consider complicated data interactions, and include genetic, clinical, and imaging data. But it necessitates specialized knowledge and depends on reliable and readily available data. The usage of aiPRS may also raise privacy and ethical concerns. The use of AI in PRS computing and analysis offers enormous potential to improve our understanding of complex diseases and identify novel genetic targets for disease prevention and treatment. Despite the benefits of AI-based risk stratification, it is necessary to note its significant flaws and problems. The potential lack of generalizability of AI models is a serious flaw. AI models may not perform as well when applied to diverse populations or various circumstances if they were designed using certain datasets or populations.55178
To evaluate the generalizability and dependability of AI models in practical settings, comprehensive validation experiments involving a variety of populations must be conducted. The scant scientific evidence that supports the efficacy of AI-based risk prediction models is another area of weakness. While AI has potential, a thorough scientific examination is required to determine its therapeutic utility and dependability. It is crucial to conduct prospective validation studies comparing AI models to current risk prediction techniques and evaluating how well they function in actual clinical situations. These research projects will offer the required scientific proof to back up the adoption and application of AI-based risk prediction models. To enable the ethical incorporation of AI in risk classification, these flaws must be addressed. The limits of AI-based risk prediction models can be better recognized and reduced by undertaking validation studies across varied populations and producing empirical evidence of their efficacy. As a result, AI models will become more applicable and trustworthy, which will increase their ability to help with illness management and preventative plans.
More research is necessary, however, to accurately evaluate the dependability and accuracy of aiPRS models and ensure that these models are developed and applied ethically and openly. Lastly, we do need to understand the changes in aiPRS for CVD risk when comorbidities are involved such as viruses.189 Even though aiPRS technology is point data, but as things evolve, we will see gene data to get converted to images and screening tools can be applied,190191 such as usage of the classification tools.192 Further, correlations need to be developed between the aiPRS and cardiovascular outcomes.124193
Go to :
CONCLUSIONS
aiPRS modeling approaches offer enormous potential to enhance CVD personalized treatment approaches. Integrating multi-omics data, including genomes, transcriptomics, proteomics, and metabolomics, can offer a more thorough understanding of the molecular pathways driving CVD and increase the precision of PRS models.194 These AI-based techniques are especially beneficial for drawing out intricate patterns and connections from highly dimensional data genetic data. This makes it easier and more precise for scientists and doctors to find real connections between genetic variations and the likelihood of developing diseases. Additionally, AI algorithms may continuously learn from fresh data and enhance their performance, producing more accurate and unique risk evaluations over time.
The need for more representative and diverse data, new data analysis techniques, and ethical considerations remain major obstacles. More funding must be put into CVD genomics research and personalized medicine techniques to overcome these obstacles and improve patient outcomes. We can enhance our understanding of the intricate disease mechanisms underlying CVD and create more efficient methods for prevention, diagnosis, and therapy by fostering large-scale genomic data resources that are openly accessible and available.
Go to :
 XML Download