INTRODUCTION
METHODS
Subjects
Definitions
Examinations and endpoints
Ethical statements
RESULTS
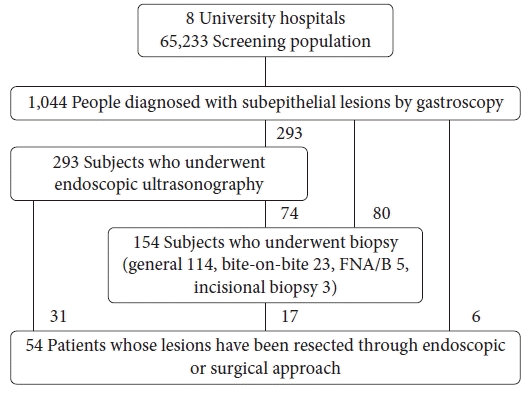
Prevalence and characteristics of upper GI SELs
Table 1.
| Hospitalsa) | Total subjects | No. of patients with subepithelial lesions | Incidence (%) |
|---|---|---|---|
| A | 16,786 | 199 | 1.19 |
| B | 21,609 | 156 | 0.72 |
| C | 3,888 | 65 | 1.67 |
| D | 5,215 | 156 | 2.99 |
| E | 5,283 | 184 | 3.48 |
| F | 3,321 | 81 | 2.44 |
| G | 4,953 | 101 | 2.04 |
| H | 4,178 | 102 | 2.44 |
| All | 65,233 | 1,044 | 1.60 |
Table 2.
| Characteristic | No. of patients |
|---|---|
| Gastroscopy examinees for cancer screening | 65,233 |
| Total no. of subepithelial lesions | 1,062 |
| People with subepithelial lesions found by endoscopy (n=65,233) | 1,044 (1.6) |
| Single (n=1,044) | 1,026 (98.3) |
| Multiple (n=1,044) | 18 (1.7) |
| Age (yr) (n=1,044) | 55.1±11.2/56 (12‒86) |
| <39 | 88 (8.4) |
| 40‒49 | 213 (20.4) |
| 50‒59 | 380 (36.4) |
| 60‒69 | 258 (24.7) |
| ≥70 | 105 (10.1) |
| Male sex | 560 (53.6) |
| Locations | |
| Esophagusa) | 246 (23.6) |
| Upper | 27 (2.6) |
| Middle | 72 (6.9) |
| Lower | 81 (7.8) |
| Undocumented | 66 (6.3) |
| Stomachb) | 666 (63.8) |
| Upper | 291 (27.9) |
| Middle | 53 (5.1) |
| Lower | 133 (12.7) |
| Undocumented | 189 (18.1) |
| Duodenum | 132 (12.6) |
| Bulb | 25 (2.4) |
| Second portion | 47 (4.5) |
| Undocumented | 60 (5.7) |
| Maximal diameter (mm) (all SELs) (n=748) | 9.9±6.1 |
| <10 | 373 (49.9) |
| 10‒20 | 322 (43.0) |
| 20‒30 | 40 (5.3) |
| ≥30 | 13 (1.7) |
| Mean size of SELs at the time of diagnosis (mm) | 9.9±6.1 |
| Esophagus | 9.6±5.7 |
| Stomach | 9.8±6.1 |
| Duodenum | 11.1±6.5 |
Values are presented as number (%), mean±standard deviation/median (range), or mean±standard deviation.
SEL, subepithelial lesion.
a) If there is no mention of the location of the esophagus, within 20 cm of the upper incisor was classified as 'upper esophagus,’ and if more than 30 cm from the upper incisor, it was classified as 'lower esophagus.’ The distance to the upper incisor was classified as 'undocumented' if it was not mentioned.
Table 3.
Types and distribution of SELs according to the location
Table 4.
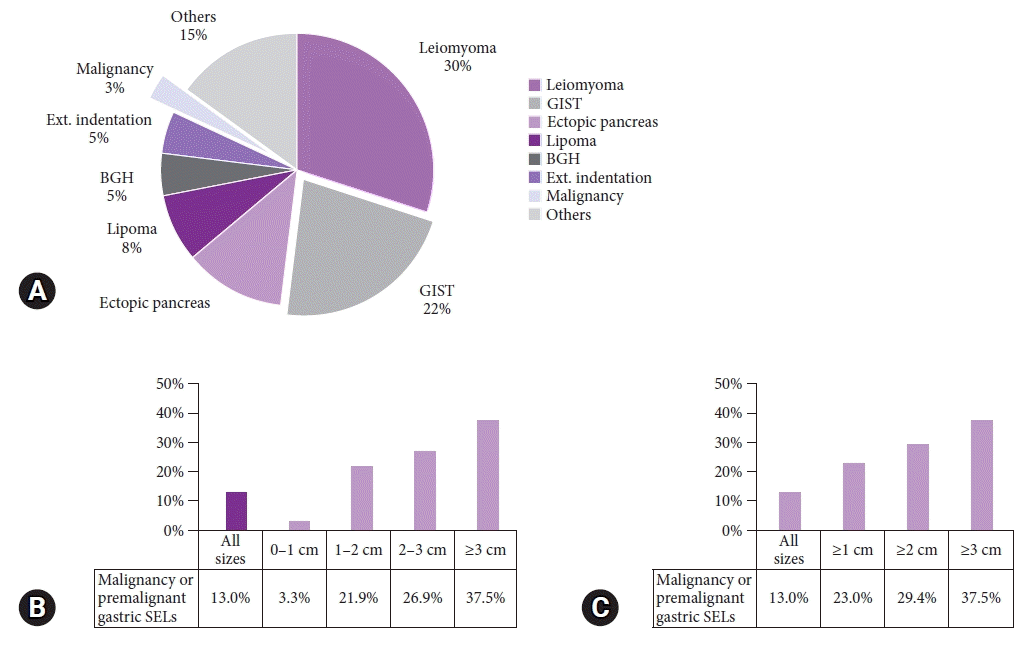 | Fig. 2.Distribution of upper gastrointestinal subepithelial lesions (SELs) according to size. (A) Types of SELs of 2 cm or more. (B, C) Comparison of the proportion of malignancy or premalignant gastric SELs by size. Malignancy or premalignant lesions included gastrointestinal stromal tumors, neuroendocrine tumors, and gastric cancer. BGH, Brunner’s gland hyperplasia; Ext., external; GIST, gastrointestinal stromal tumor. |
Natural course of upper GI SELs
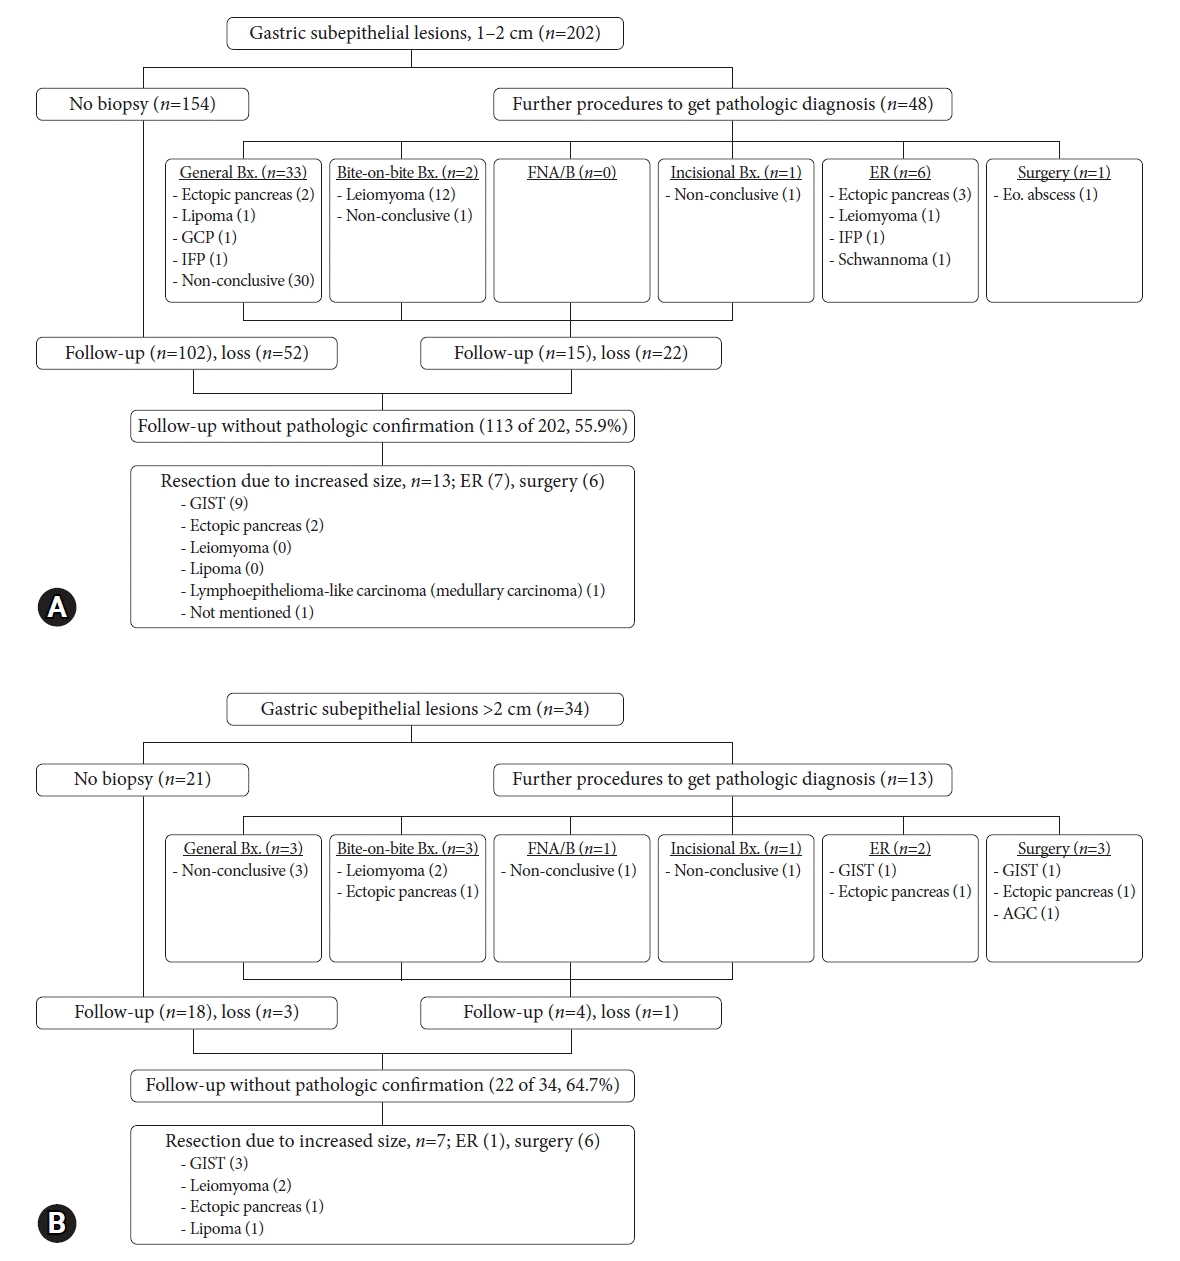 | Fig. 3.Natural course of gastric subepithelial lesions (SELs) according to size. (A) Gastric SELs measuring 1 to 2 cm in size. (B) Gastric SELs larger than >2 cm. Bx., biopsy; GCP, gastritis cystica profunda; IFP, inflammatory fibroid polyp; FNA/B, fine needle aspiration/biopsy; ER, endoscopic resection; Eo., eosinophilic; GIST, gastrointestinal stromal tumor; AGC, advanced gastric cancer. |
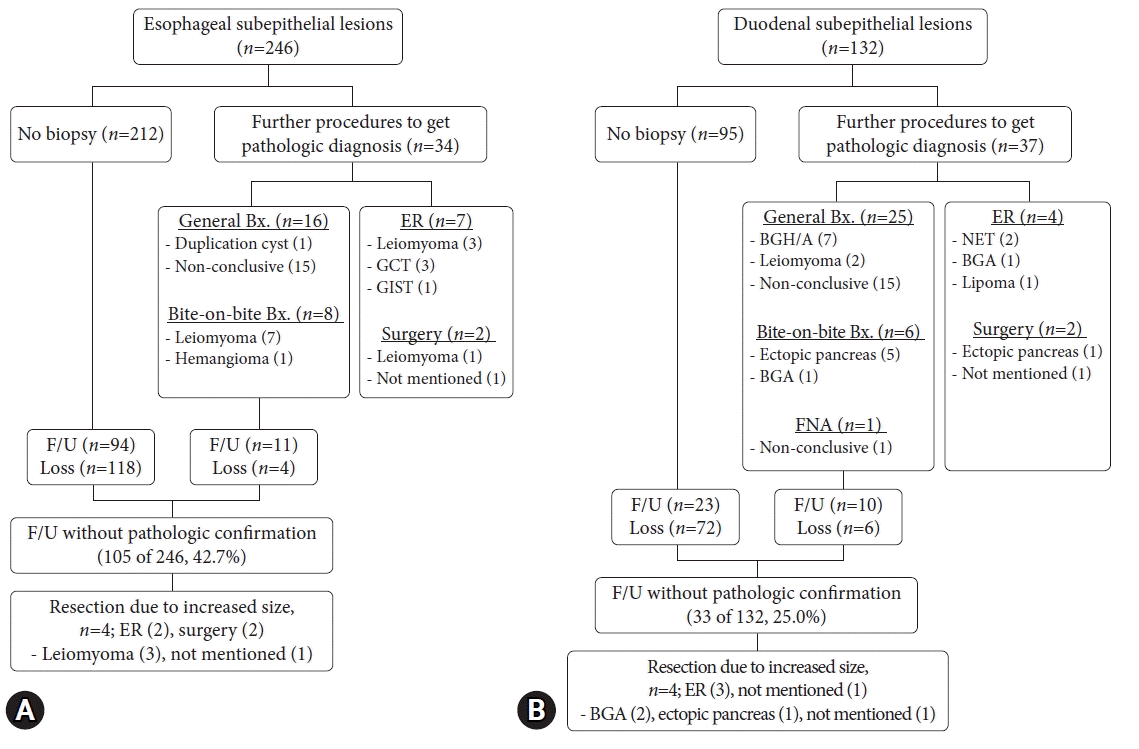 | Fig. 4.Clinical practice and natural course of (A) esophageal and (B) duodenal subepithelial lesions. Bx., biopsy; ER, endoscopic resection; GCT, granular cell tumor; GIST, gastrointestinal stromal tumor; F/U, follow-up; BGA, Brunner’s gland adenoma; BGH, Brunner’s gland hyperplasia; NET, neuroendocrine tumor; FNA, fine needle aspiration. |


 PDF
PDF Citation
 Print
Print


 XML Download