Journal List > Diabetes Metab J > v.47(6) > 1516084732

Moon, Park, Kim, Chung, Won, Han, Park, Won, Kim, Koh, Kim, Yu, Hong, Lee, and Yoon: Efficacy and Safety of Evogliptin Add-on Therapy to Dapagliflozin/Metformin Combinations in Patients with Poorly Controlled Type 2 Diabetes Mellitus: A 24-Week Multicenter Randomized Placebo-Controlled Parallel-Design Phase-3 Trial with a 28-Week Extension

Abstract

Background

This study investigates the long-term efficacy and safety of evogliptin add-on therapy in patients with inadequately controlled type 2 diabetes mellitus (T2DM) previously received dapagliflozin and metformin (DAPA/MET) combination.

Methods

In this multicenter randomized placebo-controlled phase 3 trial, patients with glycosylated hemoglobin (HbA1c) levels 7.0% to 10.5% (n=283) previously used DAPA 10 mg plus MET (≥1,000 mg) were randomly assigned to the evogliptin 5 mg once daily or placebo group (1:1). The primary endpoint was the difference in the HbA1c level from baseline at week 24, and exploratory endpoints included the efficacy and safety of evogliptin over 52 weeks (trial registration: ClinicalTrials.gov NCT04170998).

Results

Evogliptin add-on to DAPA/MET therapy was superior in HbA1c reduction compared to placebo at weeks 24 and 52 (least square [LS] mean difference, –0.65% and –0.55%; 95% confidence interval [CI], –0.79 to –0.51 and –0.71 to –0.39; P<0.0001). The proportion of patients achieving HbA1c <7% was higher in the triple combination group at week 52 (32.14% vs. 8.51% in placebo; odds ratio, 5.62; P<0.0001). Evogliptin significantly reduced the fasting glucose levels and mean daily glucose levels with improvement in homeostatic model assessment of β-cell function (LS mean difference, 9.04; 95% CI, 1.86 to 16.21; P=0.0138). Adverse events were similar between the groups, and no serious adverse drug reactions were reported in the evogliptin group.

Conclusion

Long-term triple combination with evogliptin added to DAPA/MET showed superior HbA1c reduction and glycemic control compared to placebo at 52 weeks and was well tolerated.

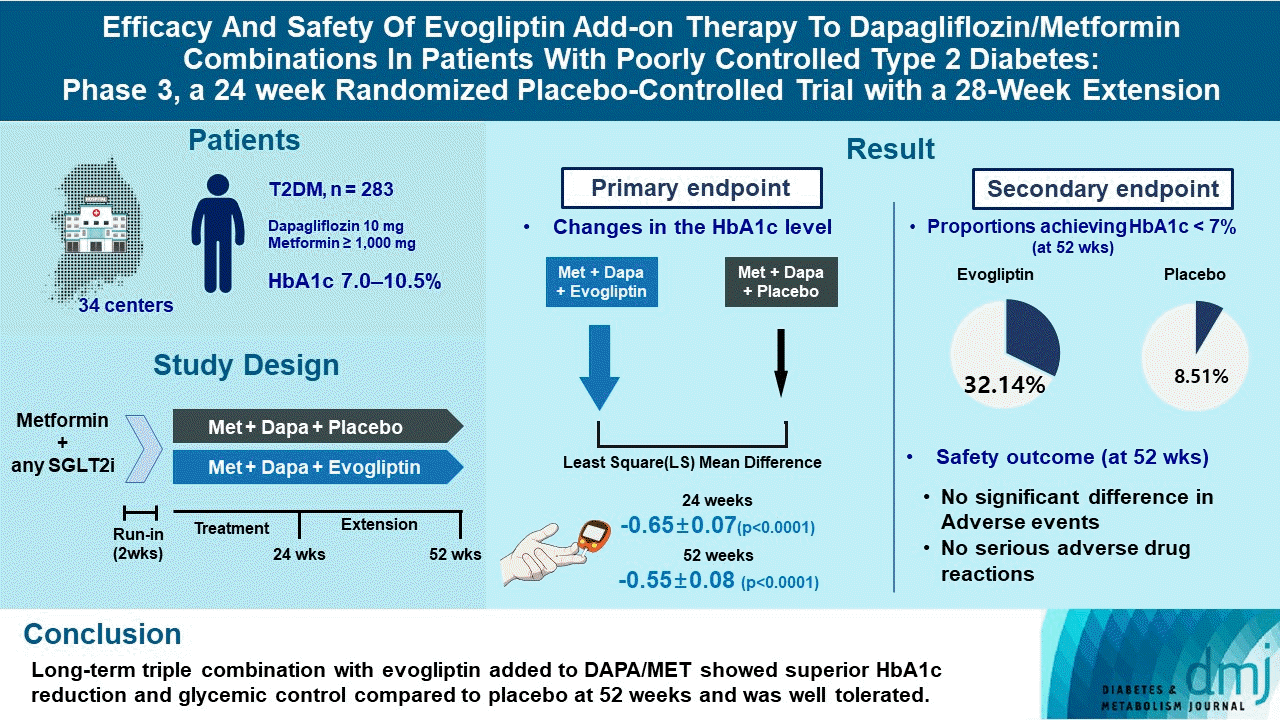
GRAPHICAL ABSTRACT

INTRODUCTION

Type 2 diabetes mellitus (T2DM) is an increasingly prevalent global health challenge that affected more than 500 million adults in 2021 [1]. Diabetes is a progressive chronic disease and leads to various vascular complications such as retinopathy, peripheral neuropathy, renal failure, or cardiovascular diseases. To prevent these tragic courses, strict and earlier glycemic control has shown significant benefits in mitigating diabetic complications [2], including overall mortality [3]. However, despite newly developed glucose-lowering agents with novel modes of action for a decade, it remains still difficult to achieve the glycemic targets in real-world settings [4]. Earlier combination therapy is an emerging strategy to provide a long-lasting therapeutic option for patients with T2DM [5]; however, add-on therapy should be immediately considered if glycemic target level is not reached. Synergism with diverse pharmacologic actions could treat complicated pathophysiology of T2DM while simultaneously compensating for side effects [6,7].
Recently, dapagliflozin (DAPA), a first-in-class sodium-glucose cotransporter 2 (SGLT2) inhibitor became a mandatory prescription for T2DM patients with atherosclerotic cardiovascular disease, heart failure, or chronic kidney disease [8-10]. SGLT2 inhibitors improved hyperglycemia without stimulating insulin secretion, which led to increased β-cell function, reduced insulin resistance, and weight loss [10]. However, some studies have shown that SGLT2 inhibitors paradoxically increase endogenous glucose production with glucagon secretion [11,12].
Evogliptin, a novel dipeptidyl peptidase 4 (DPP4) inhibitor, is more commonly used in clinical practice for its potent glucose-lowering effects without any serious adverse events, especially on glycemic variability in patients with T2DM [13]. DPP4 inhibitors increase active plasma glucagon-like peptide 1 (GLP-1) levels, resulting in not only increased insulin secretion but also suppressed glucagon secretion from the α-cell. Thus, in cases of treatment failure after DAPA and metformin (MET) combination therapy, DPP4 inhibitor add-on treatment may have synergism with complementary actions [14-16].
Based on this hypothesis, we evaluated the glycemic efficacy and safety of evogliptin add-on therapy for 24 and 52 weeks in patients with inadequately controlled T2DM from DAPA/MET therapy.

METHODS

Study participants

The eligible patients were those aged ≥19 years with T2DM treated with combination therapy of DAPA/MET or other SGLT2 inhibitors for at least 8 weeks. Patients with glycosylated hemoglobin (HbA1c) levels between 7.0% and 10.5%, fasting plasma glucose (FPG) levels less than 270 mg/dL, and body mass index (BMI) between 18.5 and 40 kg/m2 were recruited in this trial. Full inclusion and exclusion criteria of this trial are listed in the ‘Inclusion/exclusion criteria’ of Supplementary Methods. This study was conducted in accordance with the ethical principles of the Declaration of Helsinki, Good Clinical Practice, and the study protocol. The study was approved by the Institutional Review Boards of Yeungnam University Hospital (IRB no. 2019-09-046-045) and each participating center. Participants were those who signed a written informed consent and agreed to participate in the trial after fully understanding the detailed explanation of this study.

Study design and procedure

This was a multicenter randomized double-blind placebo-controlled parallel phase 3 clinical trial of 24 weeks of treatment and a long-term extension period of 28 weeks (ClinicalTrials. gov NCT04170998).
All participants maintained with a stable dose of DAPA 10 mg and MET ≥1,000 mg/day during run-in period. After a run-in period, eligible individuals were randomly assigned in a 1:1 ratio to receive oral evogliptin (5 mg) or placebo once daily. These medications were added to the DAPA/MET combination for 24 weeks. Patients who provided written informed consent participated in the 28 weeks of site and patient blind extension treatment periods. The ‘Safety set’ included subjects who have administrated the investigational product at least once after randomization and whose safety-related data have been evaluated at least once after administration.

Endpoints

The primary efficacy endpoint was the change in the HbA1c level (%) from the baseline after 24 weeks. The key secondary endpoint was the change in the HbA1c levels (%) from the baseline after 52 weeks. Some patients achieved HbA1c <7% and <6.5% at weeks 24 and 52, respectively, showing changes in FPG levels, mean daily glucose (MDG) levels, and postprandial glucose (PPG) levels at 2 hours after breakfast/lunch/dinner from the baseline to weeks 24 and 52. Other secondary endpoints are listed in the ‘Secondary endpoints’ of Supplementary Methods.
The safety outcome reported during the clinical trial period included treatment-emergent adverse event, adverse drug reaction (ADR), serious adverse event, serious ADR, and adverse event of special interest (AESI). Laboratory assessment included hematology, blood chemistry, urinalysis, and electrocardiography (ventricular rate, PR interval, QRS, QT/QTc) for each treatment group during the main trial and the extension period.

Statistical analysis

Given the primary efficacy endpoint, the difference between the evogliptin group compared with placebo group was assumed to be 0.35, and the standard deviation of each group was assumed to be 0.8. Assuming randomization at a 1:1 ratio with a 90% power at a 0.05% level of significance, 110 participants were required for each group. A total of 276 participants, 138 in each group, were enrolled to account for the 20% dropout rate.
Efficacy analyses were based on the full analysis set population, which consisted of all randomized patients who received at least one dose of the study medication and had a baseline measurement and at least one post-baseline measurement. The mixed effect model repeated measure (MMRM) analysis was performed to evaluate the superiority of evogliptin compared with the placebo in the primary efficacy endpoint (the change in the HbA1c level [%] after 24 weeks). The MMRM included the treatment group, the visit, the interaction between the treatment group and the visit, and severity (less than/greater than or equal to 8.0% of HbA1c level), which was a stratification factor, as fixed effects.
For the analysis of secondary efficacy endpoints, the MMRM and generalized linear mixed model (logistic GLMM) were constructed, or an analysis of covariance (ANCOVA) was performed.
The analysis model was evaluated using least square (LS) mean difference between treatment groups. The 95% confidence interval (CI) and P value corresponding to the LS mean and standard error (SE) of each treatment group and the LS mean difference between the treatment groups were presented. Furthermore, odds ratio, SE, 95% CI, and P value were presented as analysis results.
Safety analysis for comparison of incidence rates between treatment groups was performed using the chi-square test or Fisher’s exact test. All statistical analyses were conducted using SAS version 9.4 (SAS Institute, Cary, NC, USA).

RESULTS

Demographic characteristics of participants

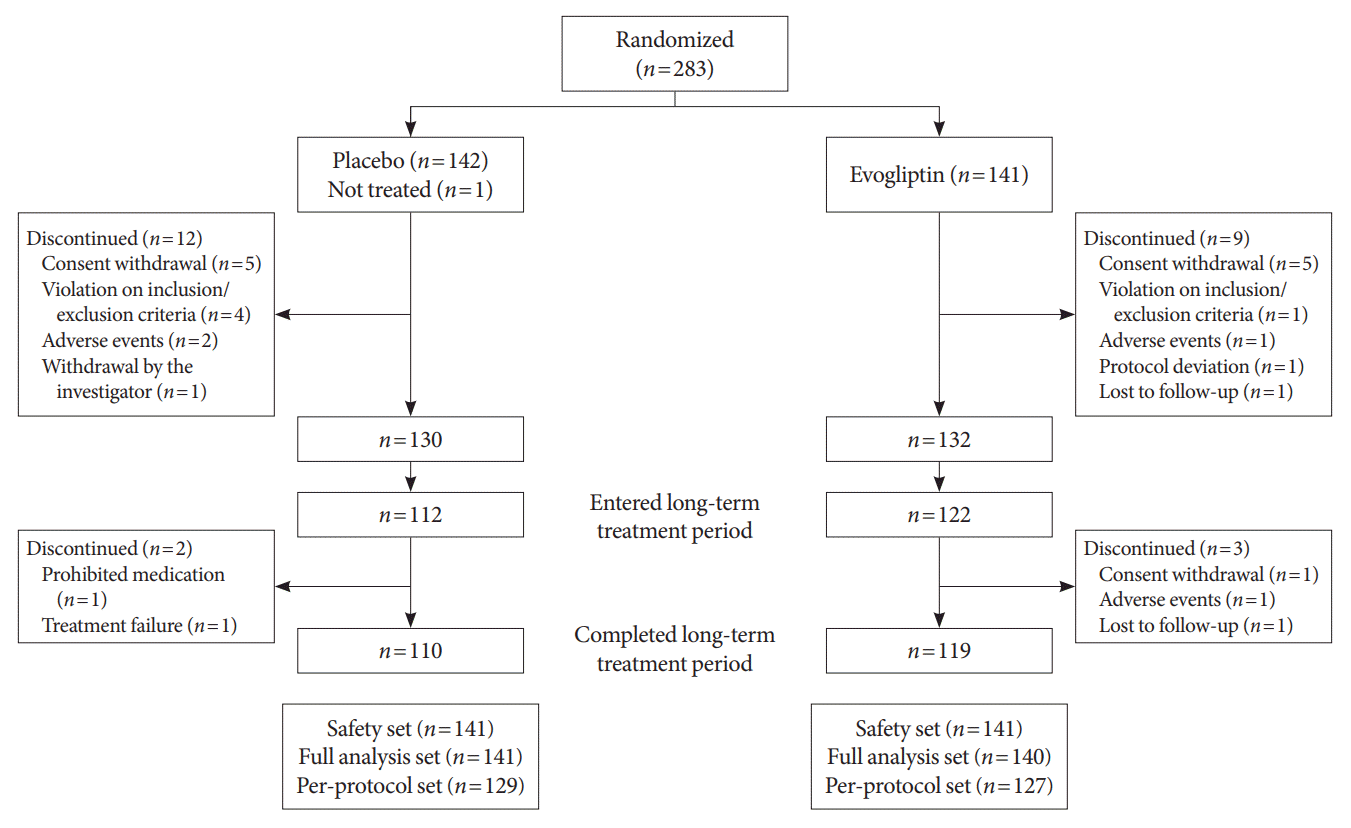
The study disposition is summarized in Fig. 1. The trials were conducted in 34 centers of South Korea with 333 screened patients and 283 randomized patients (142 participants in the placebo group and 141 participants in the evogliptin group). In this study, 262 (92.58%) participants completed the main 24 weeks of the study, while 21 (7.42%) participants were discontinued (12 in the placebo group and nine in the evogliptin group). Among the 283 randomized participants, 234 were in the 28-week extension study (112 in the placebo group and 122 in the evogliptin group). Overall, 110 participants in the placebo group and 119 participants in the evogliptin group completed the 52-week trial.
The baseline demographics of the participants were similar between the two groups (Table 1) The mean age of the participants was 56.65 years, 59.72% of which were males (n=169). The mean body weight and BMI at baseline were 70.91 kg and 25.93 kg/m2, respectively. The average disease duration of T2DM was 10.29 years. The mean HbA1c level was 7.91%, and the mean estimated glomerular filtration rate was 93.05 mL/min/ 1.73 m2.

Primary efficacy endpoint

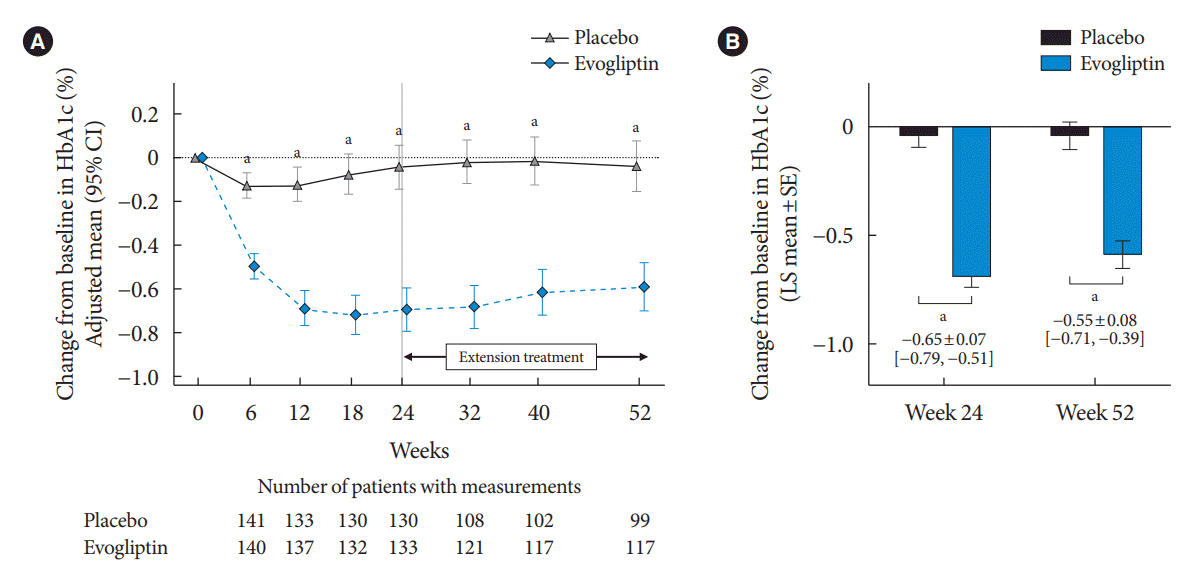
Evogliptin treatment significantly decreased HbA1c levels at week 24 compared with the baseline (LS mean±SE, –0.69%±0.05%) and was superior compared to placebo (–0.04%±0.05%). The LS mean difference between the two groups at 24 weeks was –0.65±0.07 (95% CI, –0.79 to –0.51) (P<0.0001) (Fig. 2).

Secondary efficacy endpoint

Glucose-lowering effects of evogliptin were maintained in the 28-week extension period. The LS mean change (±SE) in HbA1c levels compared with the baseline was –0.59%±0.06% in the evogliptin group and –0.04%±0.06% in the placebo group at week 52. The LS mean difference between the two groups at 52 weeks was –0.55±0.08 (95% CI, –0.71 to –0.39; P<0.0001) (Fig. 2).
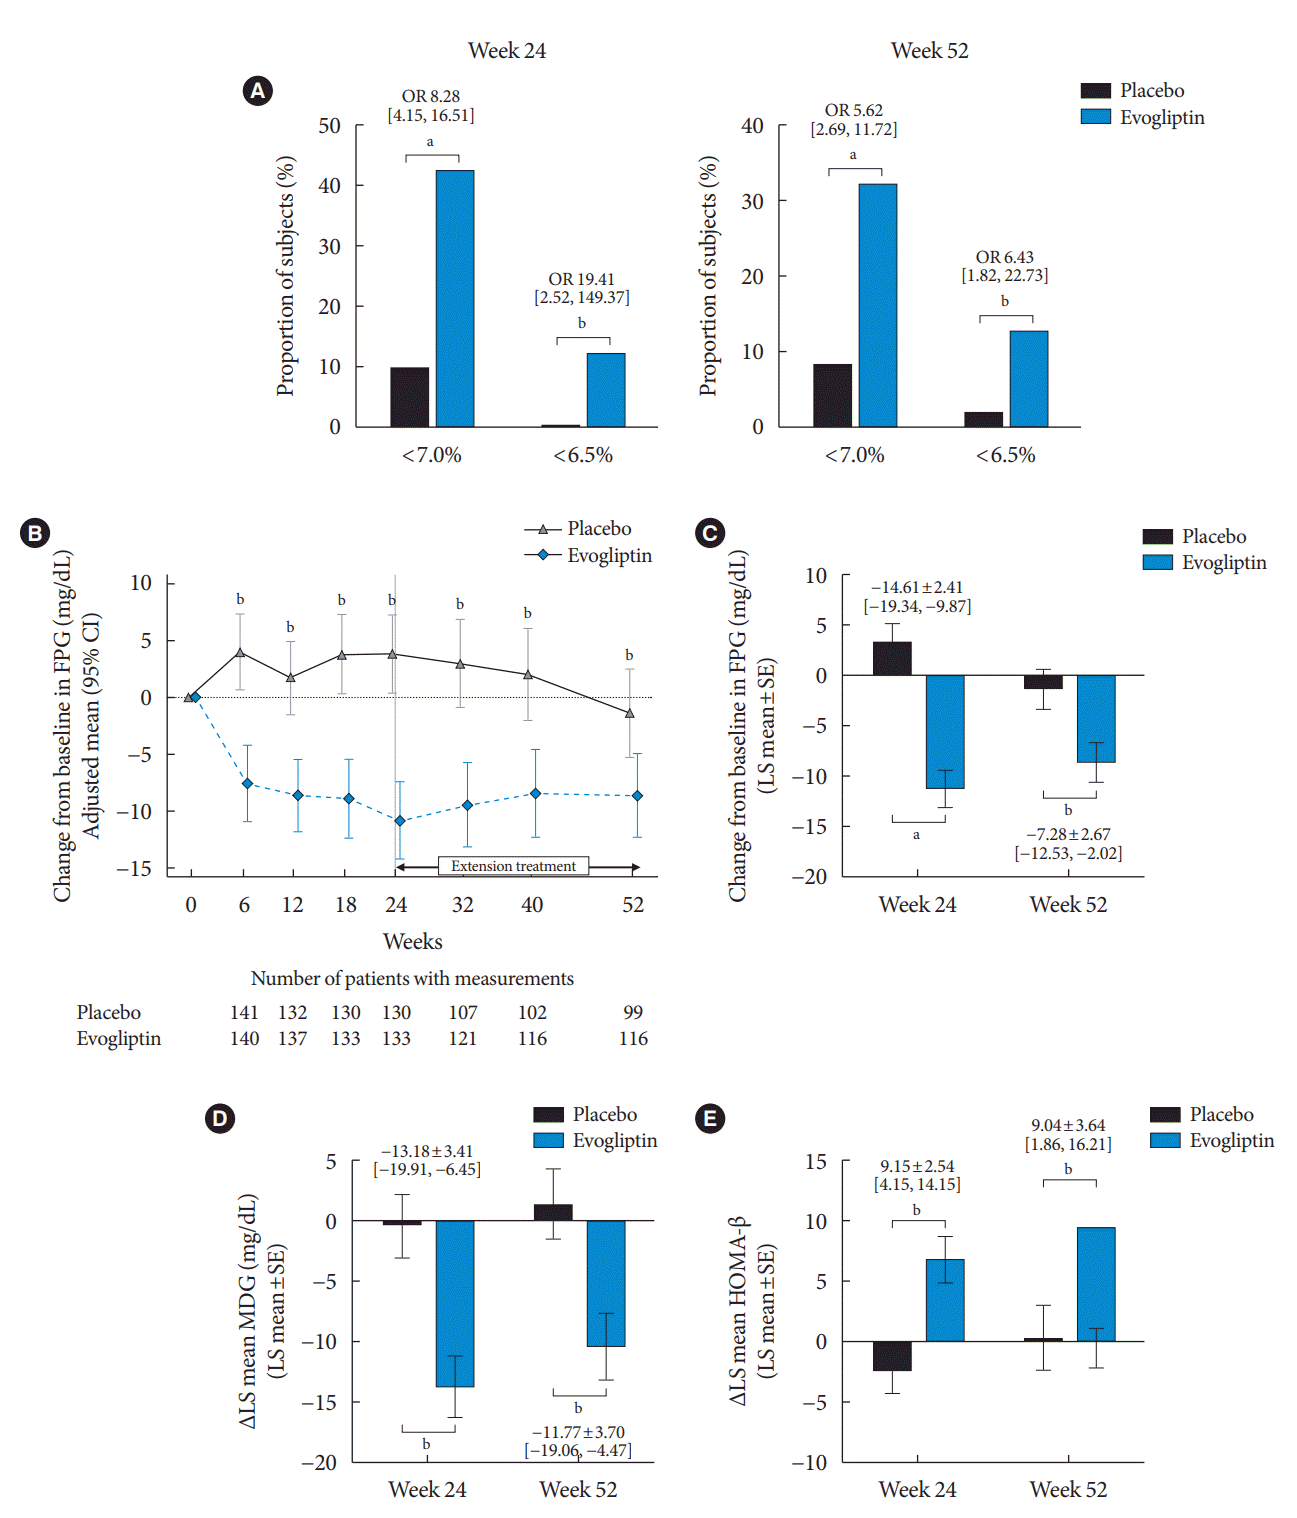
The proportion of participants who achieved HbA1c <7% and <6.5% was significantly higher in the evogliptin group than in the placebo group at weeks 24 and 52 (Fig. 3A). The FPG and PPG effect at 2 hours (except for at breakfast; P=0.0519) also significantly differed between the evogliptin and placebo groups. The LS mean FPG level in the evogliptin group significantly decreased to –11.30±1.72 at week 24 and –8.66± 1.86 at week 52, while the LS mean FPG level in the placebo group changed minimally compared with the baseline (Fig. 3B). The LS mean difference for the change of the FPG level between the two groups was –14.61±2.41 (95% CI, –19.34 to –9.87; P<0.0001) at week 24 and –7.28±2.67 (95% CI, –12.53 to –2.02; P=0.0069) at week 52 (Fig. 3C). Evogliptin treatment was also superior to placebo for reduction in the MDG levels during the study period. The LS mean differences between the groups at weeks 24 and 52 were –13.18±3.41 (95% CI, –19.91 to –6.45; P=0.0002) and –11.77±3.70 (95% CI, –19.06 to –4.47; P=0.0017), respectively (Fig. 3D).
Among exploratory indexes related with glucose metabolism, evogliptin treatment improved homeostatic model assessment of β-cell function (HOMA-β) as an insulin secretory function index during the entire study period, whereas almost no changes were seen in the placebo group (Fig. 3E). However, there were no differences in HOMA-insulin resistance, quantitative insulin sensitivity check index (QUICKI), and glucagon levels between the two groups at weeks 24 and 52. Additional and detailed efficacy endpoints are provided in the Supplementary Table 1.

Safety outcomes

Table 2 summarizes the safety outcomes in this study. Safety analysis was performed on the ‘Safety set,’ and 282 subjects (141 in the placebo group, 141 in the evogliptin group) were included. During the main and extension studies, most adverse events were mild or moderate in both groups. The rates of ADRs during the 52-week treatment in both groups were 2.84%. There was no serious ADR, while those observed did not lead to discontinuation during the trial.
The hypoglycemia developed during the 52-week study period was asymptomatic hypoglycemia, which occurred as a single event in one participant of each group (0.71%) (Table 2). The rates of AESI were also the same (2.84%), and arthralgia and increased lipase levels were observed in both groups. The event numbers for treatment-emergent adverse events/AESIs and details of AESI was described in the Supplementary Table 2.

DISCUSSION

In this study, compared with placebo, evogliptin add-on treatment showed a significant HbA1c reduction at 52 weeks in poorly controlled T2DM patients using DAPA/MET. Secondary efficacy outcomes such as FPG, PPG, and MDG levels measured through 7-point self-monitoring blood glucose were also significantly improved. The proportion of patients who achieved target HbA1c (<6.5% and 7.0%) was higher in the evogliptin group than in the placebo group. Adding evogliptin was confirmed to be safe, with no differences in any adverse events between groups. These results were attributed to the improvement of β-cell function after 52 weeks of evogliptin treatment compared with placebo treatment.
When combination therapy with SGLT2 inhibitors and MET failed to achieve the target glycemic goal, current guidelines recommended to promptly initiate add-on therapy for preventing clinical inertia [17]. Many considerations such as glucose-lowering potency, weight changes, and the risk of hypoglycemia should be required for optimal “patient-centered” decision in this sequence. Among the oral hypoglycemic agents, DPP4 inhibitors are an attractive option for its additive and complementary actions to SGLT-2 inhibitors [7,18]. Since the glucose-lowering effects of SGLT2 inhibitors do not interact with drugs that improve β-cell function or insulin sensitivity, combination therapy might result in additive efficacy. DPP4 inhibitors improve pancreatic β-cell function and post-prandial hyperglycemia [13,19]. Evogliptin has consistently shown potent glycemic efficacy as mono- and combination therapy and was confirmed with a continuous monitoring system to significantly reduce glycemic variability [13]. This study also confirmed that an additive benefit of evogliptin was attributed to the improvement of HOMA-β, a surrogate marker of β-cell function. Therefore, evogliptin with SGLT2 inhibitors has potential benefits on both the durable glycemic control and cardiovascular-renal complications [16,20].
Evogliptin was a safe option as a third combination after DAPA/MET treatment failed. No serious ADRs were observed, and ADRs considered to have a causal relationship with evogliptin occurred in only four participants (2.84%) over 52 weeks. One case was reported as hypoglycemia and others reported as abnormal lipase levels. All these reported drug-related adverse events were mild or moderate and did not cause discontinuation of evogliptin. A few cases of acute pancreatitis associated with the use of DPP4 inhibitors were reported, revealing that DPP4 inhibitors should not be restarted, despite insufficient data of a causal relationship. In this study, two asymptomatic cases with mildly elevated lipase levels were reported in the evogliptin group, but no pancreatitis was reported, which does not suggest that T2DM patients with evogliptin require a lipase screening test. It is important to monitor patients with symptoms or a history of acute pancreatitis [21].
A change in was observed in glucagon levels following treatment, contrary to what we expected; however, there was no statistical difference between the groups.
When participants were categorized according to the baseline HbA1c level, glucagon levels were also similar in both groups from subgroup analysis (data not shown). It was hypothesized that disadvantages of SGLT2 inhibitors such as increased caloric intake and hepatic glucose production (HGP) might be mitigated by incretin-based treatment. SGLT2 inhibitors induce glycosuria by inhibiting glucose reabsorption in the renal proximal tubule [22,23]. This mechanism reduces blood glucose levels and decreases insulin levels followed by an increase in glucagon levels [12]. Theoretically, DPP4 inhibitor can act complementary to the SGLT2 inhibitor by reducing glucagon levels, but we did not find significant reductions of glucagon levels by evogliptin add-on compared with placebo. Paradoxical increases in HGP and glucagon levels have been reported in studies on short-term SGLT2 inhibitor treatment for few weeks or even several hours. However, little is known regarding the glucagon changes after long-term treatment of at least 24 weeks or more [11,24]. In addition, the active GLP-1 levels-within the physiologic range- might not be sufficient to suppress α-cell activity after DPP4 inhibition. We did not determine glucagon levels in early phases (days to weeks), but the glucagon suppression effect of evogliptin may be dominant in the early phase after add-on; thus, further studies are required.
Despite of clinical relevance of the current study, our study has a few limitations. First, this study was conducted only with Korean patients, and the generalization of the results of this study to other ethnic groups may be limited. Especially, the glycemic efficacy of DPP4 inhibitors was shown greater in Asian than in other ethnicity [25], it might be different from evogliptin efficacy in other countries. In addition, the long-term effects and safety of more than 1 year cannot be guaranteed. However, our study has the strength to show the mechanisms of triple combination or evogliptin add-on therapy in poorly controlled T2DM patients.
In conclusion, evogliptin add-on therapy to DAPA/MET combination therapy showed a superior HbA1c reduction effect compared with that of placebo treatment without causing adverse events in patients with T2DM, demonstrating a good alternative combination therapy for patients with poor glycemic control.

SUPPLEMENTARY MATERIALS

Supplementary materials related to this article can be found online at https://doi.org/10.4093/dmj.2022.0387.
Supplementary Table 1.
Results of secondary endpoints
dmj-2022-0387-Supplementary-Table-1.pdf
Supplementary Table 2.
Summary of TEAEs/AESIs and incidence of AESIs by system organ class and preferred term
dmj-2022-0387-Supplementary-Table-2.pdf

Notes

CONFLICTS OF INTEREST

Kyu Chang Won has been honorary editor of the Diabetes & Metabolism Journal since 2020. Jun Sung Moon has been associate editor of the Diabetes & Metabolism Journal since 2022. They were not involved in the review process of this article. Otherwise, there was no conflict of interest.

AUTHOR CONTRIBUTIONS

Conception or design: K.C.W., K.H.Y.

Acquisition, analysis, or interpretation of data: J.S.M., H.J.K., C.H.C., K.C.W., K.A.H., C.Y.P., J.C.W., D.J.K., G.P.K., E.S.K., J.M.Y., E.G.H., C.B.L., K.H.Y.

Drafting the work or revising: J.S.M., I.R.P.

Final approval of the manuscript: all authors.

FUNDING

This study was supported by Dong-A ST Co. Ltd., Seoul, Republic of Korea. The sponsor participated in the study design, data collection, and analysis of the data. The sponsor had no role in writing the manuscript and in the decision to submit the manuscript for publication.

ACKNOWLEDGMENTS

We thank the other investigators for their cooperation in this study. The list of the other investigators in this study is as follows: Sung Rae Kim (Department of Internal Medicine, Bucheon St. Mary’s Hospital, College of Medicine, The Catholic University of Korea, Bucheon, Korea), In Kyung Jeong (Department of Internal Medicine, Kyung Hee University Hospital at Gangdong, Seoul, Korea), Seung Joon Oh (Department of Internal Medicine, Kyung Hee University Hospital, Seoul, Korea), Ho Chan Cho (Department of Internal Medicine, Keimyung University Dongsan Hospital, Daegu, Korea), Nan Hee Kim (Department of Internal Medicine, Korea University Ansan Hospital, Ansan, Korea), Ji Hyun Lee (Department of Internal Medicine, Daegu Catholic University Medical Center, Daegu, Korea), In Joo Kim (Department of Internal Medicine, Pusan National University Hospital, Busan, Korea), Chang Won Lee (Department of Internal Medicine, Busan St. Mary’s Hospital, Busan, Korea), Soo Lim (Department of Internal Medicine, Seoul National University Bundang Hospital, Seongnam, Korea), Jae Hyeon Kim (Department of Internal Medicine, Samsung Medical Center, Seoul, Korea), Eun Seok Kang (Department of Internal Medicine, Severance Hospital, Yonsei University College of Medicine, Seoul, Korea), Chong Hwa Kim (Department of Internal Medicine, Bucheon Sejong Hospital, Bucheon, Korea), Mi Kyung Kim (Department of Internal Medicine, Inje University Haeundae Paik Hospital, Busan, Korea), Sang Yong Kim (Department of Internal Medicine, Chosun University Hospital, Gwangju, Korea), Bon Jeong Ku (Department of Internal Medicine, Chungnam National University Hospital, Daejeon, Korea), Sin Gon Kim (Department of Internal Medicine, Korea University Anam Hospital, Seoul, Korea), Jeong Hyun Park (Department of Internal Medicine, Inje University Busan Paik Hospital, Busan, Korea).

REFERENCES

1. Ogle GD, James S, Dabelea D, Pihoker C, Svennson J, Maniam J, et al. Global estimates of incidence of type 1 diabetes in children and adolescents: results from the international diabetes federation atlas, 10th edition. Diabetes Res Clin Pract. 2022; 183:109083.
crossref
2. UK Prospective Diabetes Study (UKPDS) Group. Intensive blood-glucose control with sulphonylureas or insulin compared with conventional treatment and risk of complications in patients with type 2 diabetes (UKPDS 33). Lancet. 1998; 352:837–53.
3. Holman RR, Paul SK, Bethel MA, Matthews DR, Neil HA. 10- Year follow-up of intensive glucose control in type 2 diabetes. N Engl J Med. 2008; 359:1577–89.
crossref
4. Bae JH, Han KD, Ko SH, Yang YS, Choi JH, Choi KM, et al. Diabetes fact sheet in Korea 2021. Diabetes Metab J. 2022; 46:417–26.
crossref
5. Phung OJ, Sobieraj DM, Engel SS, Rajpathak SN. Early combination therapy for the treatment of type 2 diabetes mellitus: systematic review and meta-analysis. Diabetes Obes Metab. 2014; 16:410–7.
crossref
6. Zaccardi F, Dhalwani NN, Dales J, Mani H, Khunti K, Davies MJ, et al. Comparison of glucose-lowering agents after dual therapy failure in type 2 diabetes: a systematic review and network meta-analysis of randomized controlled trials. Diabetes Obes Metab. 2018; 20:985–97.
crossref
7. Ko SH, Hur KY, Rhee SY, Kim NH, Moon MK, Park SO, et al. Antihyperglycemic agent therapy for adult patients with type 2 diabetes mellitus 2017: a position statement of the Korean Diabetes Association. Diabetes Metab J. 2017; 41:337–48.
crossref
8. Hong AR, Koo BK, Kim SW, Yi KH, Moon MK. Efficacy and safety of sodium-glucose cotransporter-2 inhibitors in Korean patients with type 2 diabetes mellitus in real-world clinical practice. Diabetes Metab J. 2019; 43:590–606.
crossref
9. Wiviott SD, Raz I, Bonaca MP, Mosenzon O, Kato ET, Cahn A, et al. Dapagliflozin and cardiovascular outcomes in type 2 diabetes. N Engl J Med. 2019; 380:347–57.
crossref
10. Jung CH, Jang JE, Park JY. A novel therapeutic agent for type 2 diabetes mellitus: SGLT2 inhibitor. Diabetes Metab J. 2014; 38:261–73.
crossref
11. Alatrach M, Laichuthai N, Martinez R, Agyin C, Ali AM, AlJobori H, et al. Evidence against an important role of plasma insulin and glucagon concentrations in the increase in EGP caused by SGLT2 inhibitors. Diabetes. 2020; 69:681–8.
crossref
12. Ferrannini E, Muscelli E, Frascerra S, Baldi S, Mari A, Heise T, et al. Metabolic response to sodium-glucose cotransporter 2 inhibition in type 2 diabetic patients. J Clin Invest. 2014; 124:499–508.
crossref
13. Kim G, Lim S, Kwon HS, Park IB, Ahn KJ, Park CY, et al. Efficacy and safety of evogliptin treatment in patients with type 2 diabetes: a multicentre, active-controlled, randomized, doubleblind study with open-label extension (the EVERGREEN study). Diabetes Obes Metab. 2020; 22:1527–36.
14. Lewin A, DeFronzo RA, Patel S, Liu D, Kaste R, Woerle HJ, et al. Initial combination of empagliflozin and linagliptin in subjects with type 2 diabetes. Diabetes Care. 2015; 38:394–402.
crossref
15. Li D, Shi W, Wang T, Tang H. SGLT2 inhibitor plus DPP-4 inhibitor as combination therapy for type 2 diabetes: a systematic review and meta-analysis. Diabetes Obes Metab. 2018; 20:1972–6.
crossref
16. Scheen AJ. DPP-4 inhibitor plus SGLT-2 inhibitor as combination therapy for type 2 diabetes: from rationale to clinical aspects. Expert Opin Drug Metab Toxicol. 2016; 12:1407–17.
crossref
17. Lee CM, Woodward M, Colagiuri S. Triple therapy combinations for the treatment of type 2 diabetes: a network meta-analysis. Diabetes Res Clin Pract. 2016; 116:149–58.
18. Lee JY, Cho Y, Lee M, Kim YJ, Lee YH, Lee BW, et al. Predictors of the therapeutic efficacy and consideration of the best combination therapy of sodium-glucose co-transporter 2 inhibitors. Diabetes Metab J. 2019; 43:158–73.
crossref
19. Olansky L, Reasner C, Seck TL, Williams-Herman DE, Chen M, Terranella L, et al. A treatment strategy implementing combination therapy with sitagliptin and metformin results in superior glycaemic control versus metformin monotherapy due to a low rate of addition of antihyperglycaemic agents. Diabetes Obes Metab. 2011; 13:841–9.
crossref
20. van Baar MJ, van Ruiten CC, Muskiet MH, van Bloemendaal L, IJzerman RG, van Raalte DH. SGLT2 inhibitors in combination therapy: from mechanisms to clinical considerations in type 2 diabetes management. Diabetes Care. 2018; 41:1543–56.
crossref
21. Dicembrini I, Montereggi C, Nreu B, Mannucci E, Monami M. Pancreatitis and pancreatic cancer in patients treated with dipeptidyl peptidase-4 inhibitors: an extensive and updated meta-analysis of randomized controlled trials. Diabetes Res Clin Pract. 2020; 159:107981.
22. Ferrannini E, Seman L, Seewaldt-Becker E, Hantel S, Pinnetti S, Woerle HJ. A phase IIb, randomized, placebo-controlled study of the SGLT2 inhibitor empagliflozin in patients with type 2 diabetes. Diabetes Obes Metab. 2013; 15:721–8.
23. Petrykiv S, Laverman GD, de Zeeuw D, Heerspink HJ. Does SGLT2 inhibition with dapagliflozin overcome individual therapy resistance to RAAS inhibition? Diabetes Obes Metab. 2018; 20:224–7.
24. Merovci A, Solis-Herrera C, Daniele G, Eldor R, Fiorentino TV, Tripathy D, et al. Dapagliflozin improves muscle insulin sensitivity but enhances endogenous glucose production. J Clin Invest. 2014; 124:509–14.
crossref
25. Kim YG, Hahn S, Oh TJ, Kwak SH, Park KS, Cho YM. Differences in the glucose-lowering efficacy of dipeptidyl peptidase-4 inhibitors between Asians and non-Asians: a systematic review and meta-analysis. Diabetologia. 2013; 56:696–708.
crossref

Fig. 1.
Patient disposition.
dmj-2022-0387f1.tif
Fig. 2.
Primary endpoint as change in the glycosylated hemoglobin (HbA1c) level. Time course of adjusted mean change in the HbA1c level from the baseline (A) and adjusted mean change in the HbA1c level from baseline to weeks 24 and 52 (B). Data expressed as mean and 95% confidence interval (CI). SE, standard error. aP<0.0001 between evogliptin and placebo.
dmj-2022-0387f2.tif
Fig. 3.
Secondary endpoint. Proportion of glycemic achievement at week 52 (A), time course of adjusted mean change in the fasting plasma glucose (FPG) level from baseline (B), adjusted mean change in the FPG level from baseline to week 52 (C), adjusted mean change in the mean daily glucose (MDG) level (D) and homeostatic model assessment of β-cell function (HOMA-β) from baseline to week 52 (E). (B) Data expressed as mean and 95% confidence interval (CI). OR, odds ratio; SE, standard error. aP<0.0001, bP<0.01 between placebo and evogliptin.
dmj-2022-0387f3.tif
dmj-2022-0387f4.tif
Table 1.
Baseline demographics and characteristics (randomized set)
Variable Total (n=283) Placebo (n=142) Evogliptin (n=141)
Sex
Male 169 (59.72) 91 (64.08) 78 (55.32)
Female 114 (40.28) 51 (35.92) 63 (44.68)
Age, yr 56.65±9.86 58.15±9.40 55.13±10.11
<65 218 (77.03) 105 (73.94) 113 (80.14)
≥65 65 (22.97) 37 (26.06) 28 (19.86)
Height, cm 165.08±8.58 164.86±8.04 165.31±9.12
Body weight, kg 70.91±12.20 70.22±12.07 71.60±12.34
BMI, kg/m2 25.93±3.32 25.74±3.31 26.12±3.33
≤25 120 (42.40) 62 (43.66) 58 (41.13)
>25 163 (57.60) 80 (56.34) 83 (58.87)
Duration of diabetes, yr 10.29±5.76 10.96±5.62 9.61±5.84
Duration of concomitant therapy with metformin and SGLT-2 inhibitors, wk 43.50±48.20 37.22±34.58 49.82±58.28
Metformin dosage, mg/day 1,397.00±418.82 1,409.86±426.39 1,384.04±412.17
Dyslipidemia medication
Yes 224 (79.15) 117 (82.39) 107 (75.89)
No 59 (20.85) 25 (17.61) 34 (24.11)
HbA1c (%) at screening 7.91±0.74 7.91±0.76 7.91±0.72
 <8.0 182 (64.31) 91 (64.08) 91 (64.54)
 ≥8.0 101 (35.69) 51 (35.92) 50 (35.46)
eGFR, mL/min/1.73 m2 93.05±19.50 91.99±20.08 94.12±18.91
 ≥90 154 (54.42) 69 (48.59) 85 (60.28)
 60 to <90 119 (42.05) 68 (47.89) 51 (36.17)
 45 to <60 9 (3.18) 4 (2.82) 5 (3.55)
FPG, mg/dL 145.21±24.92 144.03±25.06 146.38±24.81

Values are presented as number (%) or mean±standard deviation.

BMI, body mass index; SGLT-2, sodium-glucose cotransporter 2; HbA1c, glycosylated hemoglobin; eGFR, estimated glomerular filtration rate; FPG, fasting plasma glucose.

Table 2.
Safety outcomes
Variable Placebo (n=141) Evogliptin (n=141) P value
TEAEs
 24 weeks 32 (22.70) 39 (27.66) 0.4105
 52 weeks 48 (34.04) 50 (35.46) 0.9005
Adverse drug reaction
 24 weeks 4 (2.84) 3 (2.13) 1.0000
 52 weeks 4 (2.84) 4 (2.84) 1.0000
Serious adverse events
 24 weeks 6 (4.26) 5 (3.55) 1.0000
 52 weeks 7 (4.96) 8 (5.67) 1.0000
Serious adverse drug reaction
 24 weeks 0 0 -
 52 weeks 0 0 -
AESI
 24 weeks 3 (2.13) 4 (2.84) 1.0000
 52 weeks 4 (2.84) 4 (2.84) 1.0000
Hypoglycemia, asymptomatic
 24 weeks 1 (0.71) 1 (0.71) 1.0000
 52 weeks 1 (0.71) 1 (0.71) 1.0000

Values are presented as number (%). Difference between treatment groups was analyzed using the Fisher's exact test.

TEAE, treatment-emergent adverse event; AESI, adverse event of special interest.

TOOLS
Similar articles