Abstract
Background
Methods
Results
SUPPLEMENTARY MATERIALS
Supplementary Table 1.
Supplementary Table 4.
Supplementary Table 5.
Supplementary Table 6.
Supplementary Table 7.
Notes
CONFLICTS OF INTEREST
In-Kyung Jeong has been honorary editors of the Diabetes & Metabolism Journal since 2022. She was not involved in the review process of this article. Jae Jin Nah, Hwa Rang Song, Seong In Cho, and Seung-Ah Cho are full-time employees of Daewoong Pharmaceutical, Co. Ltd., the sponsoring company. Kyung Ah Han, Yong Hyun Kim, Doo Man Kim, Byung Wan Lee, Suk Chon, Tae Seo Sohn, In Kyung Jeong, Eun-Gyoung Hong, Jang Won Son, and Kun Ho Yoon declare that they have no competing interests.
REFERENCES
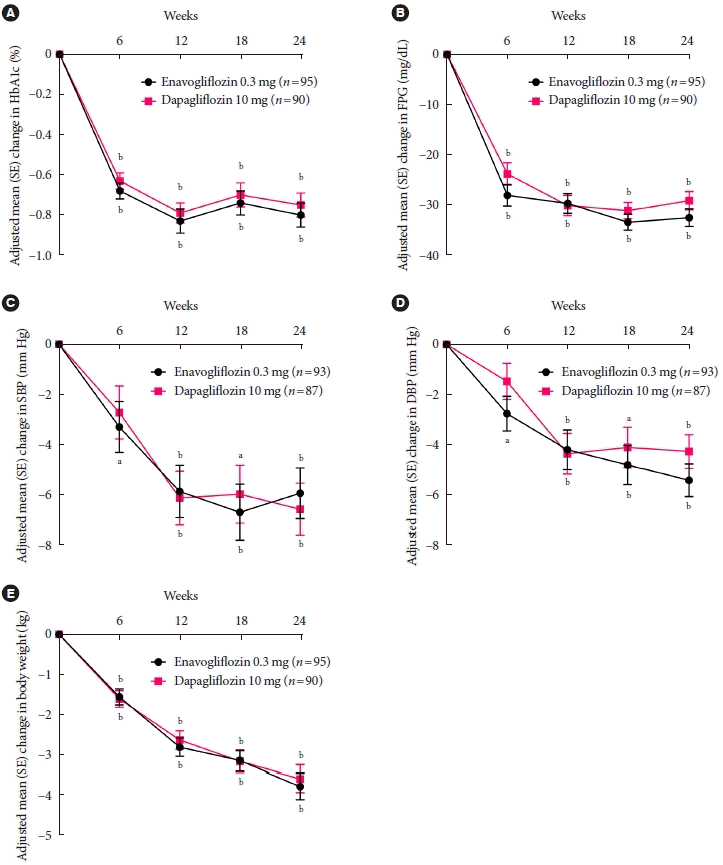
Fig. 2.

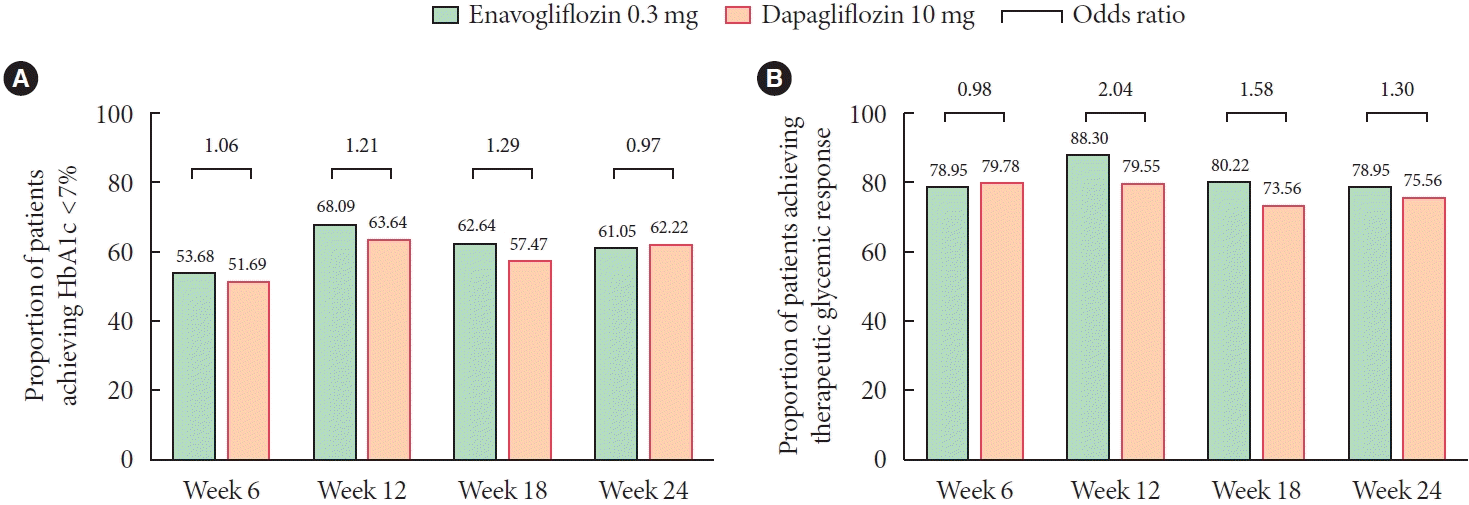
Fig. 3.

Table 1.
| Characteristic | Enavogliflozin 0.3 mg (n=101) | Dapagliflozin 10 mg (n=99) |
|---|---|---|
| Age, yr | 59.03±11.45 | 60.35±10.62 |
| Male sex | 59 (58.42) | 54 (54.55) |
| Body weight, kg | 70.74±11.19 | 69.99±12.09 |
| Body mass index, kg/m2 | 26.45±3.30 | 26.20±3.48 |
| eGFR, mL/min/1.73 m2 | 88.06±15.72a | 94.72±18.75a |
| eGFR <90 mL/min/1.73 m2 | 61 (60.40)b | 46 (46.46)b |
| HbA1c, % | 7.82±0.74 | 7.81±0.74 |
| HbA1c ≥8% | 31 (30.69) | 31 (31.31) |
| FPG, mg/dL | 162.34±32.26 | 156.22±31.99 |
| Duration of diabetes, yr | 8.94±5.96 | 8.18±5.65 |
| Oral antidiabetic drugs | ||
| Metformin alone | 59 (58.42) | 59 (59.60) |
| Add-on therapy to metformin | 42 (41.58) | 40 (40.40) |
| Metformin dose, mg | 1,369.55±399.82 | 1,389.90±450.13 |
Table 2.
| Variable | Enavogliflozin 0.3 mg (n=95) | Dapagliflozin 10 mg (n=90) | ||
|---|---|---|---|---|
| HbA1c, % | ||||
| Baseline | 7.75 (0.82) | 7.68 (0.73) | ||
| Week 24 | 6.98 (0.61) | 6.97 (0.72) | ||
| Change from baseline at week 24 | ||||
| LS mean (SE) | –0.80 (0.06) | –0.75 (0.06) | ||
| LS mean difference (95% CI) | –0.04 (–0.21 to 0.12) | |||
| FPG, mg/dL | ||||
| Baseline | 145.35 (26.60) | 149.33 (31.85) | ||
| Week 24 | 113.58 (17.21) | 117.91 (19.38) | ||
| Change from baseline at week 24 | ||||
| LS mean (SE) | –32.53 (1.76) | –29.14 (1.82) | ||
| LS mean difference (95% CI), P value | –3.38 (–8.15 to 1.39), P=0.1633 | |||
| Systolic blood pressure, mm Hg | ||||
| Baseline | 129.72 (13.64) | 127.44 (14.12) | ||
| Week 24 | 123.38 (12.55) | 121.40 (11.90) | ||
| Change from baseline at week 24 | ||||
| LS mean (SE) | –5.93 (1.01) | –6.57 (1.04) | ||
| LS mean difference (95% CI), P value | 0.63 (–2.13 to 3.39), P=0.6512 | |||
| Diastolic blood pressure, mm Hg | ||||
| Baseline | 77.04 (9.72) | 75.92 (10.50) | ||
| Week 24 | 71.65 (9.39) | 72.05 (8.44) | ||
| Change from baseline at week 24 | ||||
| LS mean (SE) | –5.41 (0.65) | –4.26 (0.67) | ||
| LS mean difference (95% CI), P value | –1.15 (–2.94 to 0.63), P=0.2044 | |||
| Body weight, kg | ||||
| Baseline | 70.17 (11.06) | 70.52 (11.81) | ||
| Week 24 | 66.39 (10.90) | 66.92 (11.89) | ||
| Change from baseline at week 24 | ||||
| LS mean (SE) | –3.77 (0.33) | –3.58 (0.34) | ||
| LS mean difference (95% CI), P value | –0.18 (–1.08 to 0.71), P=0.6840 | |||
| UACR, mg/g | ||||
| Baseline | 38.19 (163.98) | 57.42 (198.64) | ||
| Week 24 | 19.93 (29.10) | 31.37 (76.71) | ||
| Change from baseline at week 24 | ||||
| LS mean (SE) | –24.29 (3.38) | –17.37 (3.48)a | ||
| LS mean difference (95% CI), P value | –6.93 (–16.14 to 2.29), P=0.1399 | |||
| UGCR, g/g | ||||
| Baseline | 1.54 (8.70) | 1.83 (7.49) | ||
| Week 24 | 60.43 (20.76) | 45.27 (20.91) | ||
| Change from baseline at week 24 | ||||
| LS mean (SE) | 60.48 (2.12) | 44.94 (2.18)a | ||
| LS mean difference (95% CI), P value | 15.54 (9.77 to 21.31), P<0.0001 | |||
| HOMA-β | ||||
| Baseline | 45.53 (36.34) | 44.44 (25.03) | ||
| Week 24 | 52.32 (40.75) | 56.67 (38.17) | ||
| Change from baseline at week 24 | ||||
| LS mean (SE) | 6.94 (3.17) | 11.93 (3.25) | ||
| LS mean difference (95% CI), P value | –4.99 (–13.60 to 3.62), P=0.2545 | |||
| HOMA-IR | ||||
| Baseline | 3.45 (3.42) | 3.85 (2.49) | ||
| Week 24 | 1.76 (1.07) | 2.39 (1.67) | ||
| Change from baseline at week 24 | ||||
| LS mean (SE) | –1.85 (0.13) | –1.31 (0.14) | ||
| LS mean difference (95% CI), P value | –0.53 (–0.90 to –0.17), P=0.0041 | |||
Values are presented as the per-protocol set except blood pressure results which were presented with the modified per-protocol set 2.
HbA1c, glycosylated hemoglobin; SE, standard error; CI, confidence interval; FPG, fasting plasma glucose; UACR, urine albumin-creatinine ratio; UGCR, urine glucose-creatinine ratio; HOMA-β, homeostasis model assessment of β-cell function; HOMA-IR, homeostasis model assessment of insulin resistance.
Table 3.
| System organ class (preferred term) | Enavogliflozin 0.3 mg (n=101) | Dapagliflozin 10 mg (n=99) | |
|---|---|---|---|
| Patients with TEAEs | 24 (23.76) [36] | 22 (22.22) [34] | |
| Patients with ADRs | 1 (0.99) [1] | 7 (7.07) [7] | |
| Dyspepsia | 0 | 2 (2.02) [2]a[1],b[1] | |
| Cystitis | 1 (0.99) [1]a | 1 (1.01) [1]b | |
| Hypoglycemia | 0 | 1 (1.01) [1]a | |
| Pollakiuria | 0 | 1 (1.01) [1]a | |
| Vulvovaginal pruritus | 0 | 1 (1.01) [1]a | |
| Pruritus | 0 | 1 (1.01) [1]a | |
| Patients with SAEs | 1 (0.99) [1] | 1 (1.01) [2] | |
| Mechanical ileus | 1 (0.99) [1]c | 0 | |
| Benign prostatic hyperplasia | 0 | 1 (1.01) [1]c | |
| Prostate cancer | 0 | 1 (1.01) [1]c | |


 PDF
PDF Citation
 Print
Print


 XML Download