Abstract
Background
Methods
Results
SUPPLEMENTARY MATERIALS
Supplementary Table 1.
Supplementary Table 2.
Supplementary Table 3.
Notes
AUTHOR CONTRIBUTIONS
Conception or design: D.Y.L., N.K., S.Y.P., J.H.Y., S.M.P., N.H.K. Acquisition, analysis, or interpretation of data: D.Y.L., N.K., J.A.S., J.K., N.H.K., H.J.Y., S.G.K., K.M.C., S.H.B., S.M.P., N.H.K. Drafting the work or revising: D.Y.L., N.K., I.J.
Final approval of the manuscript: S.M.P., N.H.K.
FUNDING
This research was supported by the Bio & Medical Technology Development Program of the National Research Foundation (NRF) (NRF-2019M3E5D3073102 and NRF-2019R1H1A 2039682), a National IT Industry Promotion Agency (NIPA) grant (No. S0252-21-1001, Development of AI Precision Medical Solution (Doctor Answer 2.0), the Basic Science Research Program through NRF funded by the Ministry of Education (NRF-2020R1I1A1A01071665) funded by the Korean government (MSIT), and a grant (Da Young Lee, 2019F-7) from the Korean Diabetes Association). However, the funders did not participate in the study design or reporting.
REFERENCES
Table 1.
| Characteristic | All participants (n=122) |
|---|---|
| Age, yr | 53.4±12 |
| Male sex | 65 (53.3) |
| BMI, kg/m2 | 27.1±4.5 |
| Systolic BP, mm Hg | 131.3±16.0 |
| Glycosylated hemoglobin, % | 8.1±1.2 |
| Fasting/PP2 glucose, mg/dL | 118.2±36.2/174.5±59.7 |
| FCGR/PCGR2 | 0.9±0.8/1.6±1.2 |
| Triglyceride, mg/dL | 121.6±61.1 |
| HDL-C, mg/dL | 49.0±13.3 |
| LDL-C, mg/dL | 68.8±29.9 |
| eGFR, mL/min/1.73 m2 | 90.1±24.3 |
| Urine ACR, mg/g | 312.1±720.3 |
| Urine ACR ≥30 mg/g | 56 (45.9) |
| Current drinker | 61 (50) |
| Current smoker | 38 (31.2) |
| Regular exercise | 55 (45.1) |
| Duration of diabetes, yr | 16±10.2 |
| Hypertension | 82 (67.2) |
| Dyslipidemia | 101 (82.8) |
| Stroke | 6 (4.9) |
| Ischemic heart disease | 15 (12.3) |
| Anti-diabetic drug | |
| Basal insulin | |
| Glargine | 35 (28.7) |
| Degludec | 87 (71.3) |
| Total daily dose, U | 29.1±16 |
| Prandial insulin | |
| Aspart | 75 (61.5) |
| Glulisine | 4 (3.3) |
| Total daily dose, U | 12.6±15.3 |
| Times of injection, /day | |
| 0 | 43 (35.3) |
| 1 | 20 (16.4) |
| 2 | 35 (28.7) |
| 3 | 23 (18.9) |
| Metformin | 116 (95.1) |
| Sulfonylurea or meglitinide | 23 (18.9) |
| DPP-4 inhibitor | 57 (46.7) |
| SGLT-2 inhibitors | 31 (25.4) |
| GLP-1 receptor agonist | 5 (4.1) |
| Thiazolidinedione | 3 (2.5) |
| α-Glucosidase inhibitor | 2 (1.6) |
| Fitbit | |
| Sleep duration per night, min | 402.9±62.5 |
| Energy consumption, kcal/day | 2,283.9±561.9 |
| Daily step count | 10,011.5±10,275.0 |
| Daytime | 7,324.6±3,947.6 |
| Bedtime | 1,020.7±1,107.7 |
| Information from the dietary record | |
| Calorie intake, kcal/day | 2,061.2±465.4 |
| Carbohydrate intake, g/1,000 kcal/day | 131.6±18.3 |
| Fat intake, g/1,000 kcal/day | 30.9±6.5 |
| Protein intake, g/1,000 kcal/day | 42.8±5.4 |
| Fiber intake, g/1,000 kcal/day | 14.8±4.3 |
| CGM metrics | |
| Time of active CGM, % | 94.0±8.1 |
| TIR70‒180 mg/dL, % | 62.8±20.7 |
| >70%a | 52 (42.6) |
| TAR>250 mg/dL, % | 11.1±12.8 |
| <5%a | 57 (46.7) |
| TAR>180 mg/dL, % | 35.8±21.0 |
| <25%a | 47 (38.5) |
| TBR<70 mg/dL, % | 1.3±3.7 |
| <4%a | 111 |
| TBR<54 mg/dL, % | 0.2±0.9 |
| <1%a | 114 |
| SD, mg/dL | 51.6±14.2 |
| CV, % | 30.7±6.0 |
| ≤36a | 103 (84.4) |
Values are presented as mean±standard deviation or number of subjects (%).
BMI, body mass index; BP, blood pressure; PP2, 2-hour postprandial; FCGR, fasting C-peptide-to-glucose ratio; PCGR2, 2-hour postprandial C-peptide-to-glucose ratio; HDL-C, high-density lipoprotein cholesterol; LDL-C, low-density lipoprotein cholesterol; eGFR, estimated glomerular filtration rate; ACR, albumin-to-creatinine ratio; DPP-4, dipeptidyl peptidase 4; SGLT-2, sodium glucose cotransporter 2; GLP-1, glucagon like peptide-1; CGM, continuous glucose monitoring; TIR, time in range; TAR, time above range; TBR, time below range; SD, standard deviation; CV, coefficient of variation.
Table 2.
| Variable | TIR70‒180 | TAR>250 | TBR<70 | SD | CV |
|---|---|---|---|---|---|
| Age, yr | –0.11 | 0.15 | –0.01 | 0.20e | 0.15 |
| BMI, kg/m2 | –0.24f | 0.20e | –0.27f | 0.09 | –0.08 |
| Glycosylated hemoglobin, %a | –0.53g | 0.56g | –0.26f | 0.58g | 0.31f |
| Duration of diabetes, yr | –0.22e | 0.26f | –0.01 | 0.33g | 0.23e |
| PCGR2b | 0.22e | –0.29f | –0.24f | –0.43g | –0.45g |
| eGFR, mL/min/1.73 m2 | 0.22e | –0.31g | –0.05 | –0.41g | –0.36g |
| Urine ACR, mg/g | –0.35g | 0.42g | –0.19e | 0.42g | 0.21e |
| Daily sleep duration, minc | 0.02 | –0.05 | –0.04 | –0.07 | –0.02 |
| Energy consumption, kcal/day | –0.09 | 0.05 | –0.16 | 0.01 | –0.02 |
| Daytime step countsb | 0.05 | –0.03 | –0.14 | –0.04 | –0.07 |
| Calorie intake, kcal/dayd | –0.15 | 0.10 | –0.10 | 0.07 | –0.05 |
| Carbohydrate intake, g/1,000 kcal/day | –0.09 | 0.14 | 0.02 | 0.16 | 0.11 |
| Fat intake, g/1,000 kcal/day | 0.16 | –0.18 | 0.08 | –0.16 | –0.05 |
| Protein intake, g/1,000 kcal/day | 0.10 | –0.16 | 0.11 | –0.13 | –0.05 |
| Fiber intake, g/1,000 kcal/day | 0.05 | –0.01 | 0.22e | 0.09 | 0.19e |
| Total daily dose of insulin | –0.27f | 0.29f | 0.03 | 0.37g | 0.31g |
For analyses, TAR>250, TBR<70, PCGR2, and urine ACR levels, and the daytime step count were log-transformed before the analyses to maintain the normality of the residuals.
TIR, time in range; TAR, time above range; TBR, time below range; SD, standard deviation; CV, coefficient of variation; BMI, body mass index; PCGR2, 2-hour postprandial C-peptide-to-glucose ratio; eGFR, estimated glomerular filtration rate; ACR, albumin-to-creatinine ratio.
Table 3.
| Variable | Odds ratio (95% CI) |
|---|---|
| Clinical and behavioral factors | f |
| Age, yr | 0.98 (0.92‒1.04) |
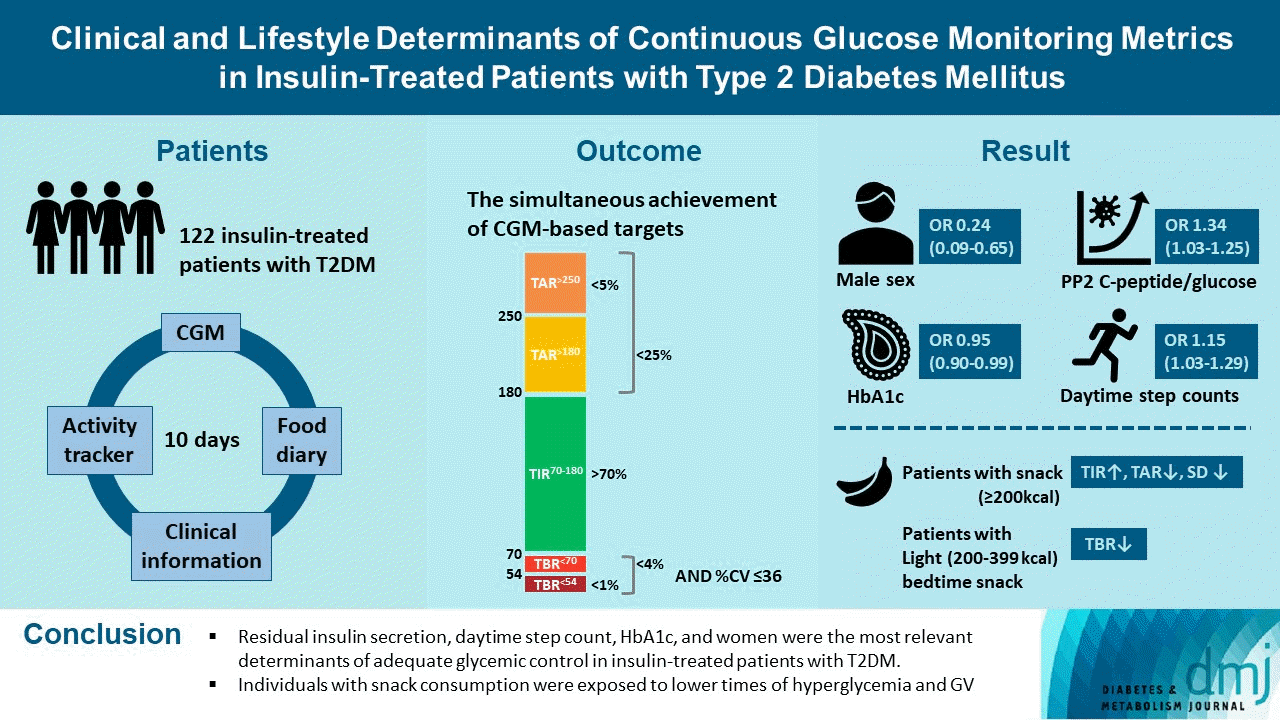
| Male sex | 0.24 (0.09‒0.65) |
| BMI, kg/m2 | 0.93 (0.82‒1.05) |
| Glycosylated hemoglobin, %b | 0.95 (0.90‒0.99) |
| Duration of diabetes, yr | 0.99 (0.92‒1.06) |
| PCGR2c | 1.34 (1.03‒1.25) |
| eGFR, mL/min/1.73 m2 | 1.01 (0.98‒1.04) |
| Urine ACR ≥30 mg/g | 0.32 (0.10‒1.02) |
| Daily sleep duration, mind | 0.99 (0.92‒1.08) |
| Daytime step countsc | 1.15 (1.03‒1.29) |
| Medications and nutritional factors | g |
| Sulfonylurea or meglitinide | 0.58 (0.15‒2.29) |
| DPP-4 inhibitor | 0.95 (0.33‒2.74) |
| SGLT-2 inhibitors | 1.19 (0.40‒3.53) |
| Total daily dose of insulin | 0.99 (0.96‒1.02) |
| 2 or 3 times of prandial insulin per day | 1.37 (0.49‒3.82) |
| Calorie intake, kcal/daye | 1.03 (0.91‒1.17) |
| Carbohydrate intake, g/1,000 kcal/day | 0.99 (0.96‒1.01) |
| Fat intake, g/1,000 kcal/day | 1.02 (0.94‒1.11) |
| Protein intake, g/1,000 kcal/day | 0.92 (0.83‒1.02) |
| Fiber intake, g/1,000 kcal/day | 0.91 (0.79‒1.06) |
CI, confidence interval; BMI, body mass index; PCGR2, 2-hour postprandial C-peptide-to-glucose ratio; eGFR, estimated glomerular filtration rate; ACR, albumin-to-creatinine ratio; DPP-4, dipeptidyl peptidase 4; SGLT-2, sodium glucose cotransporter 2.
Table 4.
| Variable | No | Yes | P valuea | P valueb |
|---|---|---|---|---|
| Snack consumption | 60 | 31 | ||
| TIR70‒180, % | 62.8±2.3 | 73±3.3 | 0.018 | 0.019 |
| TAR>250, % | 7.2 (5.4‒9.5) | 3.9 (2.6‒5.9) | 0.022 | 0.046 |
| TBR<70, % | 0.2 (0.0‒0.8) | 0.1 (0.0‒0.6) | 0.470 | 0.382 |
| SD, mg/dL | 53.6±1.7 | 44.6±2.5 | 0.006 | 0.007 |
| CV, % | 32.1±0.8 | 29±1.1 | 0.028 | 0.086 |
| Light bedtime snack | 69 | 22 | ||
| TIR70‒180, % | 66.0±2.1 | 67.2±3.8 | 0.792 | 0.866 |
| TAR>250, % | 6.2 (4.8‒80) | 4.8 (30‒7.6) | 0.323 | 0.515 |
| TBR<70, % | 0.4 (0.0‒1.2) | 0.0 (0.0‒0.2) | 0.002 | 0.006 |
| SD, mg/dL | 51.7±1.6 | 46.6±2.8 | 0.119 | 0.305 |
| CV, % | 31.7±0.7 | 28.7±1.2 | 0.037 | 0.172 |
Values are presented as least squares mean±standard error or median (interquartile range) after adjustment for age and sex. For analyses, TAR>250, TBR<70 were log-transformed before the analyses to maintain the normality of the residuals.
TIR, time in range; TAR, time above range; TBR, time below range; SD, standard deviation; CV, coefficient of variation.
a P values represent the comparison of two groups using analysis of covariance with adjustment for age and sex,
b P values represent the comparison of two groups using analysis of covariance with adjustment for age, sex, body mass index, estimated glomerular filtration rate, glycosylated hemoglobin, duration of diabetes, 2-hour postprandial C-peptide-to-glucose ratio, urine albumin-to-creatinine ratio ≥30 mg/g, daytime step counts, and daily sleep duration.


 PDF
PDF Citation
 Print
Print


 XML Download