Introduction
Materials and Methods
Animals
Human MSCs and MSCs/CD cells
Characteristics of MSCs and MSCs/CD
Quantitative polymerase chain reaction
Assessment of in vivo distribution of transplanted cells
Immunohistochemistry
Statistical analysis
Results
PK study of naïve MSCs in nude mice
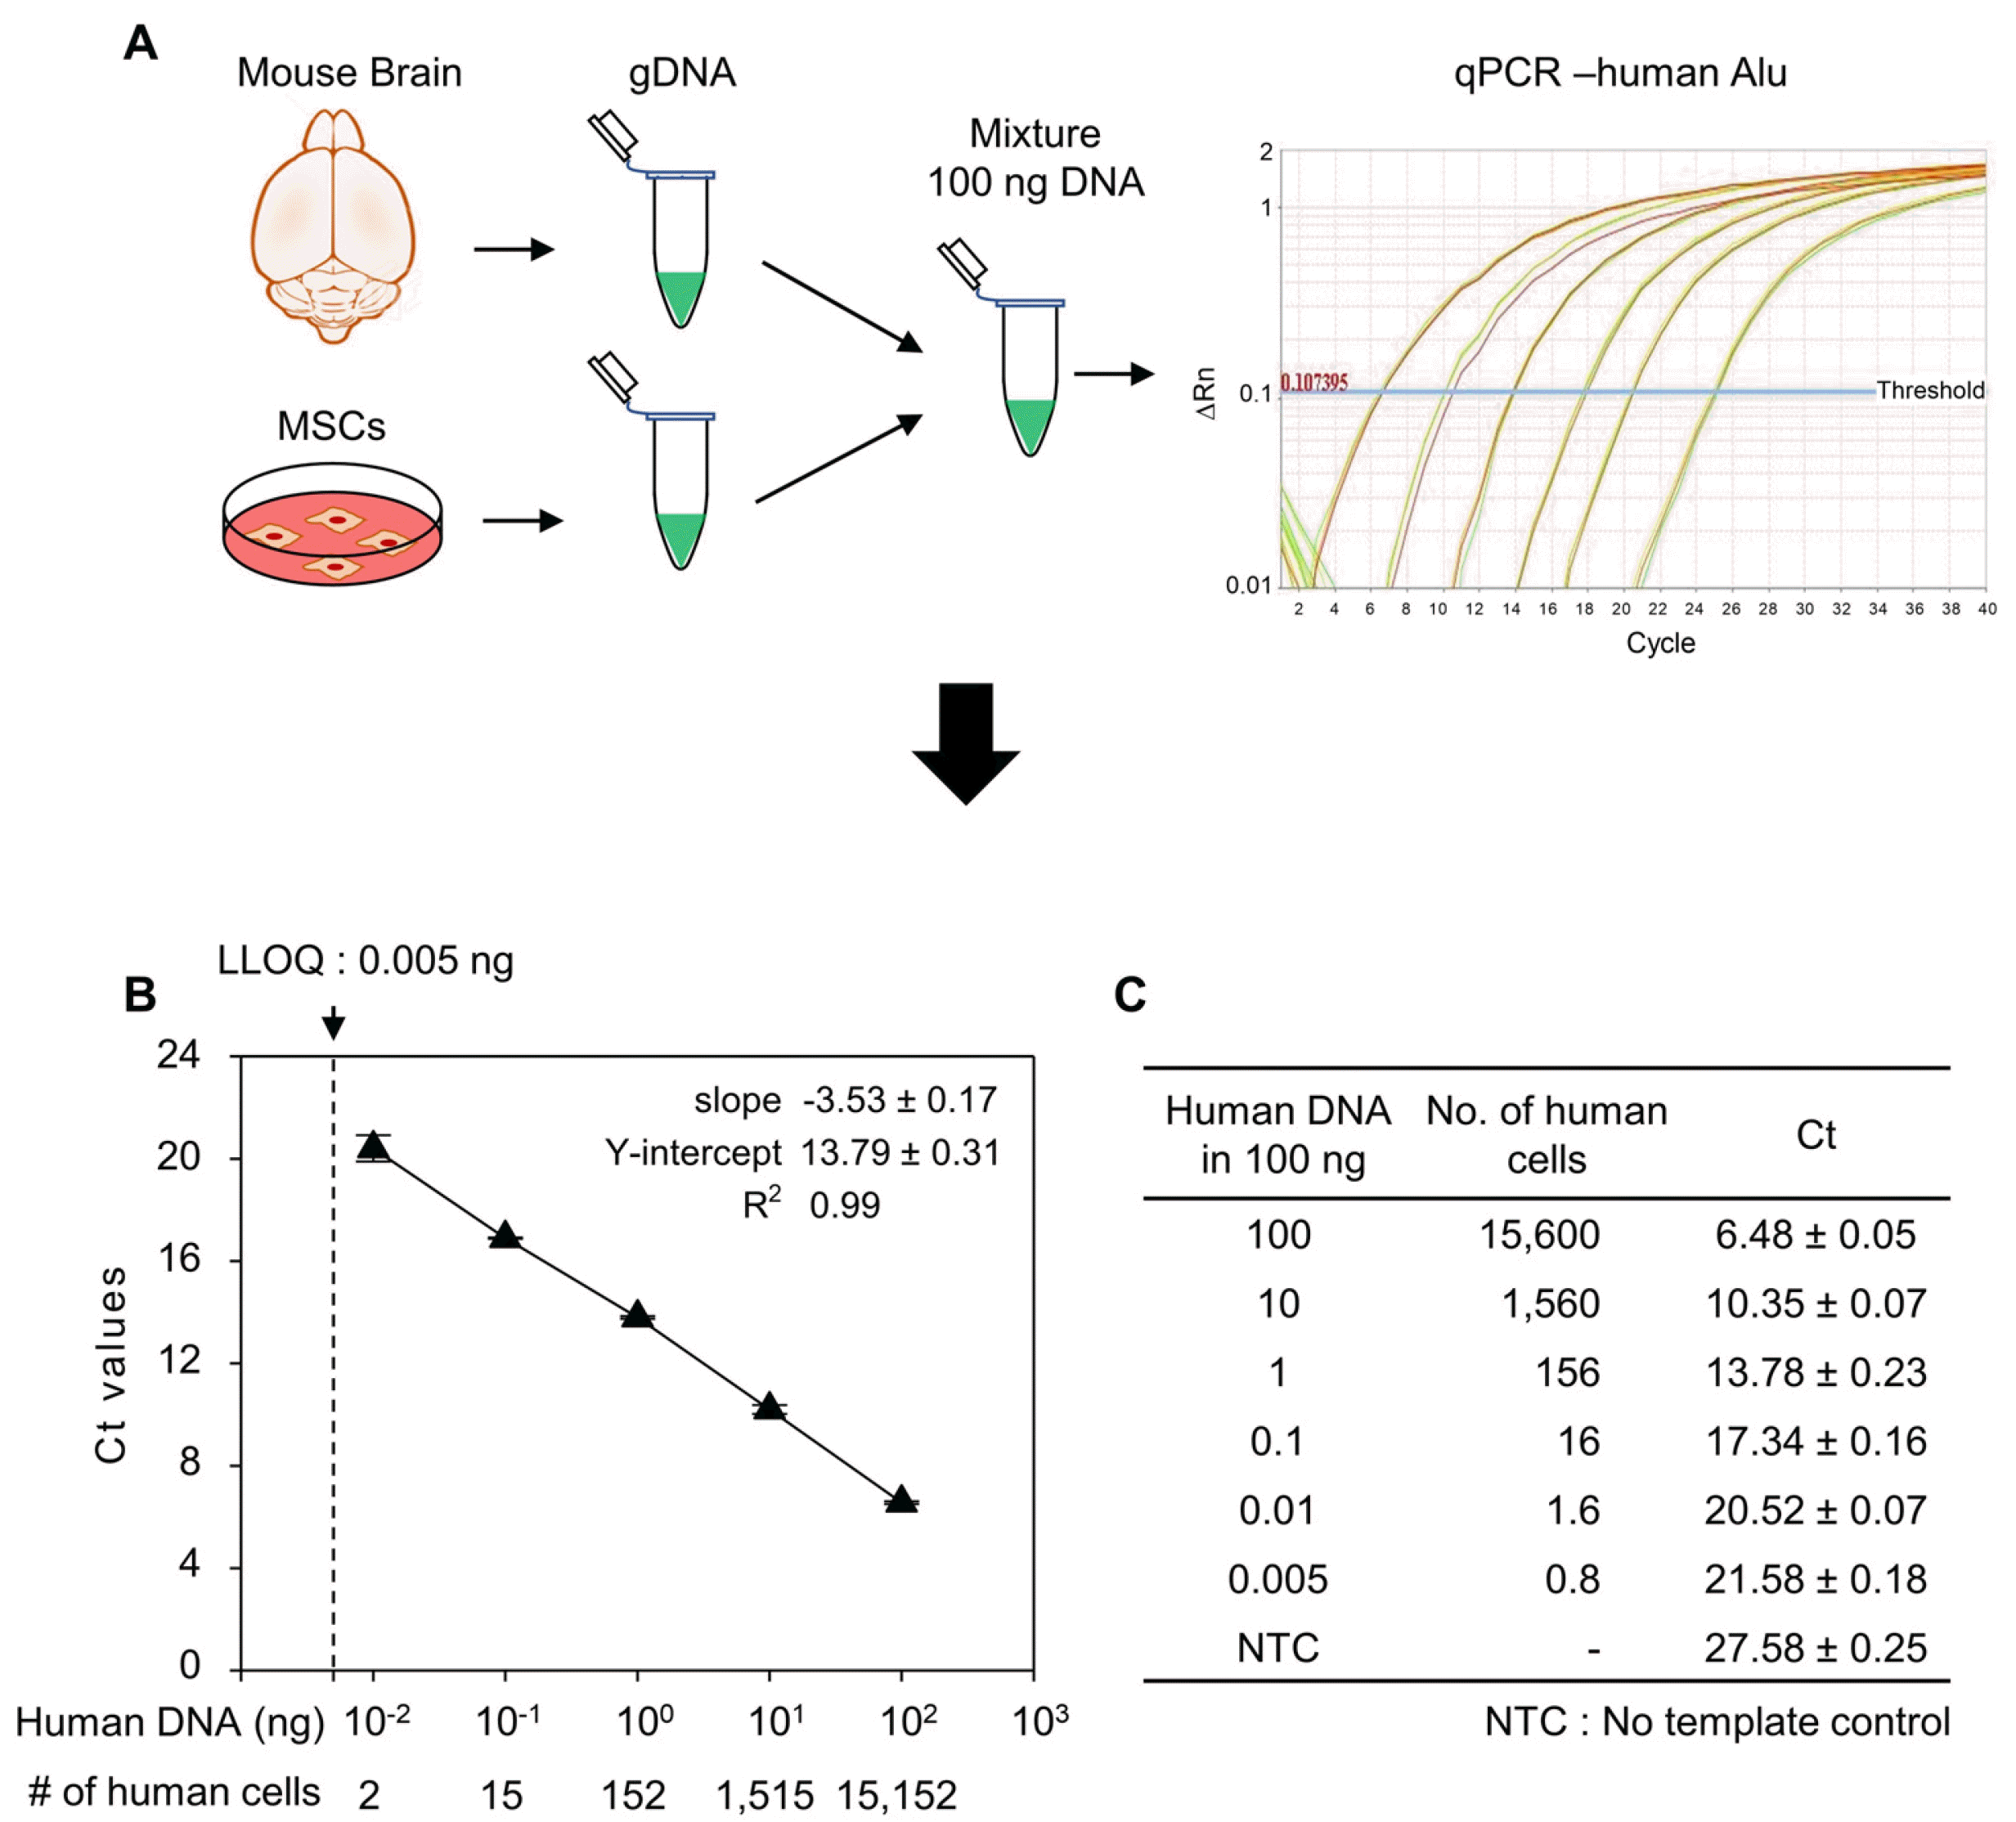 | Fig. 1Quantification of human cells by Alu J specific polymerase chain reaction (PCR) of genomic DNA (gDNA). (A) Schematic representation showing the method to prepare the human gene standard and human Alu J specific quantitative PCR (qPCR). gDNA from human mesenchymal stem cells (MSCs) were mixed with mouse brain gDNA to prepare standard DNA for qPCR. (B) Standard cu-rve generated from standard DNAs’ cycle threshold (Ct) values. (C) Con-centration of standard DNA used for Alu J qPCR and their respective Ct values obtained from qPCR. Data are mean±SD of three independent experiments. LLOQ: lower limit of quantification. |
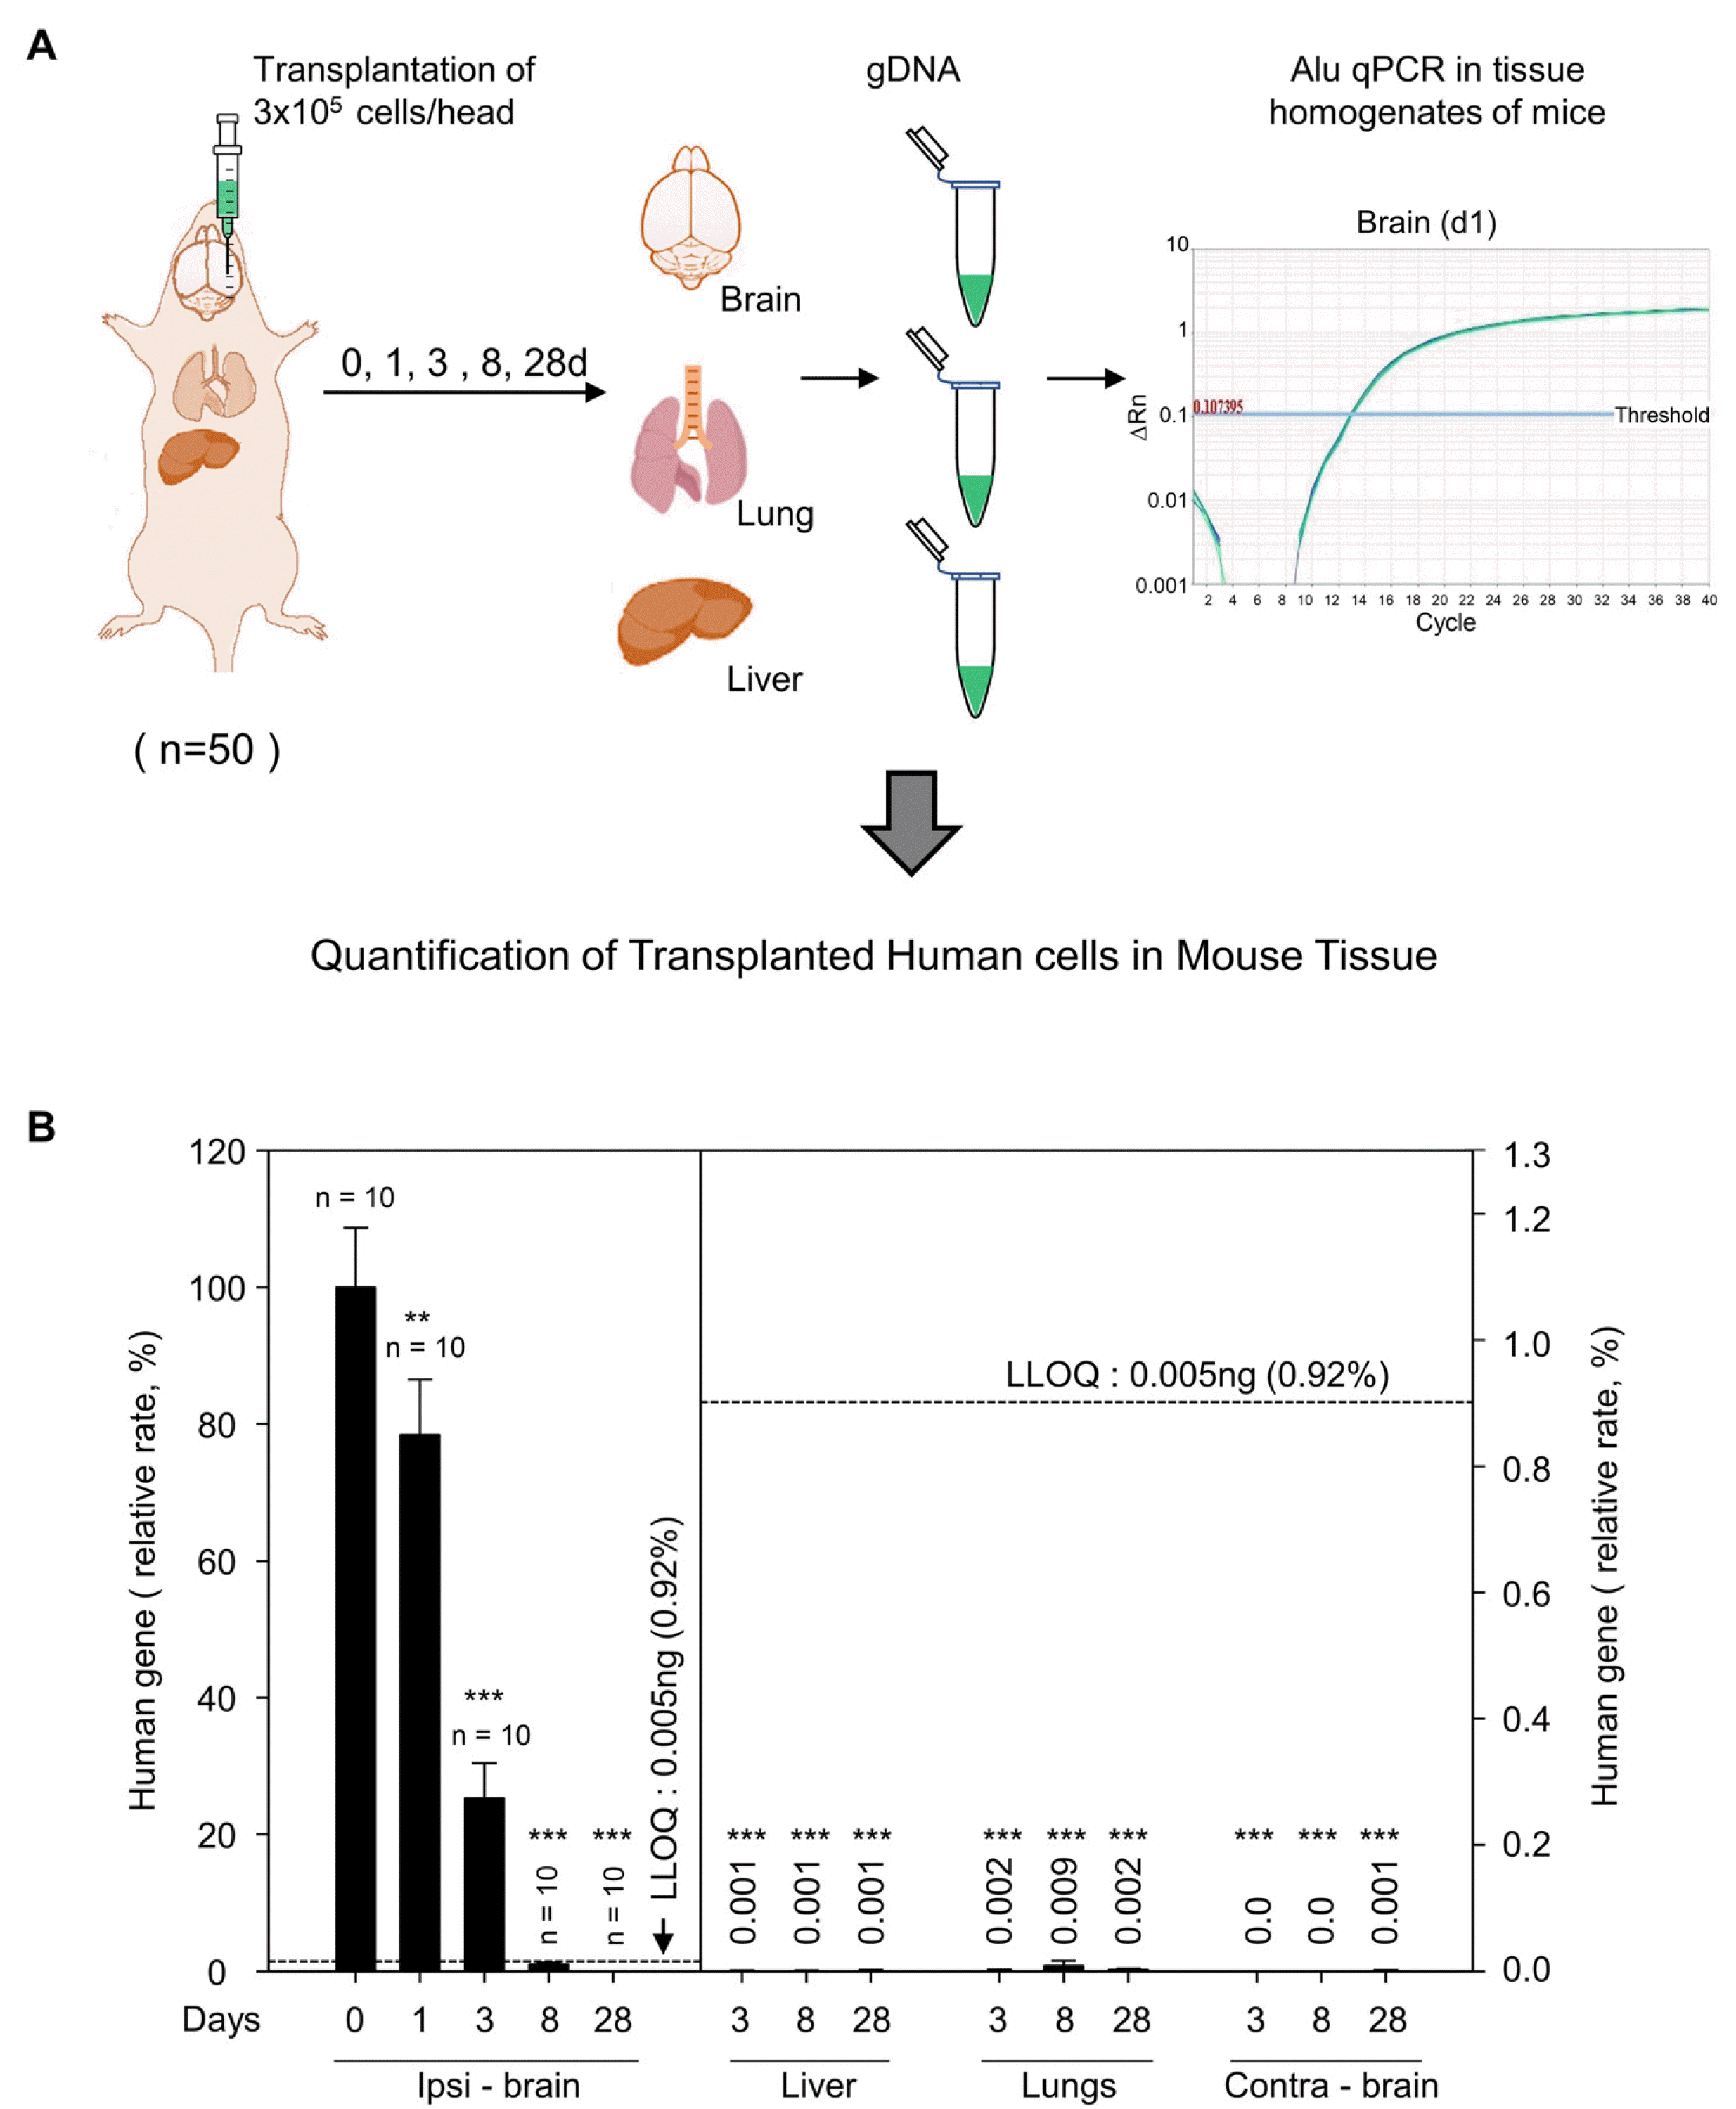 | Fig. 2Pharmacokinetics study of human mesenchymal stem cells (MSCs) transplanted into nude mice brain. (A) Schematic representation showing injection of MSCs in nude mouse striatum and genomic DNA (gDNA) preparation from brain, lungs, and liver on day 0, 1, 3, 8, and 28 after cell transplantation. (B) Quantification of human gene in ipsilateral brain (ipsi - brain), liver, lungs, and contralateral brain (contra - brain) from gDNA at indicated days by Alu J specific quantitative polymerase chain reaction (qPCR). Total number of animals per group is indicated just above bar graph in ipsi - brain. Low limit of quantification (LLOQ) is indicated by dotted lines. Values above bar graph in liver, lungs, contra - brain indicate relative rate of human gene in these organs compared to ipsi - brain at day 0. Data are mean± SEM of at least 10 animals per group. **p<0.01, ***p<0.001, compared to day 0, ipsi - brain group; one-way ANOVA test. |
Effect of in vivo ablation of neighboring cells on transplanted MSCs/CD fate in the brain
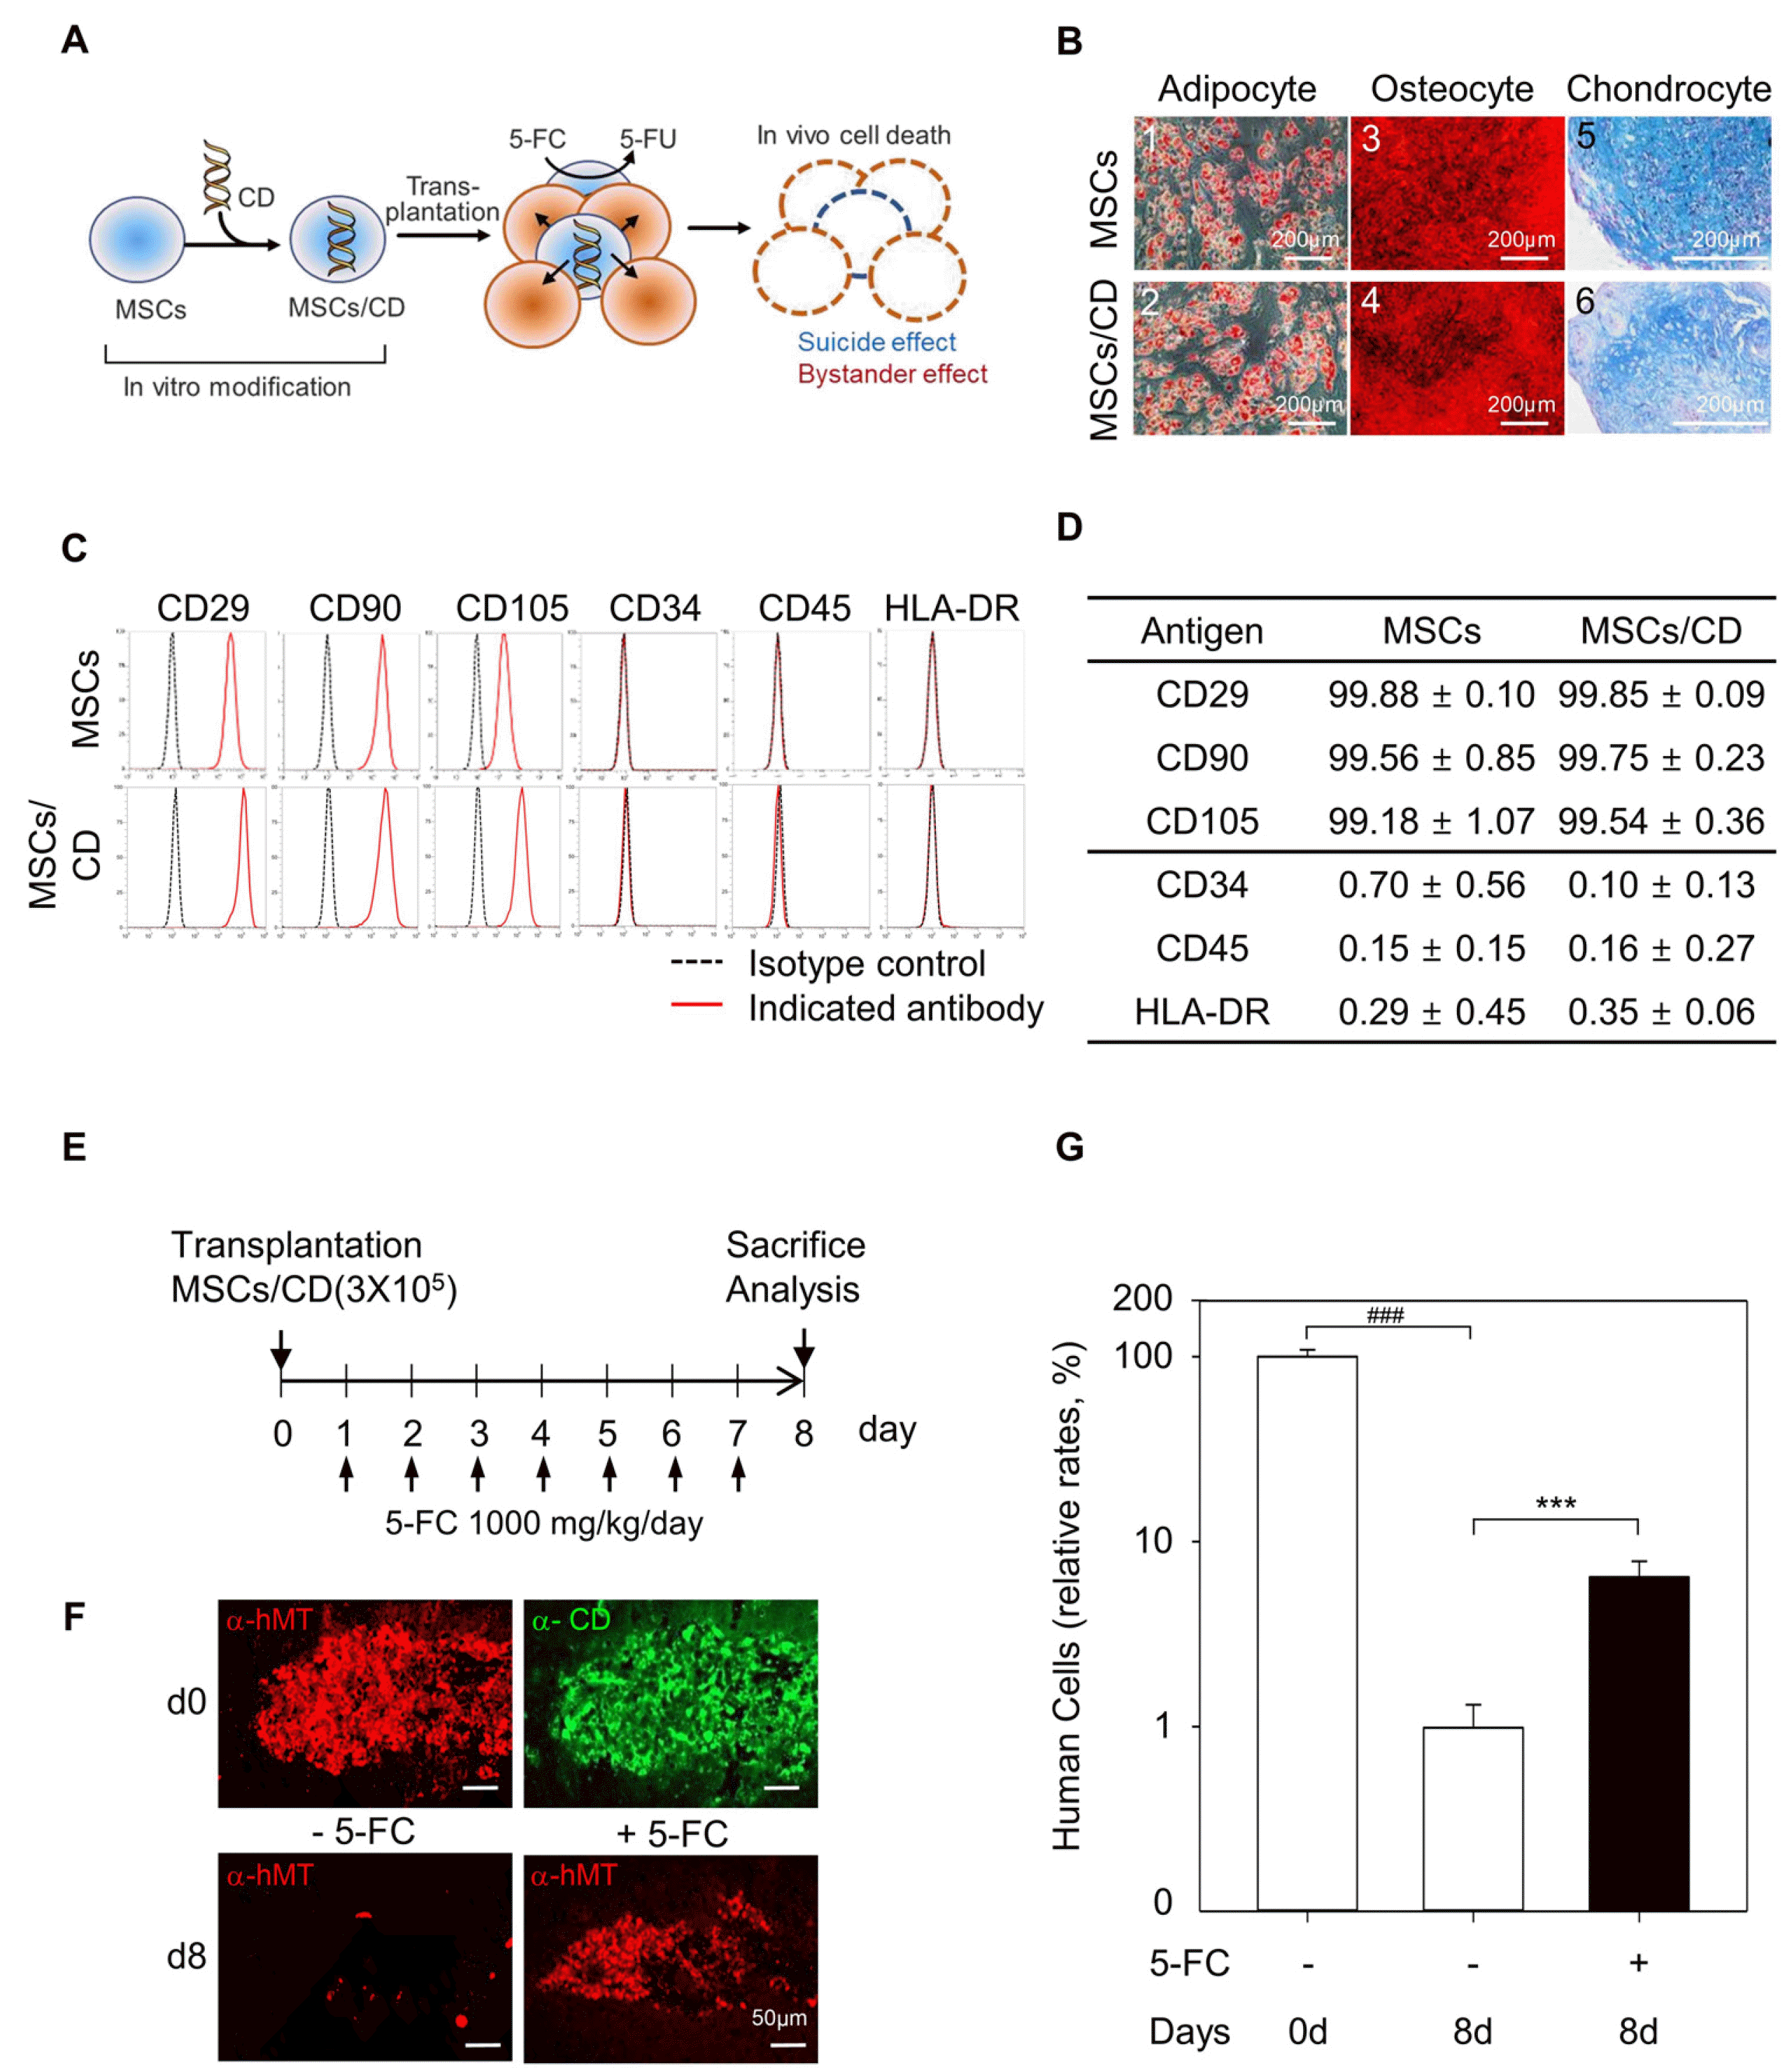 | Fig. 3Generation and characterization of mesenchymal stem cells expressing a cytosine deaminase (MSCs/CD), and effect of in vivo ablation of neighboring cells on the cell fate of transplanted MSCs/CD in the brain. (A) Schematic diagram of 5-fluorocytosine (5-FC) induced suicidal effect and bystander effect in MSCs/CD. (B) Mesodermal differentiation of MSCs and MScs/CD. Adipogenic differentiation showing Oil Red positive lipid droplets in bright field images of MSCs and MSCs/CD (B1, B2). Osteogenic differentiation showing alizarin red S stained precipitates in bright field images of MSCs and MSCs/CD (B3, B4). Chondrogenic differentiation of MSCs and MSCs/CD showing Alcian blue positive chondrocytes in bright field image (B5, B6). Scale bar=200 μm. (C) FACS analysis showing the surface antigen expression in MSCs and MSCs/CD. Isotype controls were used to determine the backgrounds. Black dotted peaks indicate the results obtained from cells stained with isotype control antibodies and red peaks indicate the results of cells stained with the indicated specific target antibodies. (D) Summary of FACS analysis showing the similar phenotype of MSCs and MSCs/CD: positive for CD29, CD90, and CD105 and negative for CD34, CD45, and HLA-DR. Data are mean±SEM from 3 independent experiments. (E) Experimental plan for 5-FC treatment to mice after MSCs/CD transplantation. (F) Representative immunofluorescence images show the detection of human mitochondrial-positive cells (α-hMT) with and without 5-FC administration. Scale bar=50 μm. (G) Comparison of relative rates of human cells detected at day 0 (d0) and day 8 (d8) with or without 5-FC administration. Data are mean±SEM of at least 10 animals per group. ###p<0.001, compared to d0 without 5-FC administered group; ***p<0.001, compared to d8 without 5-FC administered group; Student’s t-test. |
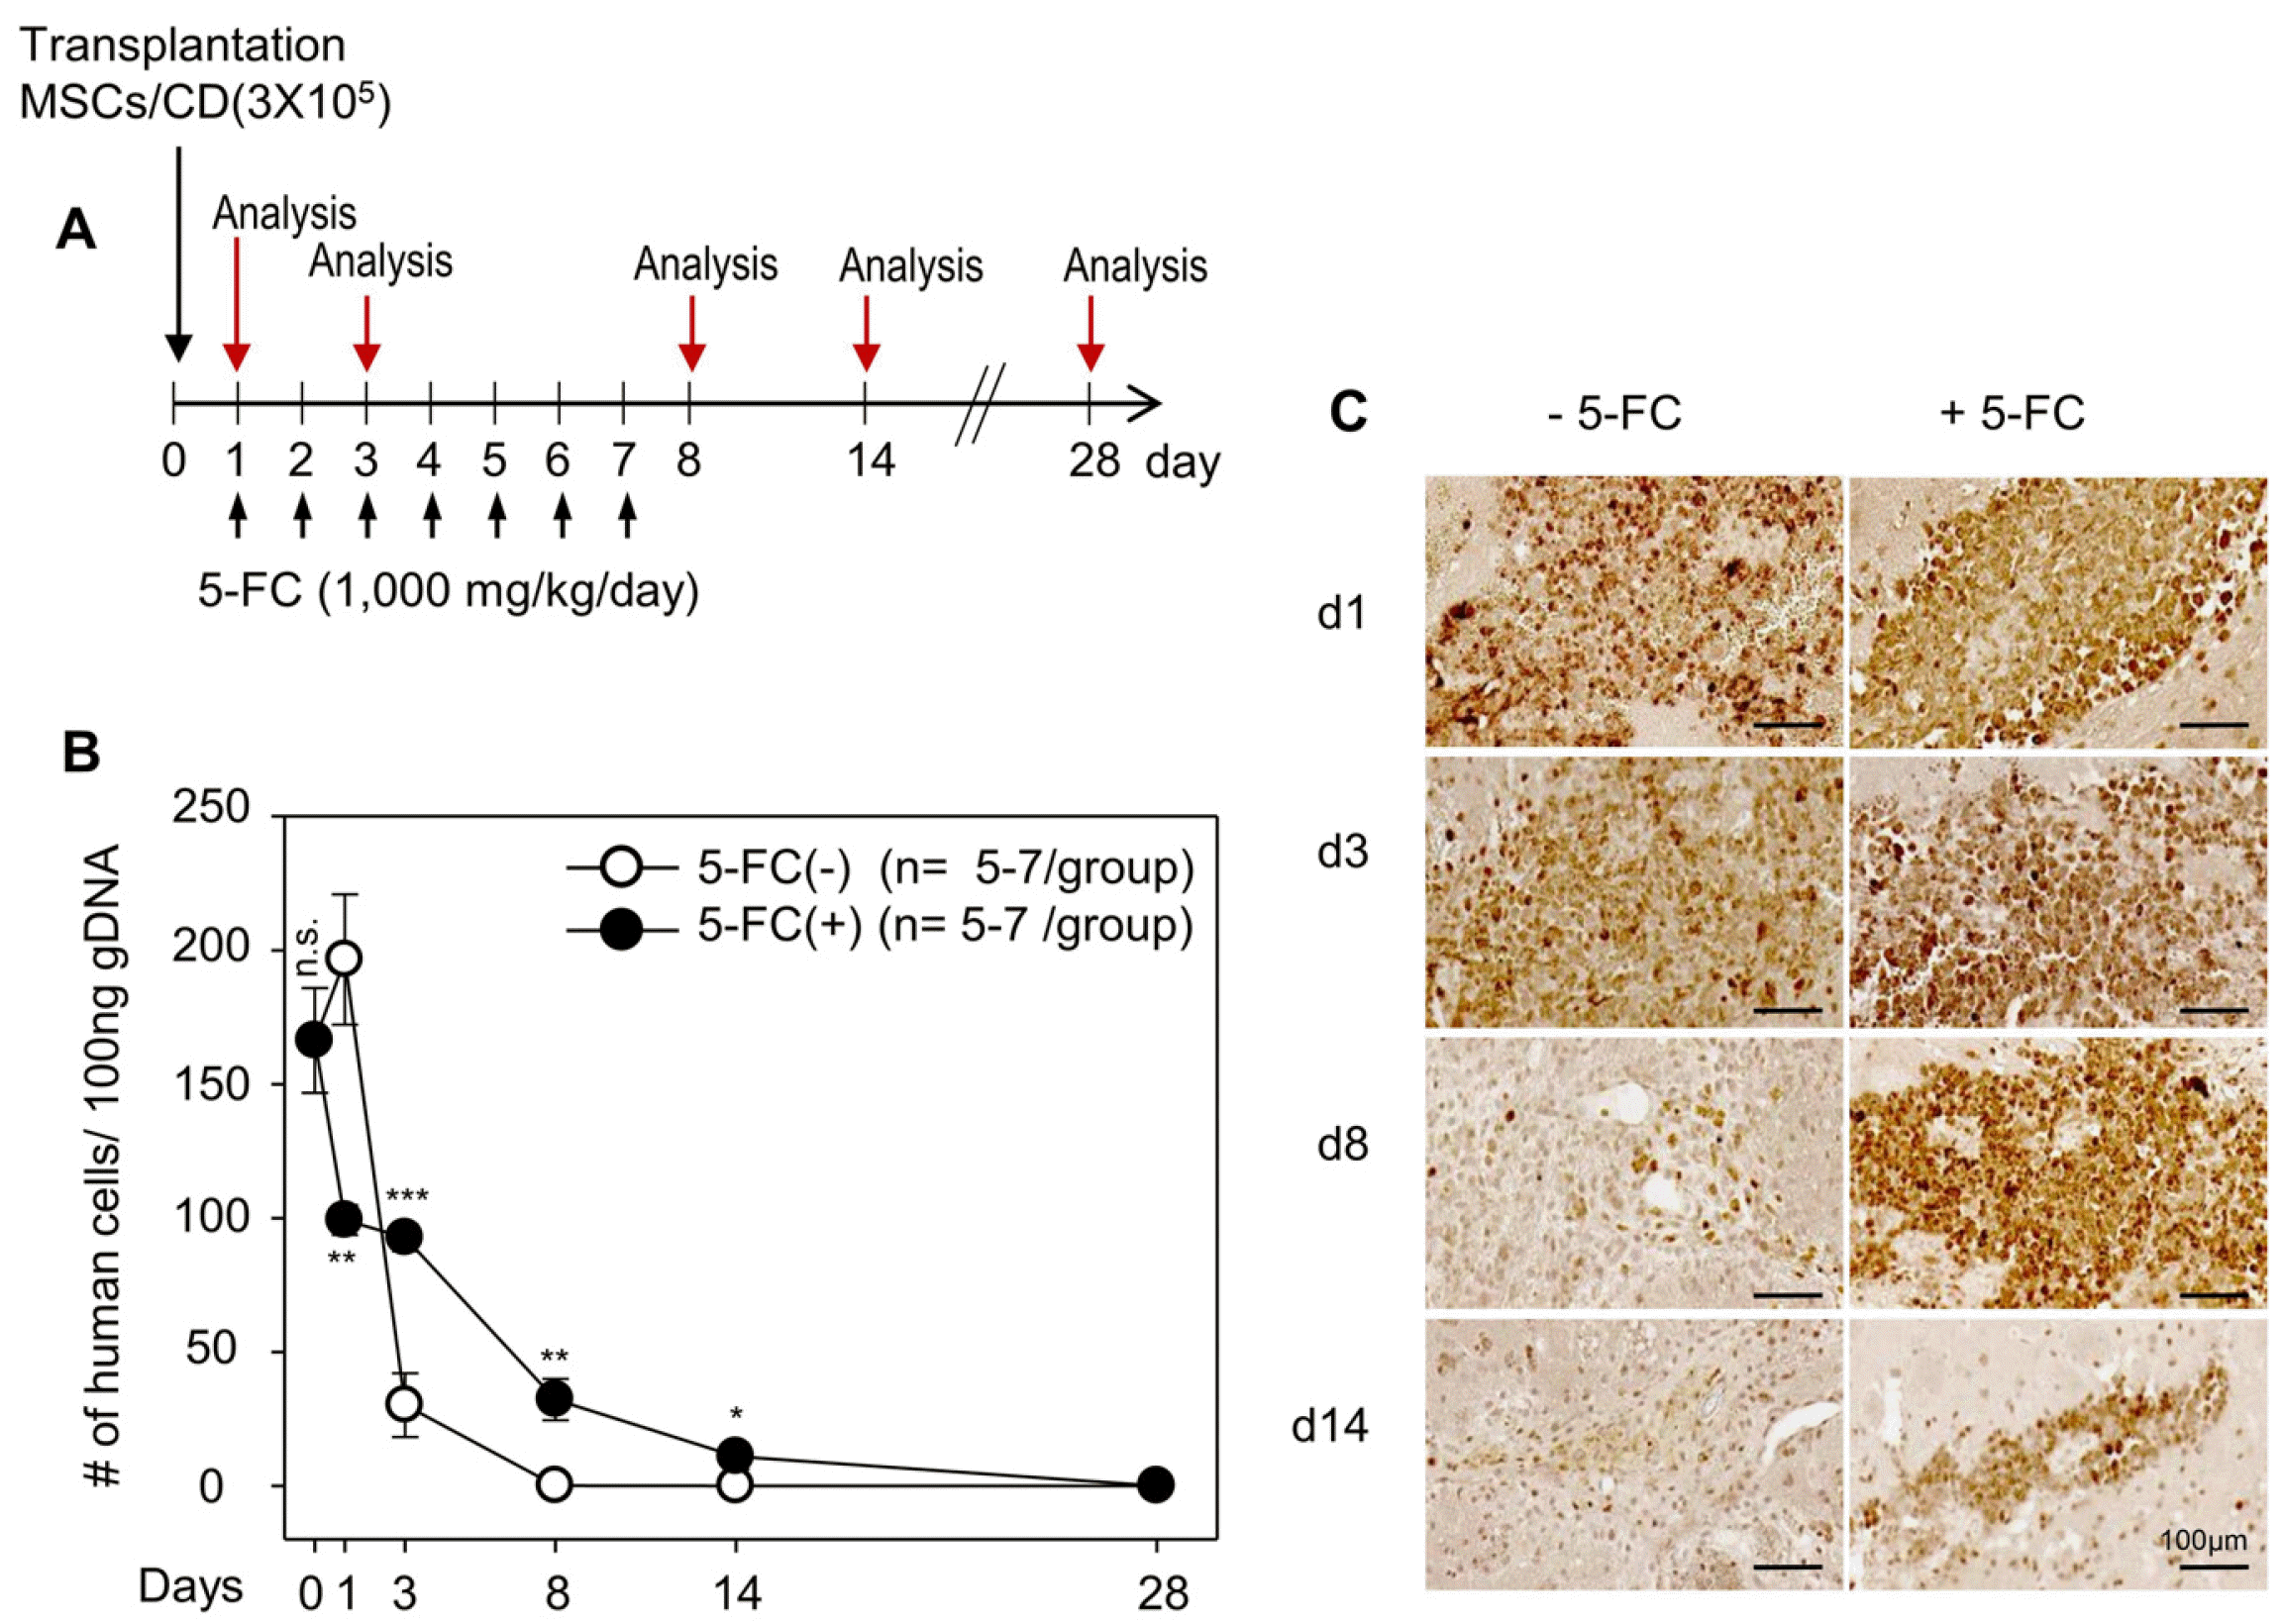 | Fig. 4
In vivo ablation of injected and neighboring cells with cytosine deaminase (CD) and 5-fluorocytosine (5-FC) prolongs the transplanted cells at the injection site. (A) Experimental plan for 5-FC administration (1,000 mg/kg/day) to nude mice brain after mesenchymal stem cells expressing a CD (MSCs/CD) (3×10⁵ cells) transplantation. Animal were sacrifice and genomic DNA (gDNA) extracted from injected brain at day 0 (d0), d1, d3, d8, d14, and d28 after cell transplantation. The 5-FC non administered group was used as a control. (B) Data are mean±SEM of at least 5 animals per group. *p<0.05, **p<0.01, ***p<0.001, compared to data without 5-FC administered group; Student’s t-test. Comparison of human cells detected by quantitative polymerase chain reaction in the ipsilateral brain at d0, d1, d3, d8, d14, and d28 with or without 5-FC administration. (C) Representative immunohistochemical images with anti-human mitochondrial antigen (hMT) showing the human cells at the injection site of the animals. Scale bar=100 μm. |
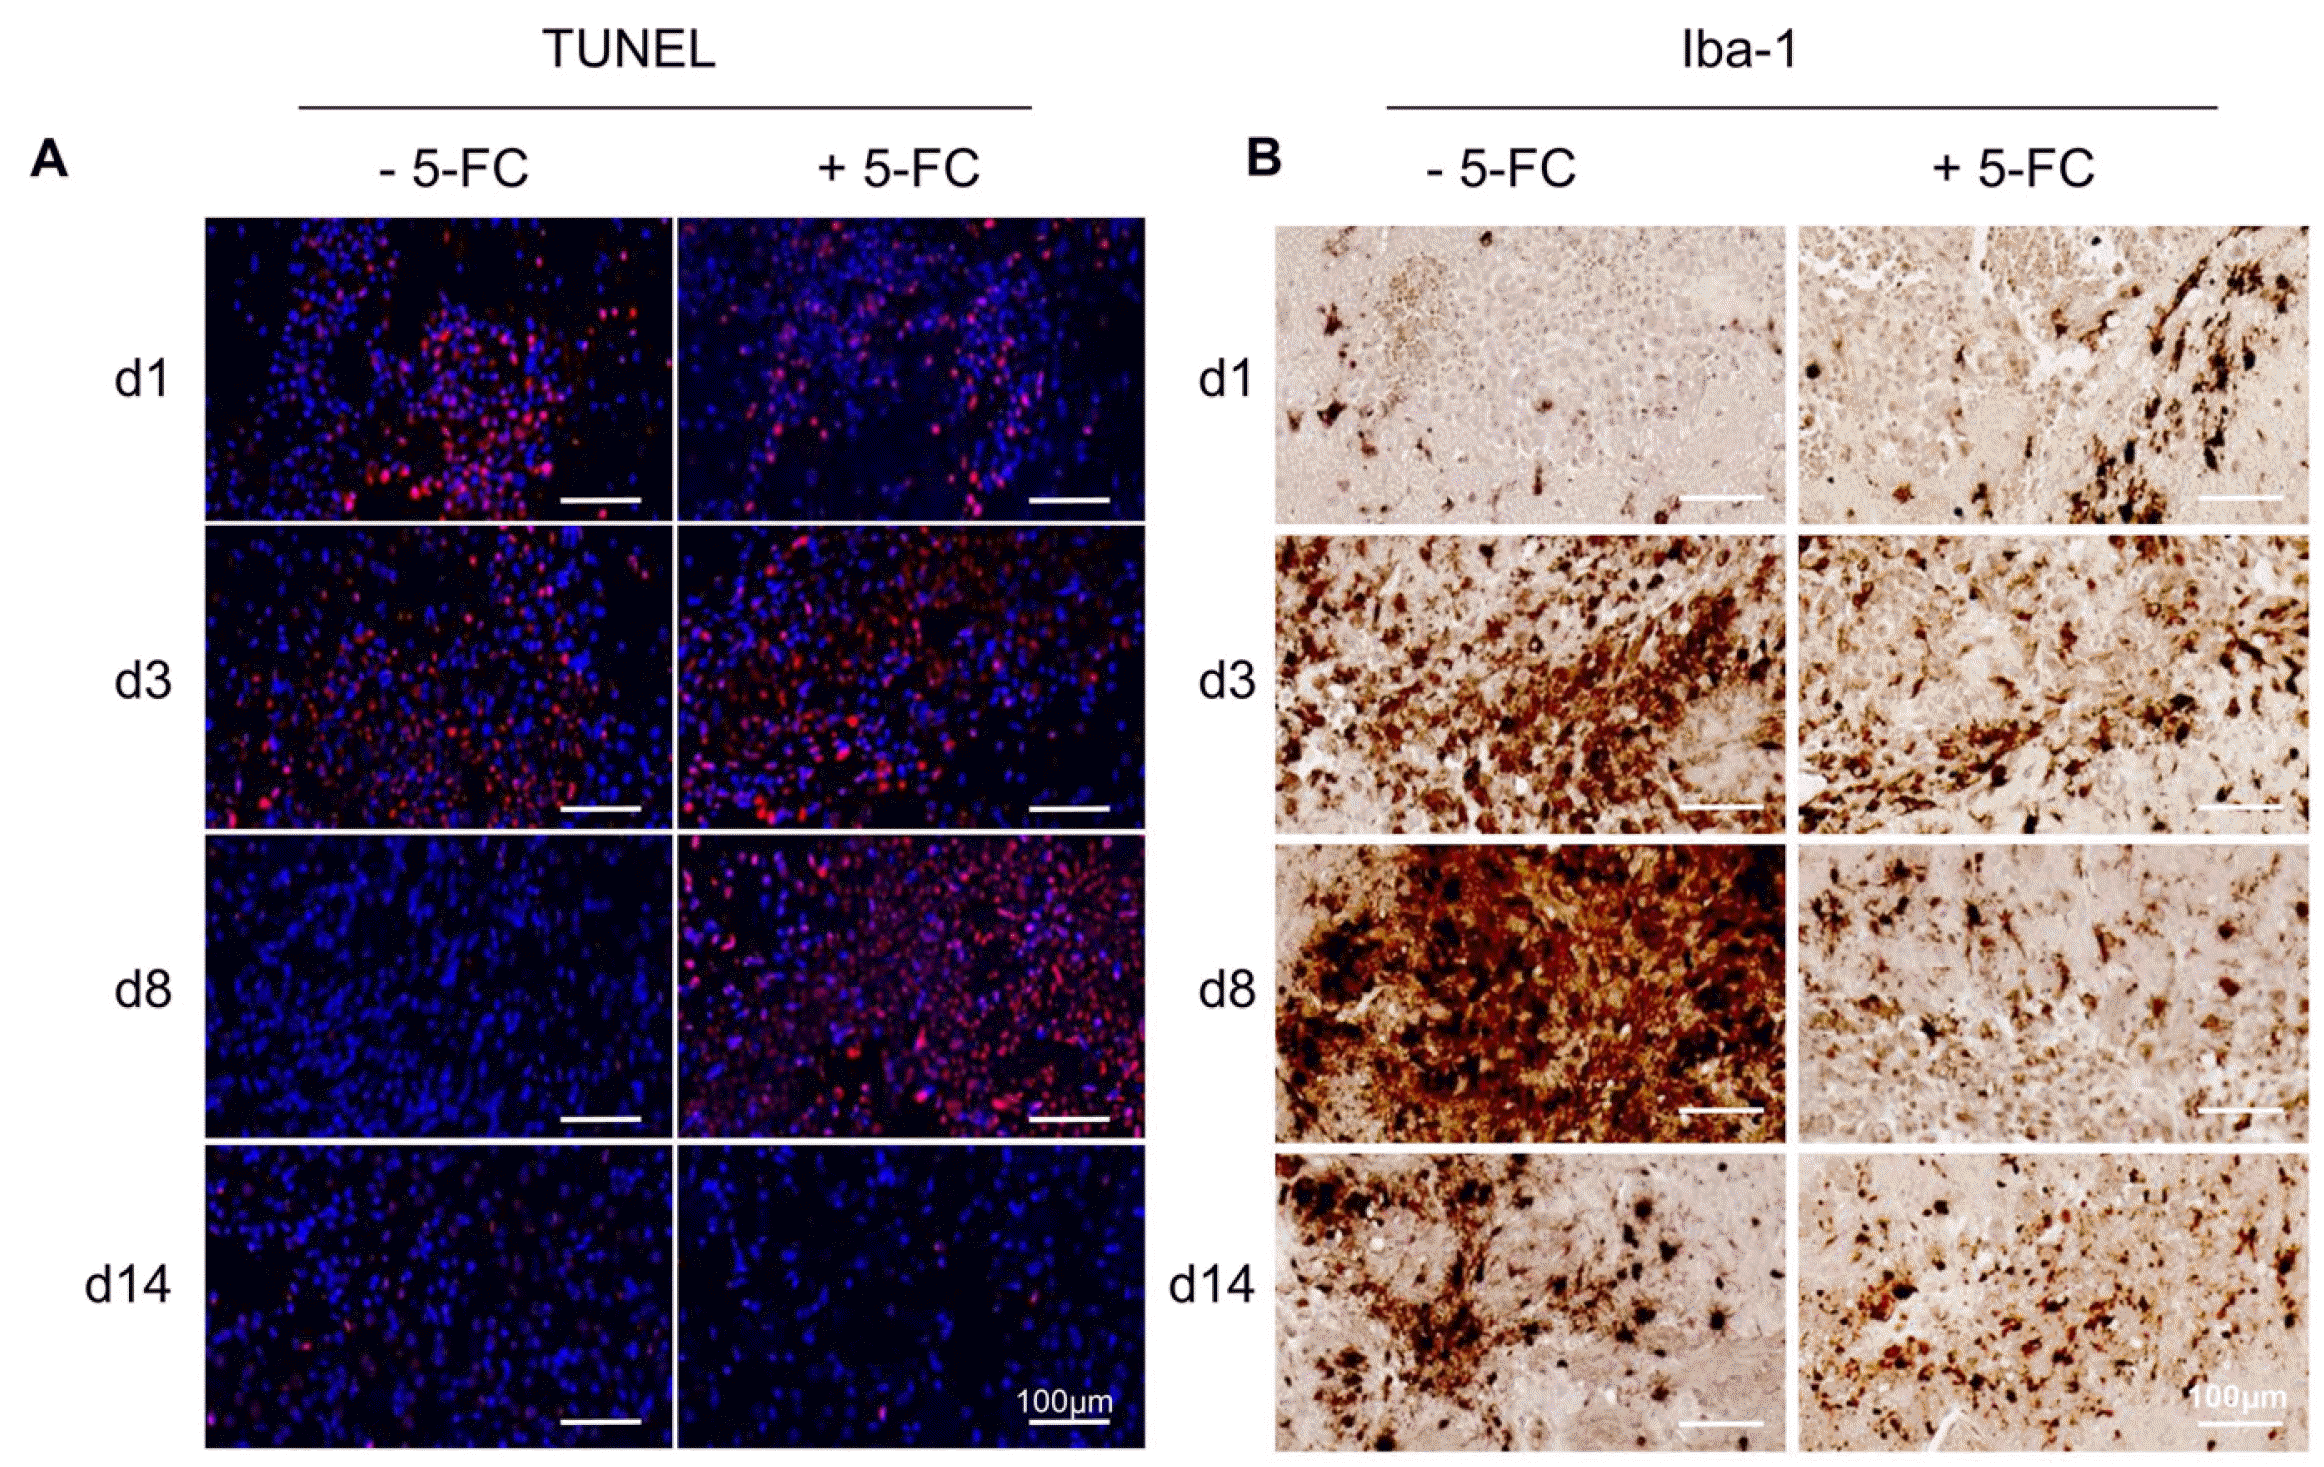 | Fig. 5
In vivo ablation of injected and neighboring cells with cytosine deaminase (CD) and 5-fluorocytosine (5-FC) differentially modulates immune response at the injection site. (A) Serially sectioned brains were stained for cell death at the injection site with Terminal deoxynucleotidyl transferase dUTP nick end labeling (TUNEL, red). The sections were counter-stained with Hoechst 33258 to show the nuclei (blue). The TUNEL-positive cells were detected at the injection site at day 1 (d1) in the control group, whereas they were dramatically increased at day 3∼8 (d3∼d8) in the 5-FC treated animal. (B) Serial sections were stained with an anti-Iba1 antibody to identify activated microglia at the injection site. Note dramatic increases of Iba-1 positive microglia only in the control group but not in the 5-FC treated group. Scale bar=100 μm. A minimum of two animals per group were utilized in our study. The representative one is shown. |


 PDF
PDF Citation
 Print
Print


 XML Download