INTRODUCTION
MATERIALS AND METHODS
Eligibility criteria
Information sources
Search strategy
Table 1
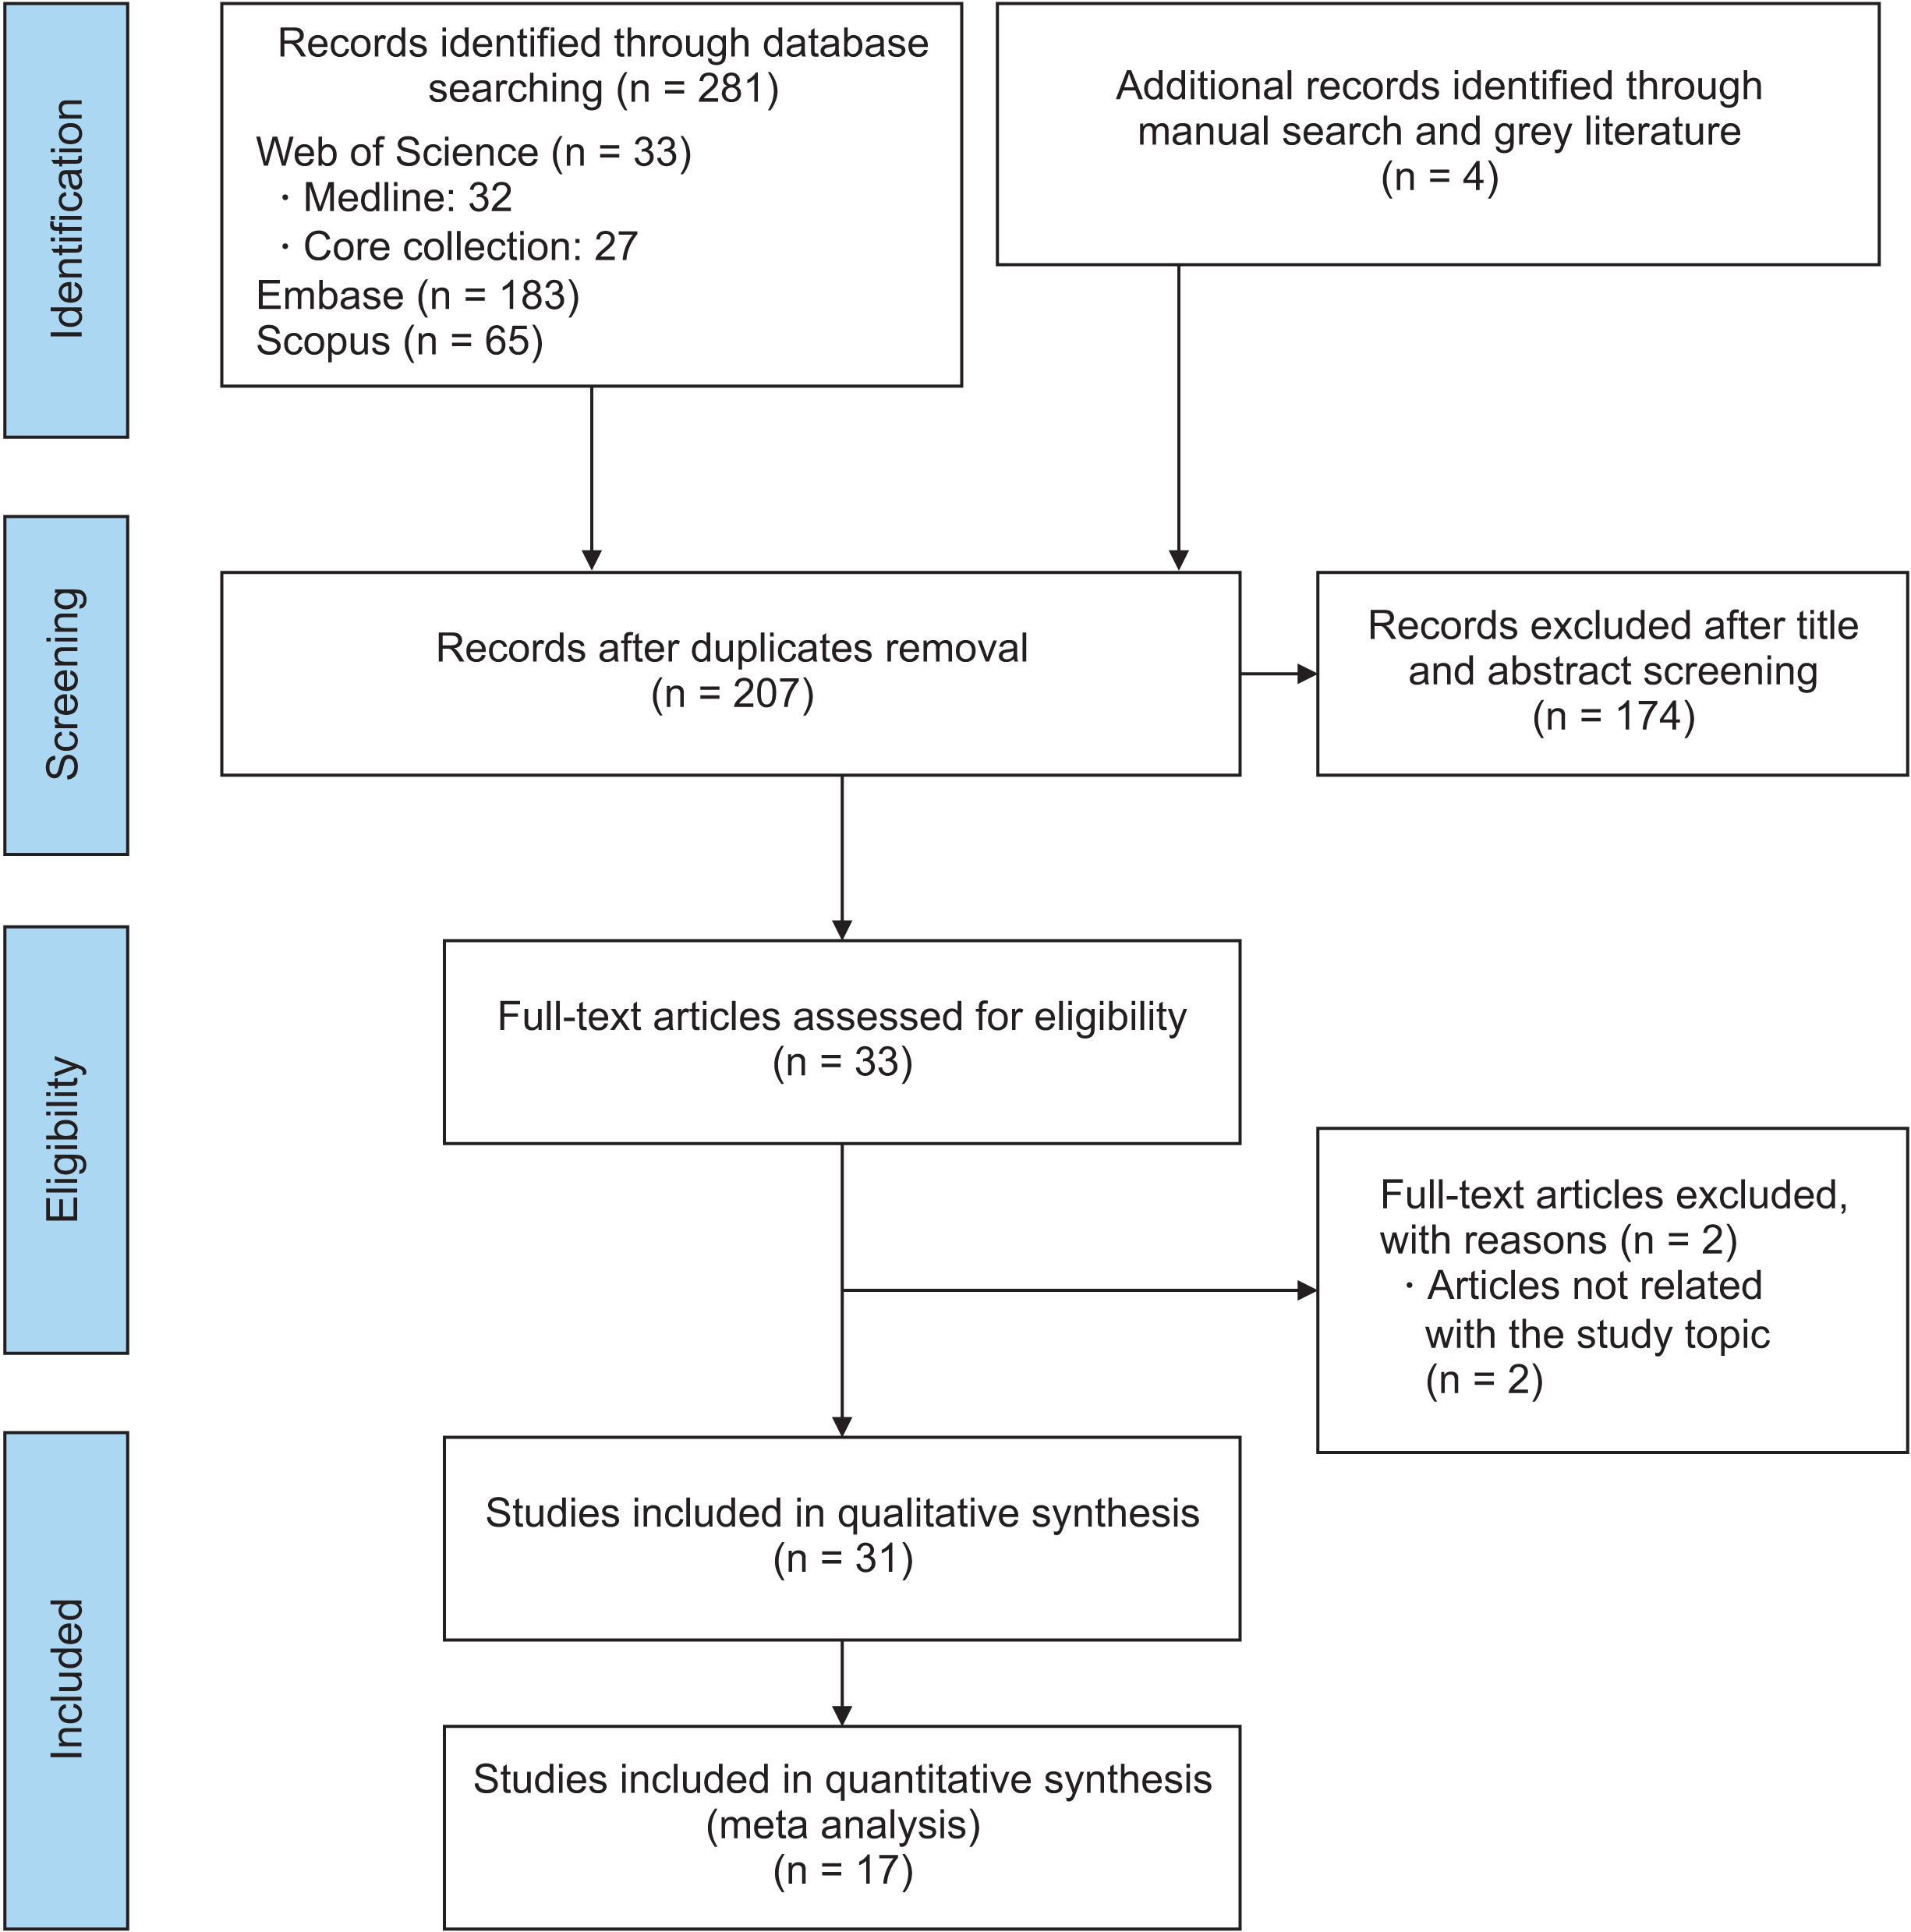
Study selection
Data collection process
Data items
Quality assessment
Statistical analysis
RESULTS
Table 2
| Author | Country | Study type | Age (yr) | Assesment timing | No. of patients/sex | Outcome variables |
|---|---|---|---|---|---|---|
| Abbate et al.23 (2015) | Italy | RCT |
CAs: 10–18
FAs: 10–18
|
- Beginning of treatment
- 3, 6, 12 mo
|
CAs: 22/N/A
FAs: 25/N/A
|
Plaque score (PS), bleeding score (BS), PD, PI, BOP
Periodontal pathogens and microbial biofilm mass through real time PCR (A. Actinomycetemcomitans; P. gingivalis; P. intermedia; T. Forsythia)
|
| Alajmi et al.48 (2020) | Kuwait | RS |
CAs: 32.9 ± 6.9
FAs: 23.6 ± 5.3
|
N/A |
CAs: 20 F/10 M
FAs: 21 F/9 M
|
Score of a OHRQoL questionnaire |
| Albhaisi et al.24 (2020) | Jordan | RCT |
CAs: 21.2
FAs: 21.3
|
- Beginning of treatment
- 3 mo
|
CAs: 20 F/7 M
FAs: 19 F/3 M
|
Fluorescence loss (DF), number of newly developed lesions, deepest point in the lesion (DFMax), lesion area (pixels), and plaque surface area (DR30) |
| AlSeraidi et al.32 (2021) | India | PCS |
CAs: 27.8 ± 6.9
FAs: 26.4 ± 7.3
LOs: 30.0 ± 6.9
|
6 to 9 wk |
CAs: 21 F/18 M
FAs: 22 F/19 M
LOs: 20 F/17 M
|
WHOQOL-BREF questionnaire, physical health, psychological wellbeing, social relationships, environment and overall score |
| Antonio-Zancajo et al.33 (2020) | Spain | PCS |
CAs: 33.4 ± 5.1
FAs: 24.7 ± 4.1
LOs: 33.8 ± 8.2
SLB: 28.0 ± 9.7
|
- 4, 8, 24 hr
- 2–7 days
- 1 mo
|
CAs: 14 F/16 M
FAs: 17 F/13 M
LOs: 17 F/13 M
SLB: 18 F/12 M
|
- Modified McGill questionnaire for pain assessment
- Oral health impact profile-14 (OHIP-14) questionnaire
|
| Azaripour et al.49 (2015) | Germany | RS |
CAs: 31.9 ± 13.6
FAs: 16.3 ± 6.9
|
- Before treatment
- CAs: 12.6 ± 7.4 mo
- FAs: 12.9 ± 7.2 mo
|
CAs: 39 F/11 M
FAs: 34 F/ 16 M
|
SBI, approximatye plaque index (API), GI
Non validated QoL questionnaire
|
| Baseer et al.44 (2021) | Saudi Arabia | CSS |
CAs: 25.0 ± 8.1
FAs: 24.9 ± 8.1
|
One week after an
appliance activation
- CAs: 9.56 ± 9.62 mo
- FAs: 11.51 ± 10.19 mo
|
CAs: 29 F/3 M
FAs: 99 F/19 M
|
OHRQoL questionnaire same than Alajmi et al.49 |
| Buschang et al.50 (2019) | USA | RS |
CAs: 30.4 ± 14.4
FAs: 29.2 ± 11.5
|
- Before treatment
- CAs: 1.5 ± 0.9 yr
- FAs: 2.5 ± 1.3 yr
|
CAs: 156 F/88 M
FAs: 130 F/76 M
|
- Percent of patients who developed WSLs
- OH assessment
|
| Chhibber et al.25 (2018) | Australia | RCT |
CAs: 16.6 ± 4.0
FAs: 14.6 ± 3.9
SLB: 15.4 ± 3.5
|
- Before treatment
- 9, 18 mo
|
CAs: 7 F/20 M
SLB: 13 F/9 M
FAs: 10 F/12 M
|
PI, GI, PBI |
| Dallel et al.34 (2020) | Tunisia | PCS |
CAs: 16.8 ± 2.0
FAs: 15.2 ± 3.0
AP: 13.2 ± 2.0
|
- Before treatment
- 1, 9 mo
|
CAs: 17 F/14 M
FAs: 22 F/25 M
AP: 16 F/18 M
|
Volume and salivary flow, salivary pH measurement; buffering capacity determination; electrolytes, salivary enzymes, and substrate; Trolox equivalent antioxidant capacity (TEAC), lipid peroxidation, percent of WSLs |
| Flores-Mir et al.45 (2018) | Canada | CSS | Total: 18–25 | - 6 mo |
CAs: 81
FAs: 41
89 F/33 M
|
Dental impacts on daily living (DIDL) questionnaire, patient satisfaction questionnaire (PSQ) |
| Gao et al.35 (2021) | China | PCS |
CAs: 26.0 ± 5.5
FAs: 24.6 ± 5.2
|
Pain and anxiety:
1, 3, 5, 7, 14 days
QoL: 1, 7, 14 days
|
CAs: 42 F/13 M
FAs: 42 F/13 M
|
Pain assessment (VAS)
State-trait anxiety inventory (STAI)
OHIP-14 questionnaire
|
| Gujar et al.26 (2019) | India | RCT |
Total: 12–32
Mean: 28.0 ± 4.0
|
- Before treatment
- 21 days
- 9 mo
|
CAs: 11 F/9 M
FAs: 12 F/8 M
|
PI, GI, BOP, cytokine levels in gingival crevicular fluid |
| Gujar et al.36 (2020) | India | PCS | Total: 11–29 | - 30 days |
CAs: 20
FAs: 20
LOs: 20
|
Microbial profile using checkerboard DNA-DNA hybridization technique |
| Han51 (2015) | China | RS |
Total: 35–74
Mean: 53.0 ± 9.4
|
- Beginning of treatment
- End of treatment
|
CAs: 16
FAs: 19
21 F/14 M
|
PI, GI, PD, bone level assessed on OPG |
| Karkhanechi et al.15 (2013) | USA | PCS |
CAs: 28.0 ± 6.9
FAs: 34.0 ± 7.2
|
- Beginning of treatment
- 6 wk
- 6, 12 mo
|
CAs: 12 F/8 M
FAs: 16 F/6 M
|
PI, GI, PPD, BOP |
| Levrini et al.27 (2013) | Italy | RCT |
CAs: 24.6 ± 6.4
FAs: 25.7 ± 3.4
CG: 25.0 ± 3.4
|
- Beginning of treatment
- 1, 3 mo
|
CAs: 7 F/3M
FAs: 7 F/3M
CG: 7 F/3M
|
PI, BOP, PD, periodontal pathogens and microbial biofilm mass through real time PCR |
| Levrini et al.28 (2015) | Italy | RCT |
Total: 16–30
Mean: 2.3
|
- Beginning of treatment
- 1, 3 mo
|
CAs: 27 F/5 M
FAs: 17 F/18 M
CG: 8 F/2 M
|
PI, BOP, PD, periodontal pathogens and microbial biofilm mass through real time PCR |
| Lombardo et al.37 (2021) | Italy | PCS |
CAs: 21.0 ± 0.4
FAs: 14.0 ± 0.8
|
- Beginning of treatment
- 1, 3, 6 mo
|
CAs: 9 F/5 M
FAs: 8 F/5 M
|
Periodontal pathogens and microbial biofilm mass through real time PCR (A. Actinomycetemcomitans, P. Gingivalis, F. Nucleatum, C. Rectus, Tenticola and T. Forsythia) |
| Madariaga et al.38 (2020) | Italy | PCS |
CAs: 34.7 ± 12.5
FAs: 20.6 ± 8.1
|
- Beginning of treatment
- 3 mo
|
CAs: 20
FAs: 20
26 F/14 M
|
PI, BOP, PD, REC |
| Miethke and Vogt29 (2005) | Germany | NRCT |
Total: 18–51
Mean: 30.1
|
3 assessments at 3–4 wk interval starting at least after 6 mo into treatment |
CAs: 30
FAs: 30
43 F/17 M
|
PI, GI, PD, PBI |
| Miller et al.39 (2007) | USA | PCS |
CAs: 38.0 ± 12.4
FAs: 28.6 ± 8.7
|
- Beginning of treatment
- 1–7 days
|
CAs: 22 F/11M
FAs: 6 F/21 M
|
Pain (VAS), QoL evaluated with the geriatric oral health assessment index; pain medication intake |
| Mulla Issa et al.46 (2020) | China | CSS |
CAs: 26.9 ± 4.8
FAs: 26.7 ± 5.2
CFAs: 27.7 ± 8.2
SLB: 26.9 ± 5.2
|
N/A, at least 6 mo |
CAs: 12 F/8 M
FAs: 7 F/13 M
CFAs: 11 F/9 M
SLB: 10 F/10 M
|
PI, GI, GBI, SBI, PBI, BOP, BPE |
| Mummolo et al.40 (2020) | Italy | PCS |
CAs: 21.5 ± 1.5
FAs: 23.3 ± 1.6
RP: 18.2 ± 1.5
|
- Beginning of treatment
- 3, 6 mo
|
CAs: 12 F/18 M
FAs: 12 F/22 M
RP: 10 F/16 M
|
PI, salivary flow and saliva buffering power through CRT® Buffer system; bacterial count (S. mutans and Lactobacillus) through CRT® bacteria |
| Mummolo et al.41 (2020) | Italy | PCS |
CAs: 20.4 ± 1.7
FAs: 21.3 ± 1.7
|
- Beginning of treatment
- 3, 6 mo
|
CAs: 16 F/24 M
FAs: 18 F/22 M
|
PI, salivary flow and saliva buffering power through CRT® Buffer system; bacterial count (S. mutans and Lactobacillus) through CRT® bacteria |
| Shalish et al.30 (2012) | Israel | NRCT | Total: 18–60 | - 1, 2 wk |
CAs: 21
FAs: 28
LOs: 19
45 F/23 M
|
Score of a OHRQoL questionnaire |
| Sharma et al.47 (2021) | Canada | CCS |
Total: 11–18
Mean: 14.9 ± 1.9
|
- 6 mo |
CAs: 37
FAs: 37
44 F/30 M
|
Child oral health impact profile-short form 19 (COHIP-SF 19) |
| Sifakakis et al.16 (2018) | Greece | PCS |
CAs: 13.9 ± 2.0
SLB: 13.6 ± 1.5
|
- Beginning of treatment
- 2 wk
- 1 mo
|
CAs: 8 F/7M
SLB: 9 F/6 M
|
s-PII, s-GI, salivary counts of S. mutans, L. acidophilus, S. sanguinis |
| Srinath et al.42 (2016) | India | PCS |
CAs: 35.0 ± 6.9
FAs: 34.0 ± 7.2
|
- 6 wk
- 6, 12 mo
|
CAs: 12 F/8 M
FAs: 18F/8 M
|
GI, PI, BOP, PD |
| Wang et al.43 (2019) | China | PCS | Total: 20–25 | - 6 mo |
CAs: 7
FAs: 12
CG: 7
|
High-throughput pyrosequencing was performed based on the 16S rRNA gene, Shannon index |
| Zamora-Martínez et al.31 (2021) | Spain | NRCT |
Total: 18–68
Mean: 37.4 ± 14.6
|
- Beginning of treatment
- 6 mo
- End of treatment: 19.6 ± 4.7 mo
|
CAs: 30
FAs: 30
CFAs: 30
LOs: 30
59 F/61 M
|
OHIP-14 questionnaire |
RCT, randomized clinical trial; CAs, clear aligners; FAs, conventional fixed appliances; N/A, not available; PD, probing depth; PI, plaque index; BOP, bleeding on probing; PCR, polymerase chain reaction; RS, retrospective study; F, females; M, males; OHRQoL, oral health related quality of life; DF, fluorescence loss; DFMax, deepest point in the lesion; DR30, plaque surface area; PCS, prospective/cohort study; LOs, lingual orthodontics; SLB, self-ligating brackets; SBI, sulcus bleeding index; GI, gingival index; CSS, cross-sectional study; WSLs, white spots lesions; OH, oral higiene; PBI, papilla bleeding index; AP, appliance; VAS, visual analogic scale; OPG, orthopantomography; PPD, pocket probing depth; CG, group control; REC, gingival recessions; NRCT, non randomizad clinical trial; CFAs, aesthetic brackets; GBI, gingival bleeding index; BPE, basic periodontal exam index; RP, removable positioner; s-PII, simplified plaque index; s-GI, simpified gingival index.
Effect on oral health-related quality of life
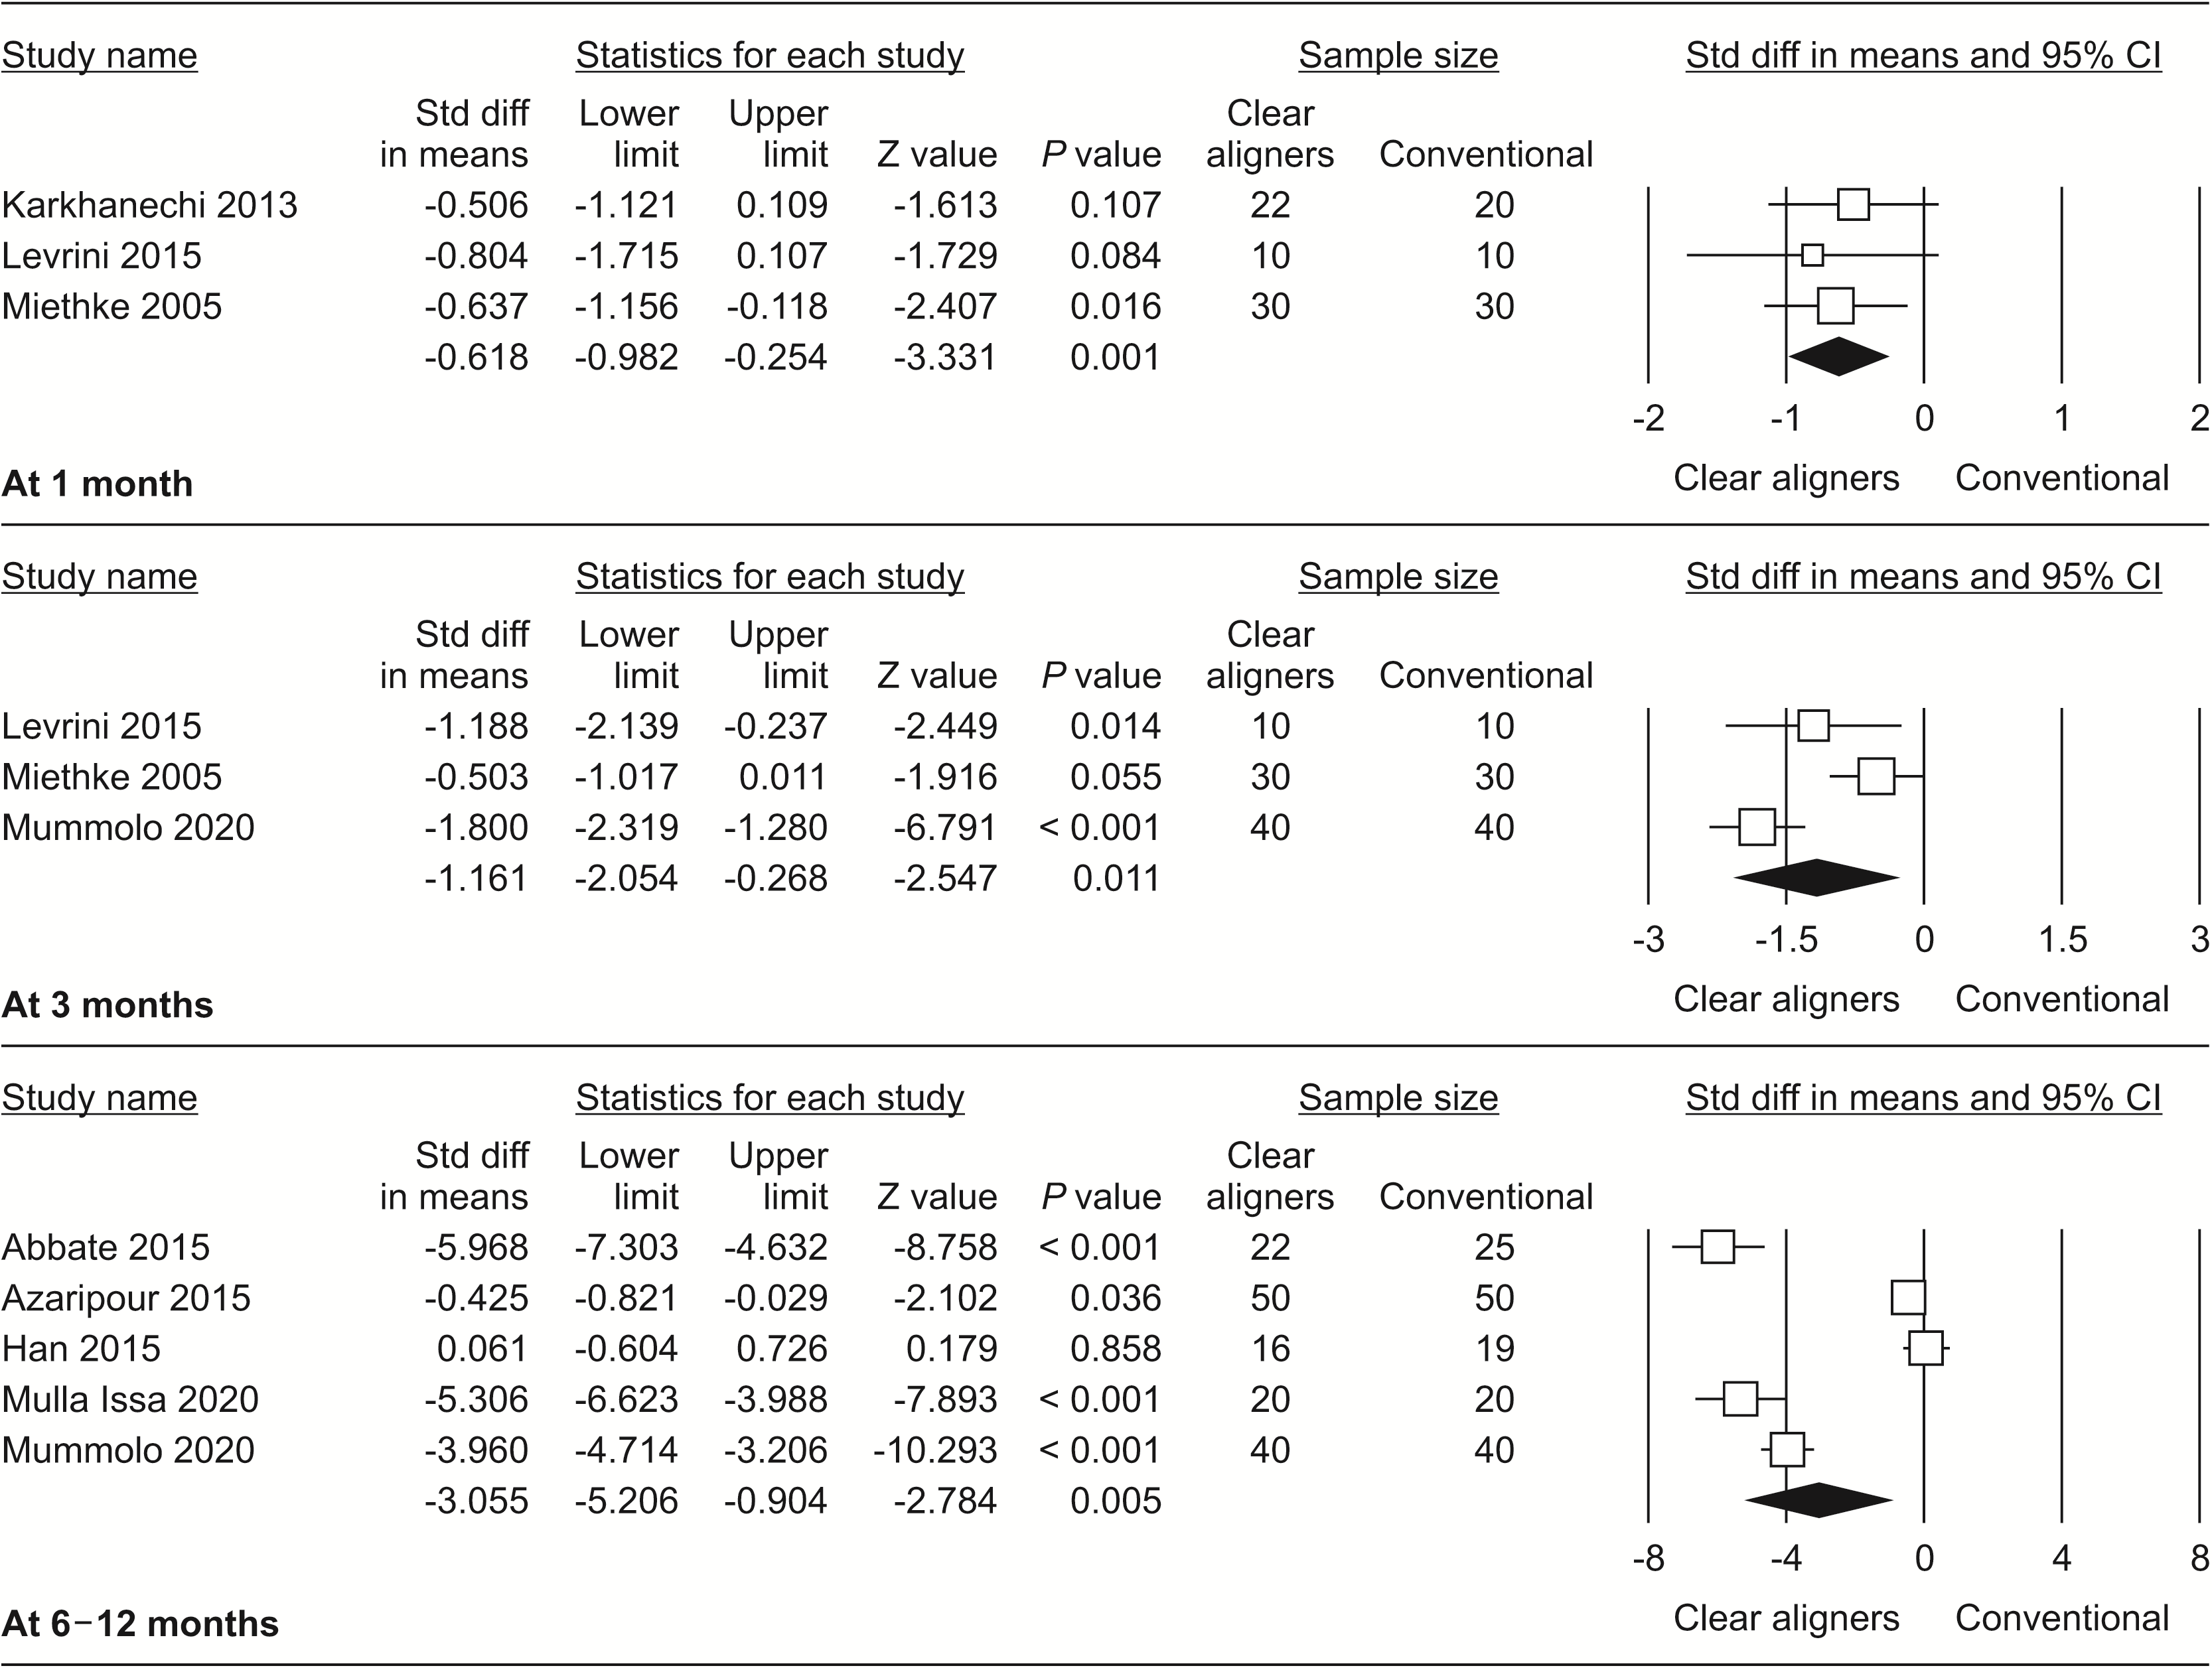
Effect on plaque index
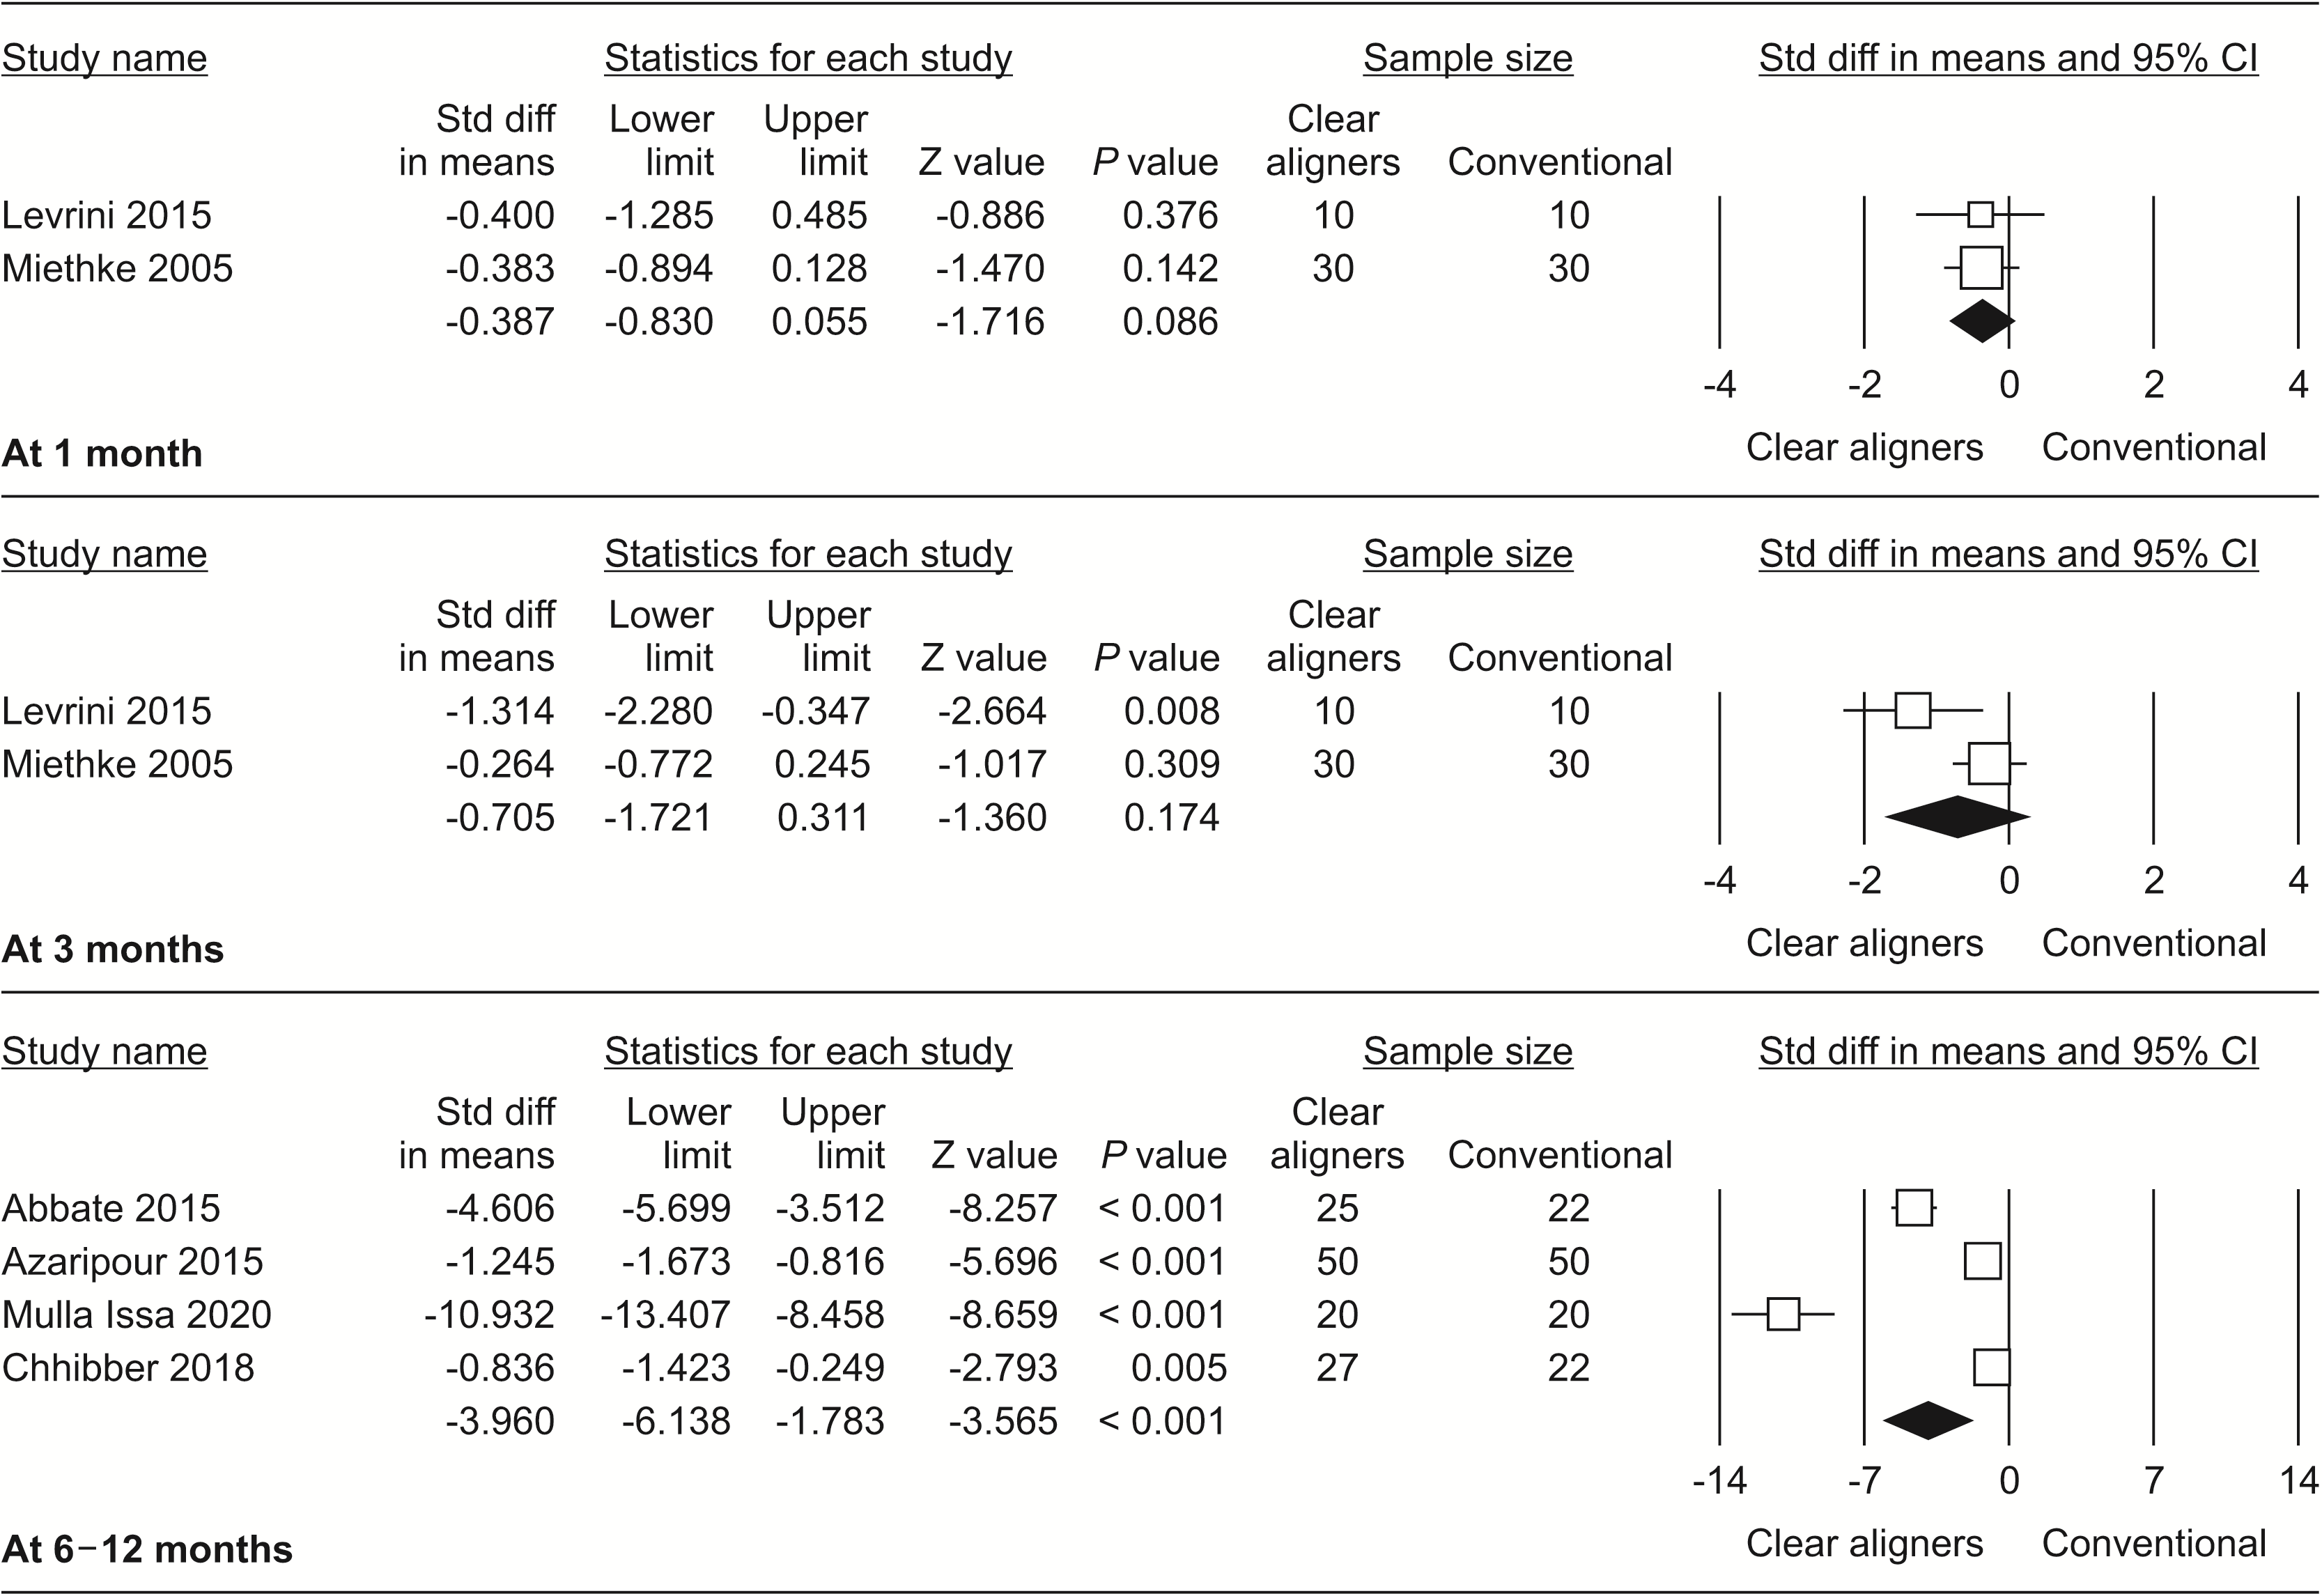
Effect on gingival bleeding
Effect on gingival index
Effect on probing depth
Effect on biofilm mass
Effect on S. mutans concentration
Effect on Lactobacillus concentration
Effect on the onset of white spot lesions
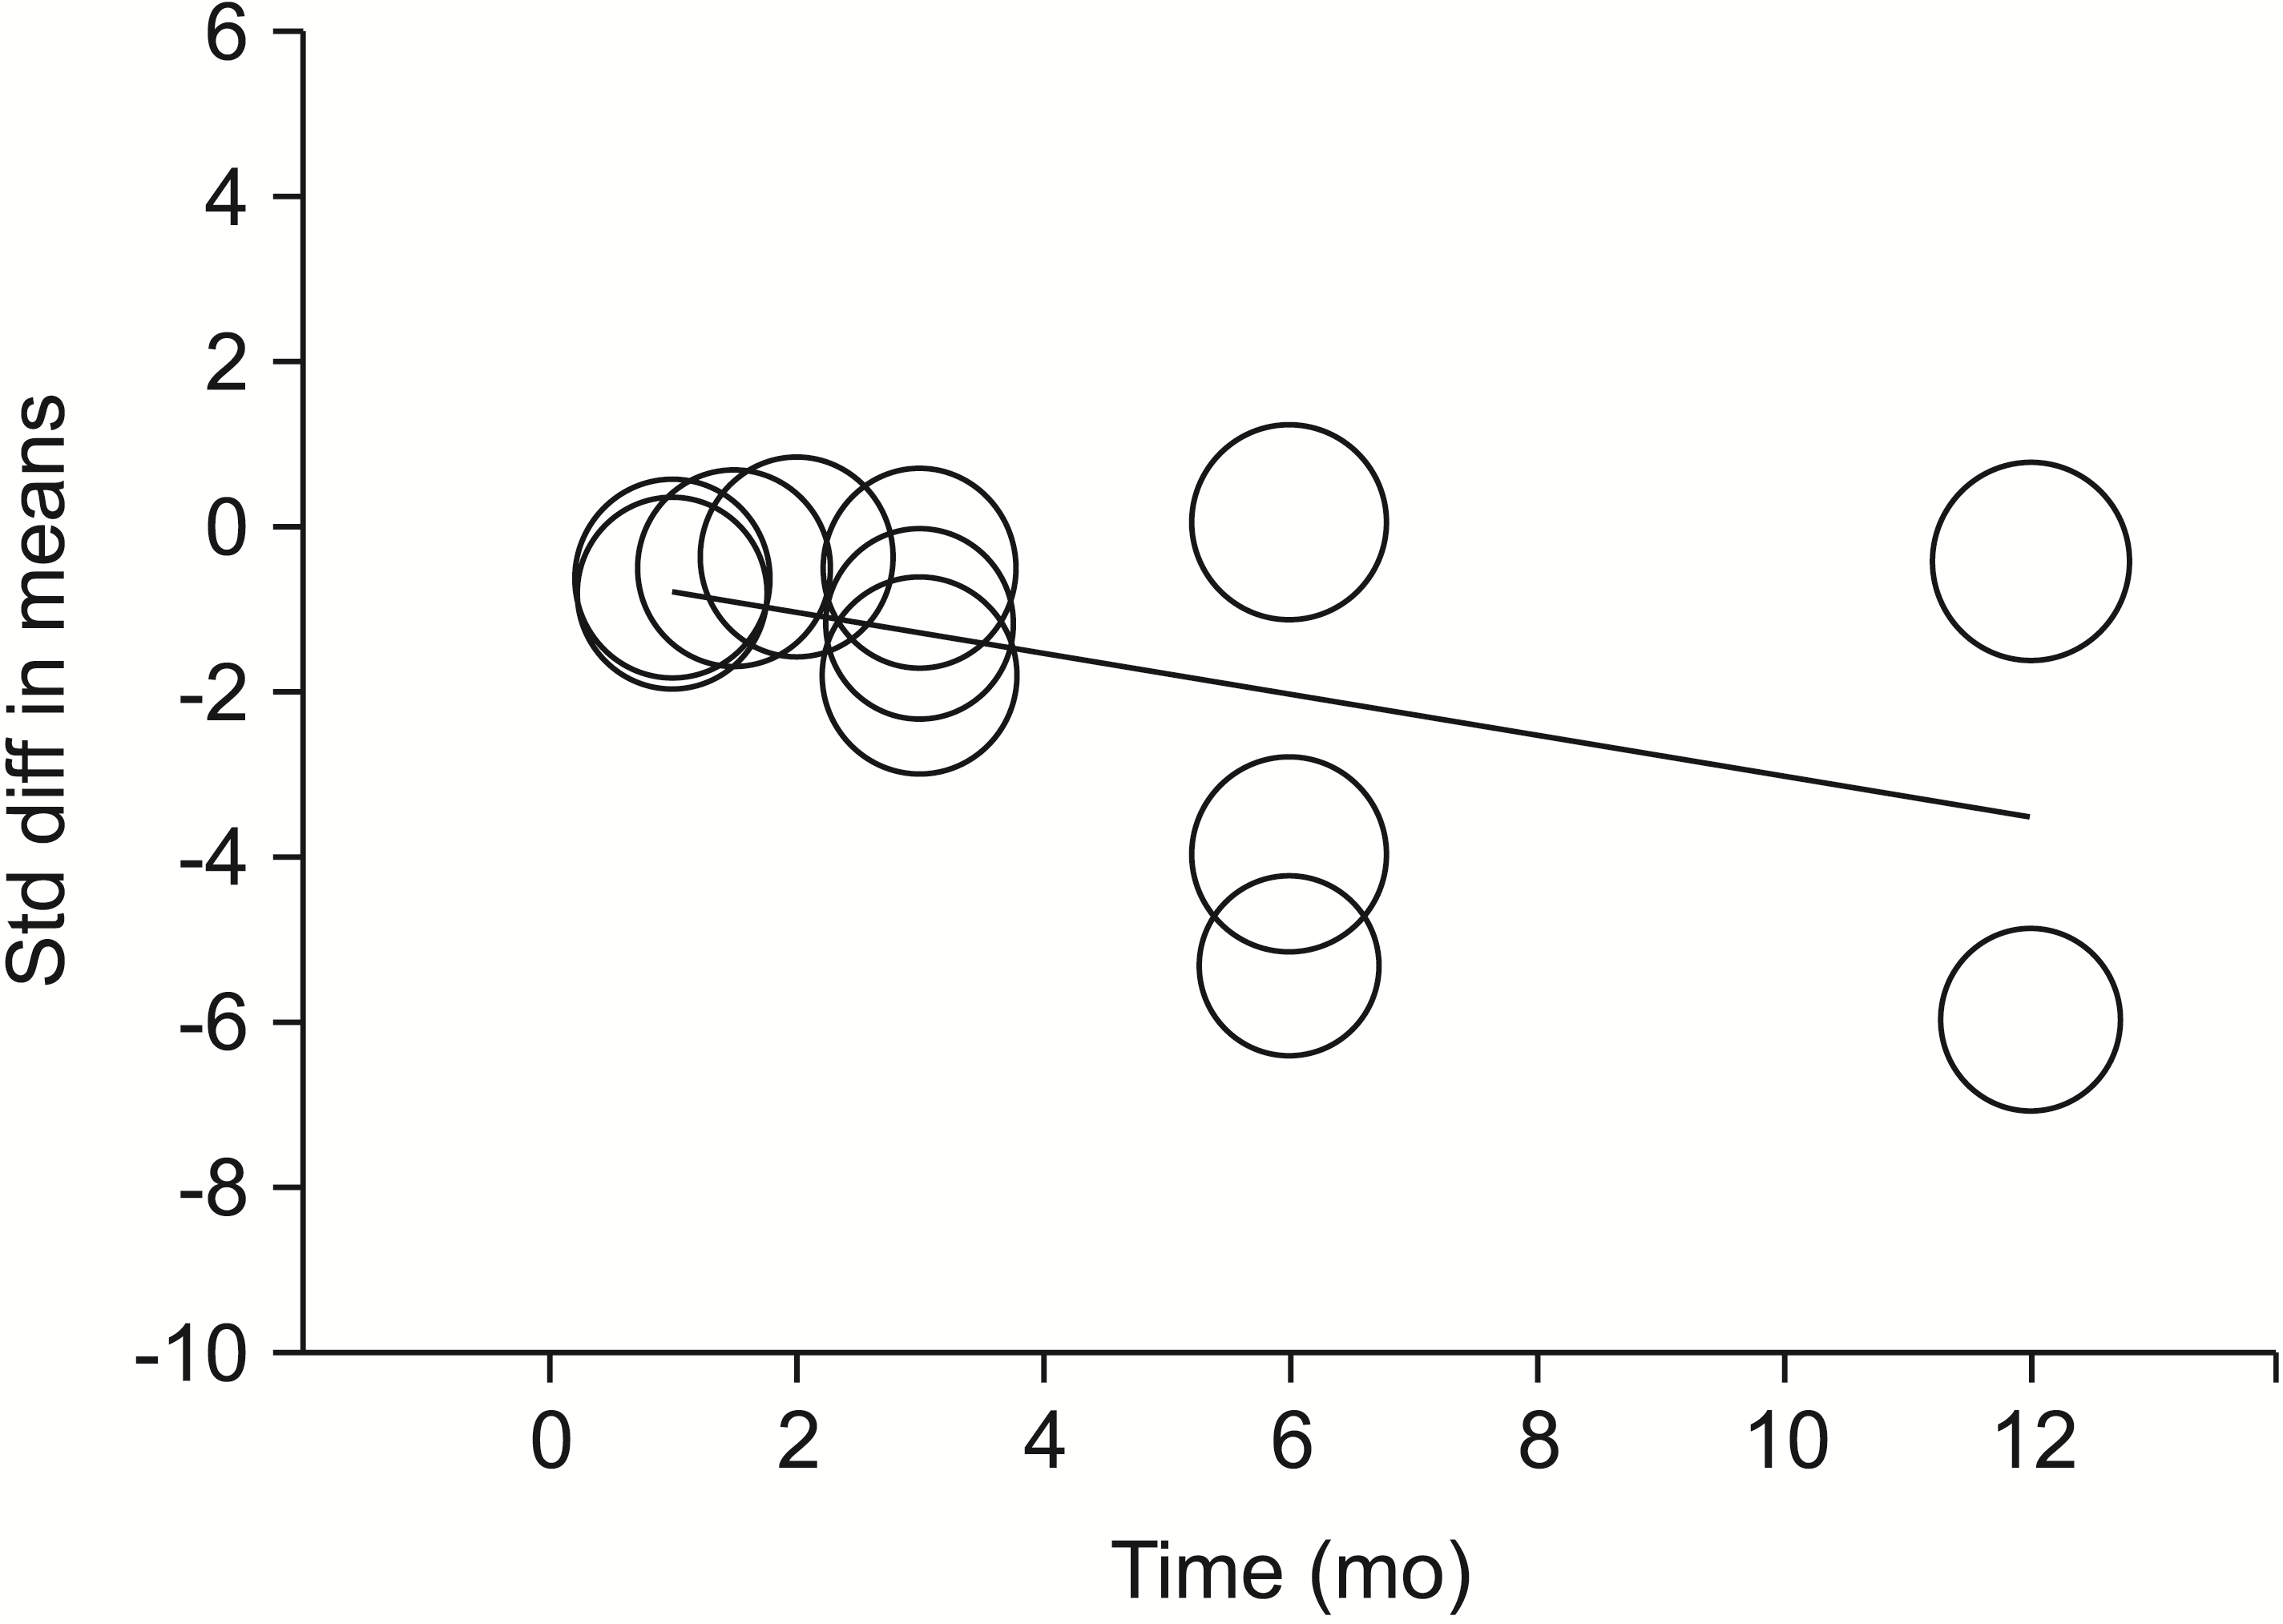
Synthesis of results
Table 3
| Variable | Time point | n | I2 (%) | Measure of effect | Estimation | P value (effect size) | Influence on time |
|---|---|---|---|---|---|---|---|
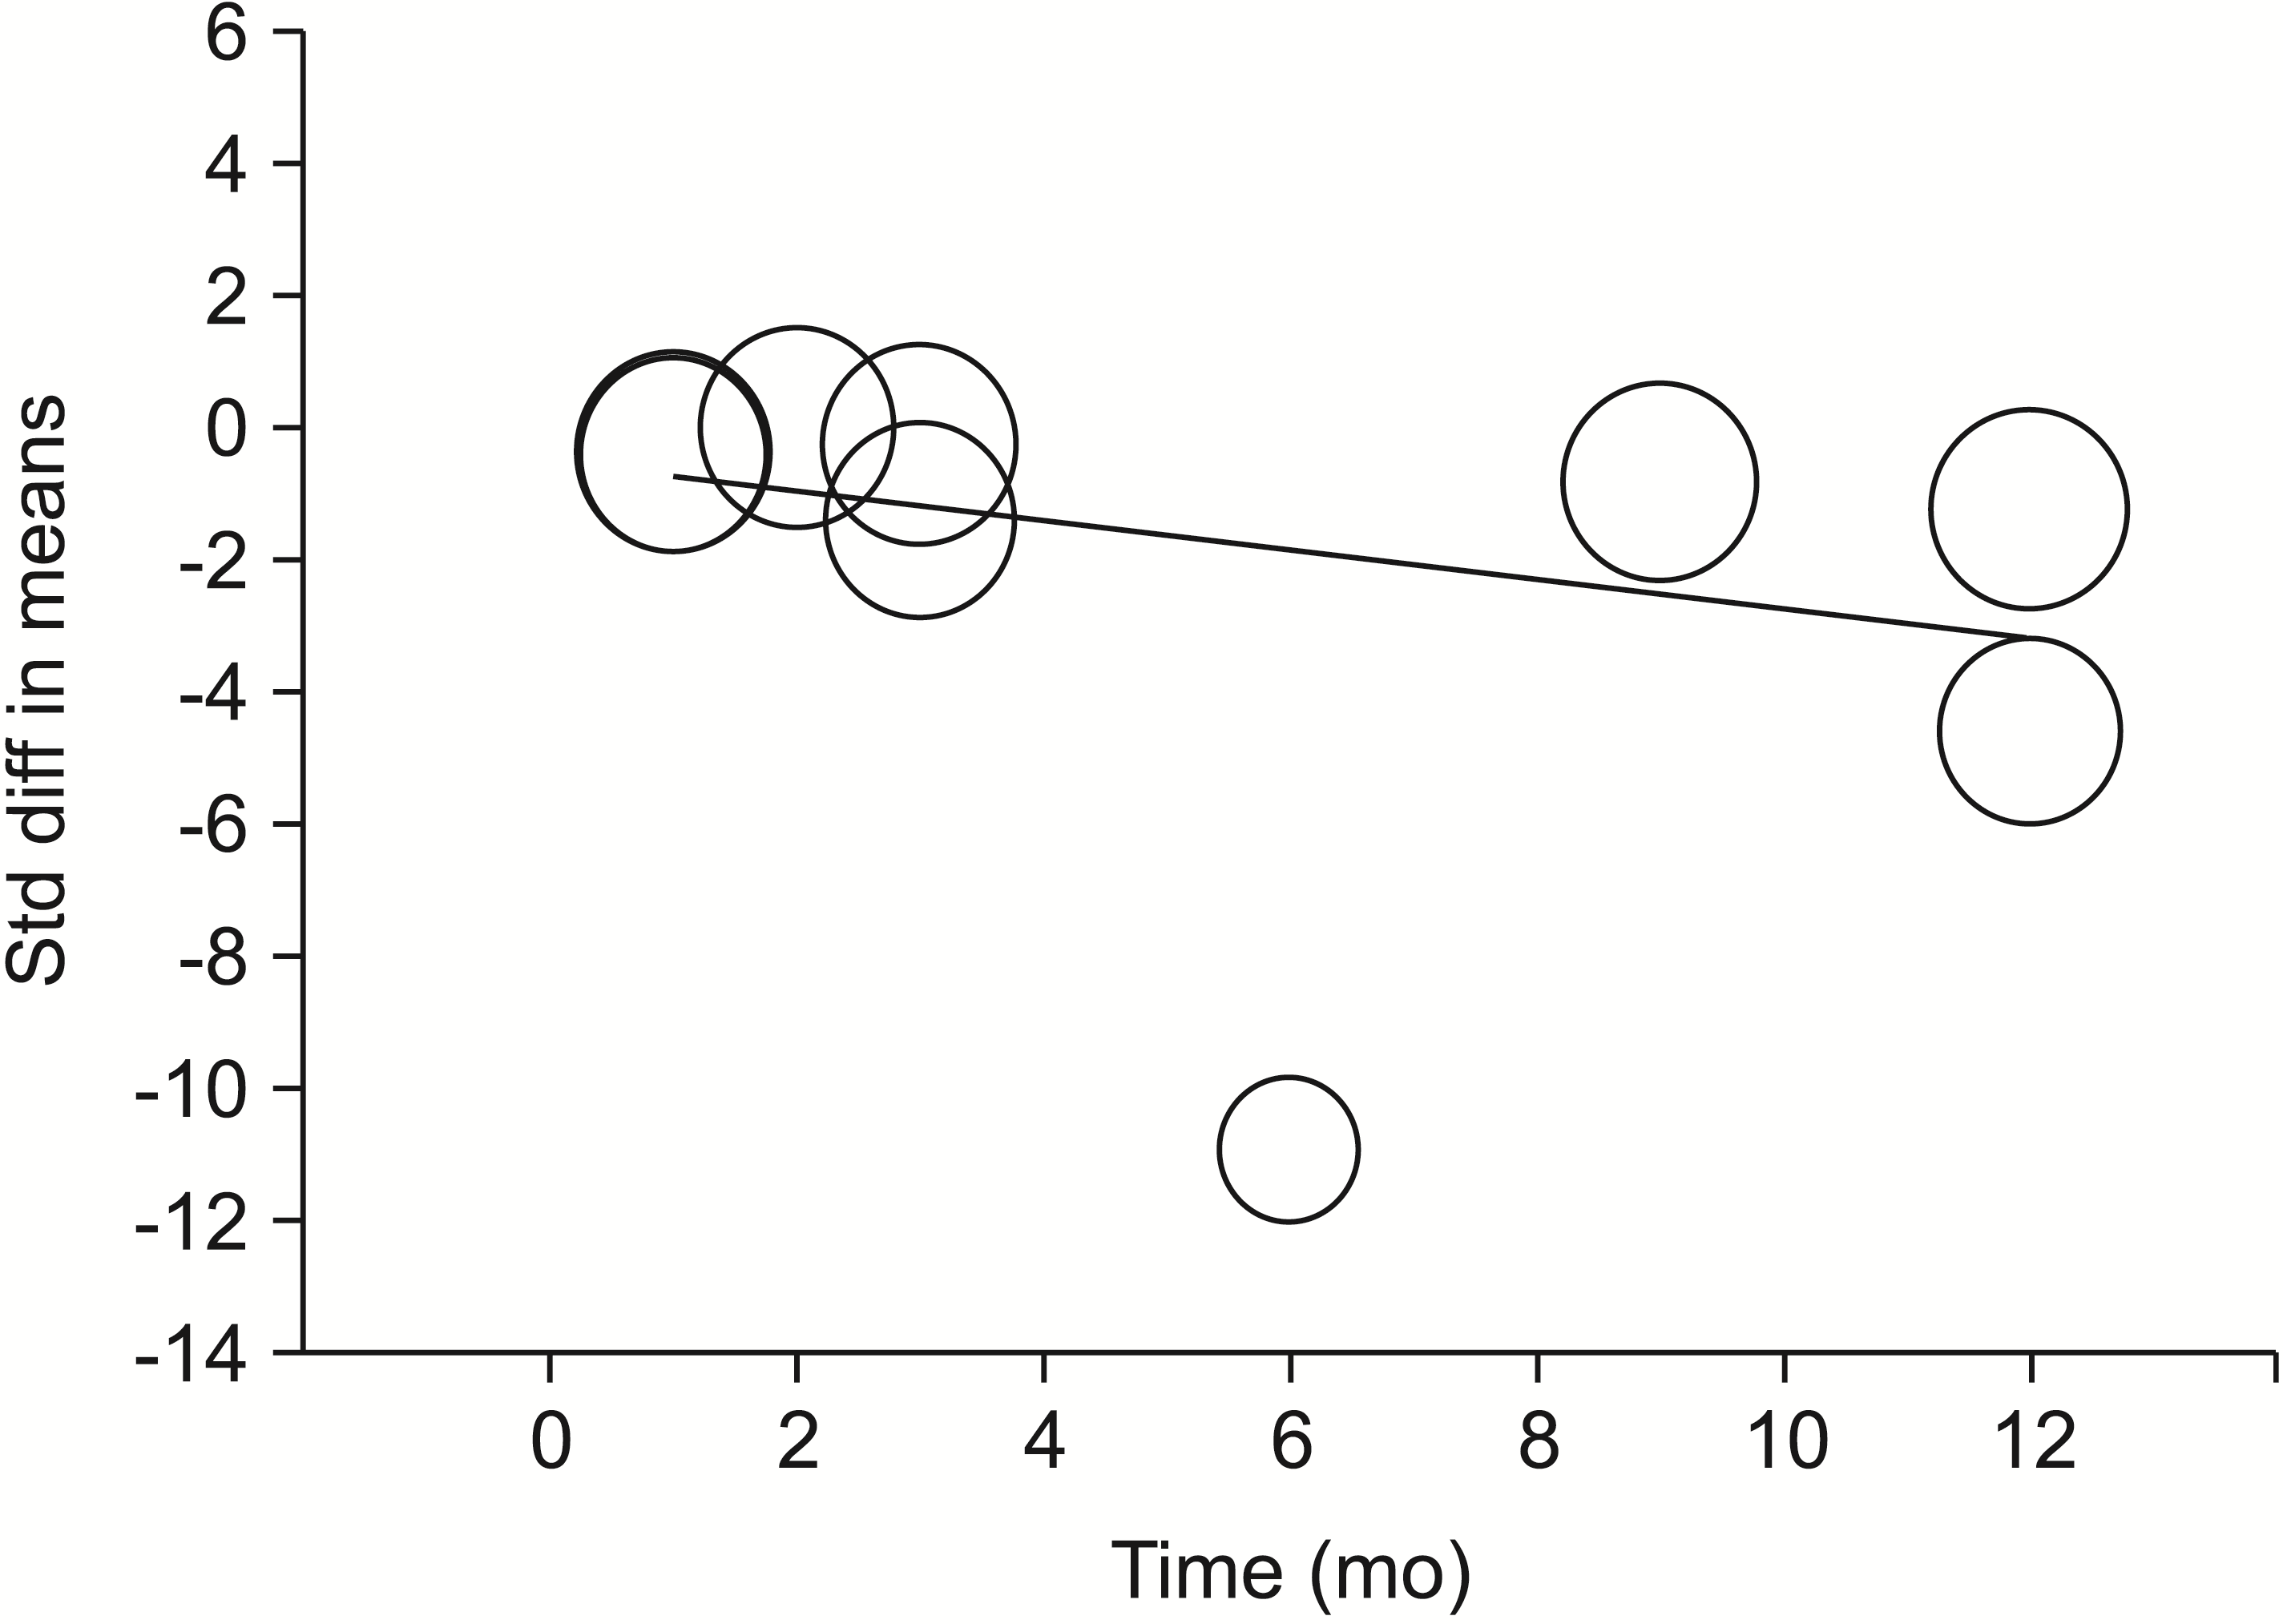
| OHRQoL | 1 wk to 6 mo | 4 | 96.8 | Std diff in means | −1.43 (−3.04 to −0.10) | 0.037 (large) | P value = 0.685 |
| Plaque index | 1 mo | 5 | 0 | Std diff in means | −0.62 (−0.98 to −0.25) | 0.001* (medium) | P value = 0.035* |
| 3 mo | 3 | 83.4 | Std diff in means | −1.61 (−2.05 to −0.27) | 0.011* (large) | ||
| 6–12 mo | 3 | 97.5 | Std diff in means | −3.05 (−5.20 to −0.90) | 0.005* (large) | ||
| Gingival bleeding | 1 mo | 2 | 0 | Std diff in means | −0.387 (−0.83 to −0.06) | 0.086 | P value = 0.031* |
| 3 mo | 2 | 71.9 | Std diff in means | −0.705 (−1.72 to −0.31) | 0.172 | ||
| 6–12 mo | 4 | 96.8 | Std diff in means | −3.96 (−6.13 to −1.78) | < 0.001* (large) | ||
| Gingival index | 6–12 mo | 4 | 86 | Std diff in means | −1.18 (−1.99 to −0.36) | 0.005* (large) | P value = 0.616 |
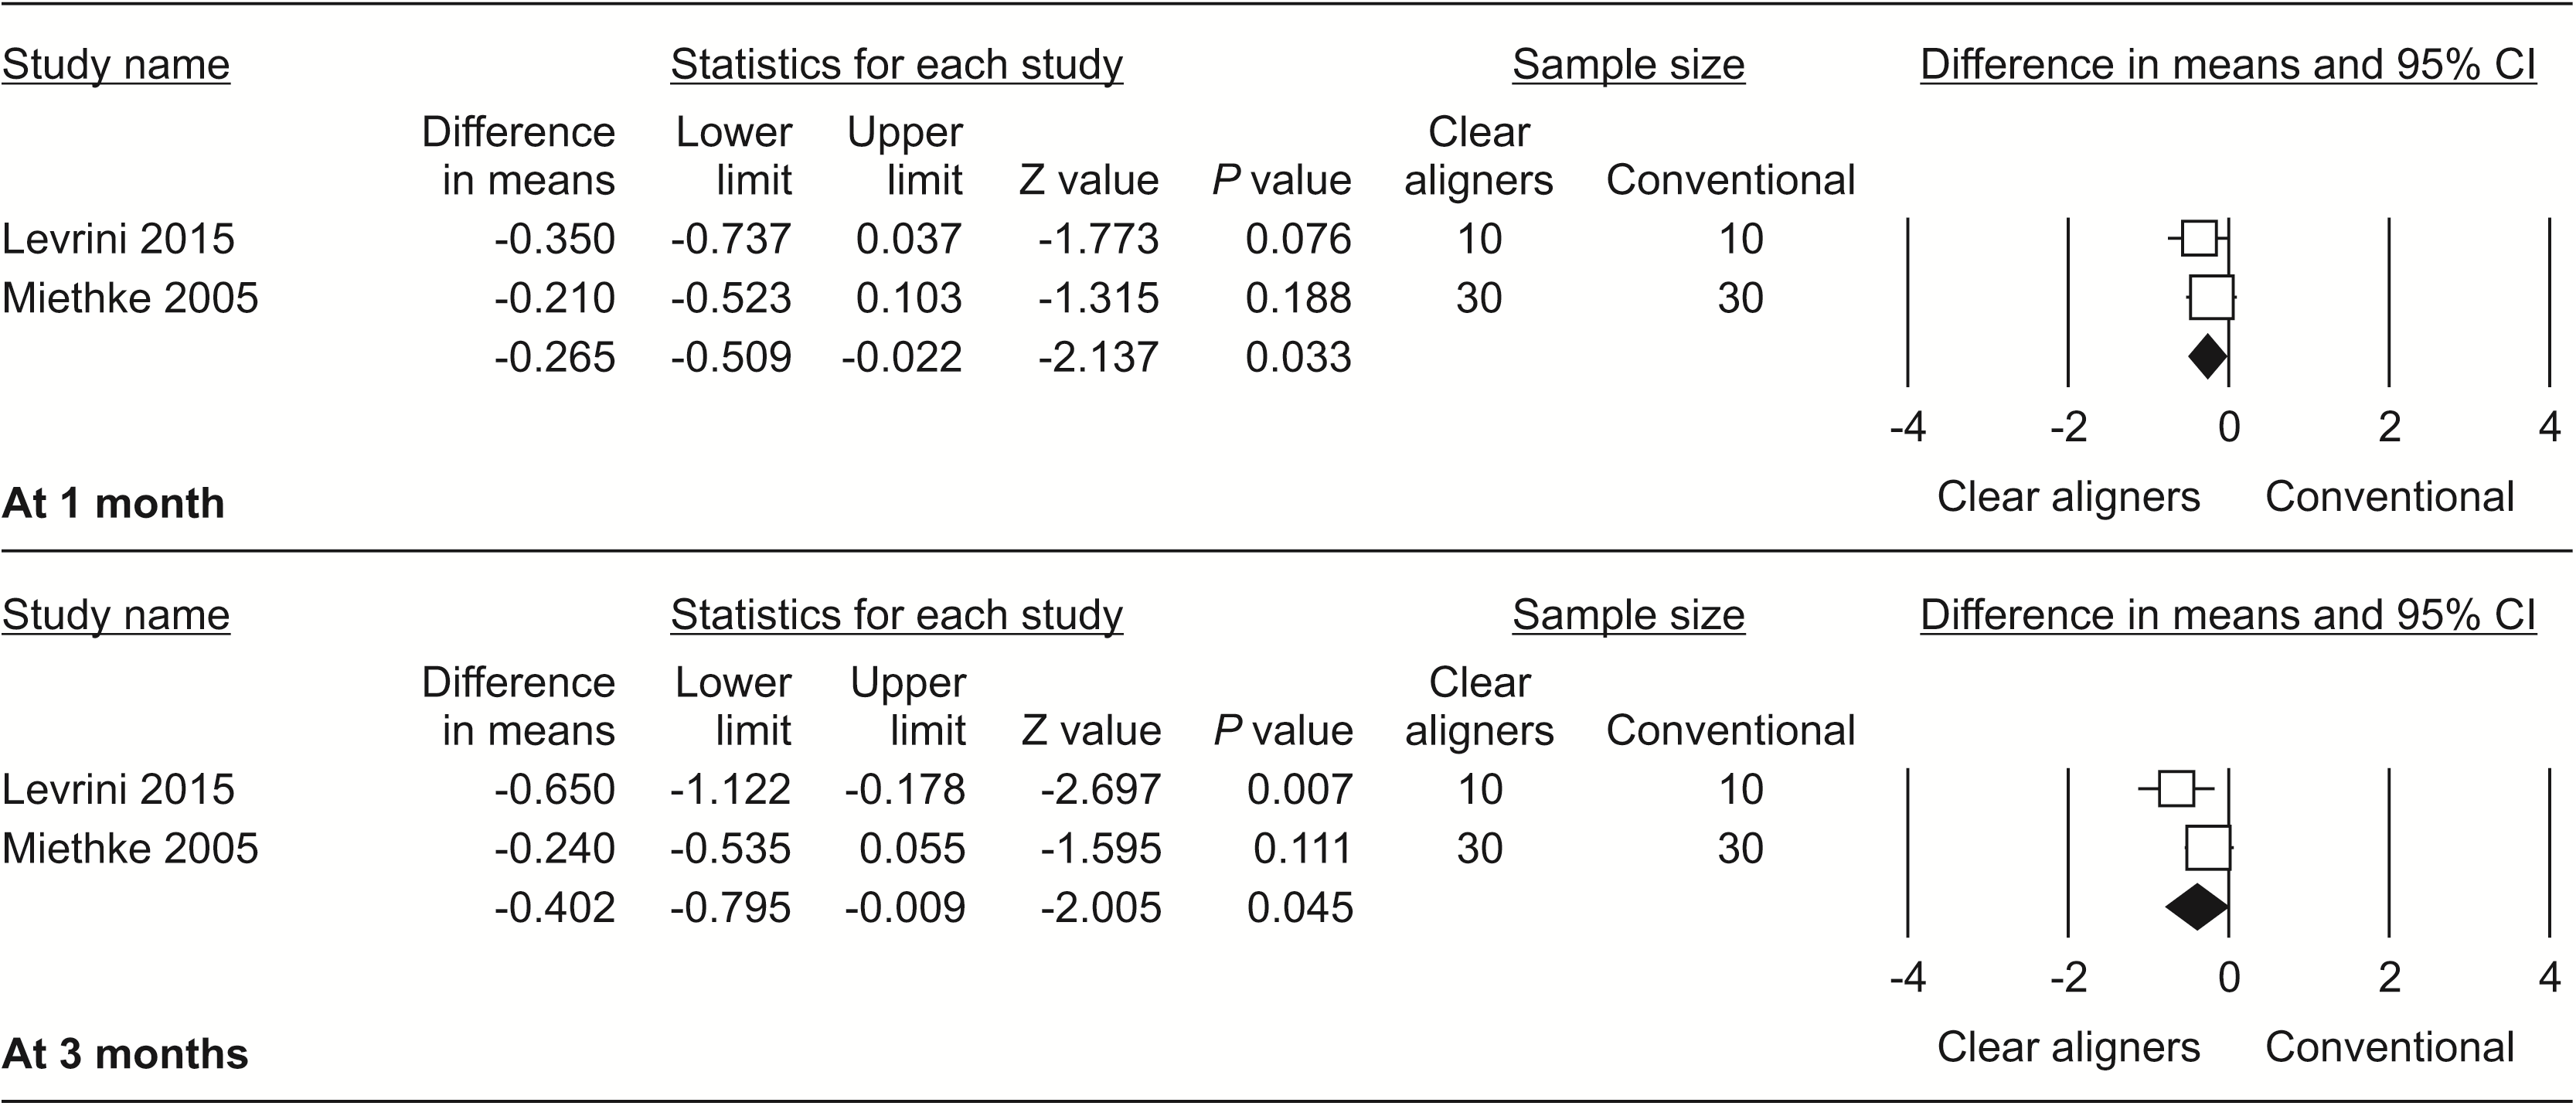
| Probing depth | 1 mo | 2 | 0 | Diff in means (mm) | −0.26 mm (−0.51 to −0.02 mm) | 0.033* | P value = 0.113 |
| 3 mo | 2 | 51.9 | Diff in means (mm) | −0.402 mm (−0.80 to −0.01 mm) | 0.045* | ||
| Biofilm mass | 1 mo | 2 | 8.3 | Std diff in means | −0.60 (−1.17 to −0.03) | 0.040* (medium) | P value = 0.448 |
| S. mutans concentration | 4 yr 12 mo | 2 | 0 | Odds ratio | 0.21 (0.03–1.37) | 0.104 | P value = 0.681 |
| Lactobacillus concentration | 4 yr 12 mo | 2 | 0 | Odds ratio | 0.32 (0.03–3.18) | 0.330 | P value = 0.803 |
| White spot lesions | 9 yr 24 mo | 2 | 62.3 | Risk ratio | 0.10 (0.02–0.42) | 0.002* (large) | - |


 PDF
PDF Citation
 Print
Print






 XML Download