

 PDF
PDF Citation
 Print
Print


INTRODUCTION
Sarcopenia is defined as a loss of skeletal muscle strength, mass, and function [1]. Sarcopenia was first introduced by Rosenberg more than 30 years ago, and it has recently been recognized as a disease and included in the International Classification of Diseases, 10th Revision [2]. Sarcopenia is a prognostic factor that affects the outcomes of liver transplantation (LT), as well as various cancers [345] and chronic diseases [67]. Sarcopenia is also reported to be associated with waitlist mortality [8] and posttransplant outcomes [910] in patients with end-stage liver disease (ESLD) who require LT.
Because various imaging modalities and cut-off values are used to diagnose sarcopenia, a wide range of prevalence rates, from 22.2% to 70%, has been reported [11]. Although a clear gold standard for diagnosing sarcopenia has not been established, the third lumbar (L3)-skeletal muscle index (SMI) using scanning is the calculation most widely used to evaluate sarcopenia [1213]. CT scans are the best imaging modality to evaluate preoperative sarcopenia in LT recipients because they are not only a powerful tool to accurately assess muscle mass but are also routinely used to evaluate ESLD patients [1415]. The first regions in which a decrease in muscle mass is detected with aging are the abdominal and thigh muscles [1617], and studies have reported that the thigh muscles reflect whole-body musculature better than abdominal muscles [16]. The abdominal muscles, represented by L3-SMI, are nonetheless widely used to evaluate sarcopenia, whereas thigh SMI has received little attention. The mid-thigh (MT) is mainly used to evaluate the thigh muscle, but thigh CT is required to measure the MT-SMI [18]. One study demonstrated that SMI using the upper thigh (UT), which is included in abdominal-pelvic CT coverage, showed a high correlation with MT- and L3-SMI [19]. Therefore, the UT has potential use for clinically evaluating sarcopenia, and it has the advantage of not requiring any additional examinations because it is already included in abdominal-pelvic CT.
The purposes of this study were to determine an optimal cut-off value for UT-SMI to diagnose sarcopenia and to investigate correlations between sarcopenia diagnosed by UT-SMI and the clinical outcomes of LT recipients.
METHODS
This study was approved by the Institutional Review Board of Samsung Medical Center (No. 2022-04-023-001). Because it was a retrospective observational study of data from patient medical records, patient consent was not required. The study was performed in accordance with the Declaration of Helsinki.
Study population and data collection
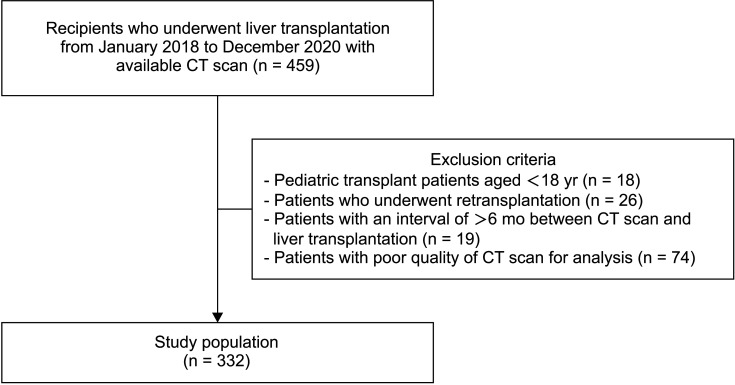
From January 2018 to December 2020, 459 patients underwent living donor LT (LDLT) or deceased donor LT (DDLT) in Samsung Medical Center. The inclusion criteria were patients who underwent LDLT or DDLT during the above period and had a CT scan that included both the third lumbar and UT levels. Exclusions comprised 18 pediatric transplant patients younger than 18 years, 26 patients who underwent re-transplantation, 19 patients with an interval of more than 6 months between CT scan and LT, and 74 patients with CT scans inappropriate for analysis. Therefore, 332 LT recipients were included in this study (Fig. 1).
The pretransplant variables were sex, age, body mass index (BMI), preoperative laboratory results, model for ESLD (MELD) score, donor type, etiology, progression type of liver failure, presence of hepatocellular carcinoma (HCC), and preoperative conditions related to complications of liver cirrhosis, such as hepatic encephalopathy, varices, ascites, and hepatorenal syndrome. The peri- and posttransplant variables were cold ischemic time, warm ischemic time, operation time, hospital stay (days), major complications within 30 days after transplantation, rejection, anastomosis complications, and infection. Major complications were defined as Clavien-Dindo classification grade III to V events. Infection was defined to include all viral, bacterial, and fungal infections that occurred after transplantation.
Assessment of sarcopenia
As the L3-SMI cut-off values for sarcopenia, 42 cm2/m2 for male and 38 cm2/m2 for female suggested by the Japan Society of Hepatology (JSH) were chosen in consideration of racial differences [20]. When we applied the JSH cut-off values to our cohort, we found a statistically significant difference in both patient and graft survival between the sarcopenia and non-sarcopenia groups (Supplementary Fig. 1). The correlation between UT-SMI and L3-SMI was analyzed according to sex, and each optimal cut-off value was calculated by analyzing the receiver operating characteristic (ROC) curve for the selected L3-SMI and using the Youden index.
Image analysis
The median time between preoperative CT and LT was 37 days (interquartile range [IQR], 22–85 days). Preoperative CT scans were collected from the image archiving system in Samsung Medical Center. The level of skeletal muscle area (SMA) is illustrated in Supplementary Fig. 2. SMA was normalized to the square of the height and is reported as the SMI. The program used in this study was developed in Department of Radiology at Samsung Medical Center and is designed to calculate the area by classifying subcutaneous fat, muscle, and visceral fat using the Hounsfield unit (HU) of the image pixels and fuzzy c-means clustering algorithms. Semiautomatic software sets the boundaries of muscles and calculates the area of each other part. The HU thresholds of specific areas were entered as reported in previous studies to measure cross-sectional muscle areas: –29 to 150 (skeletal muscle) [21]. The L3 level was defined as the first axial level at which the spinous process, the standard landmark of the abdominal muscle group, was clearly demonstrated [22]. The UT level was defined as the inferior tip of the ischial tuberosity on the right, as defined in a study that revealed associations among UT, L3, and MT for sarcopenia evaluation [19]. All UT-SMI measurements were performed on the right side.
Statistical analysis
Data are expressed as mean ± standard deviation (SD) or median (IQR) for continuous variables and as frequency (percentage) for categorical variables. Baseline characteristics and outcomes were compared using the Mann-Whitney U-test for continuous variables and the chi-square test for categorical variables. Patient and graft survival rates in the sarcopenia and non-sarcopenia groups were estimated using the Kaplan-Meier method, and survival curves for those rates were compared with the log-rank test. The correlation between L3-SMI and UT-SMI was analyzed using the Pearson correlation coefficient. The strength of the correlation was classified as follows: r-values are very high (≥0.90), high (0.70–0.89), moderate (0.50–0.69), low (0.30–0.49), and negligible (0.00–0.29) [23]. The optimal cut-off value for using UT-SMI to diagnose sarcopenia was estimated using the ROC curve analysis with the Youden index. A multivariate Cox regression analysis was performed to determine independent prognostic factors of survival. A P-value of <0.05 was considered statistically significant. All statistical analyses were performed using IBM SPSS 25.0 for Windows (IBM Corp.).
RESULTS
Outcomes of sarcopenia by L3-SMI and correlation between L3-SMI and UT-SMI according to sex
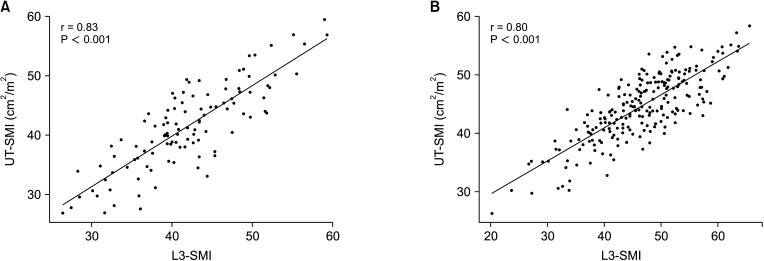
In our cohort, 28.0% (93 of 332) of patients had sarcopenia according to the selected L3-SMI cut-off value. The Kaplan-Meier curves and log-rank tests showed that patient survival was statistically significantly lower in the L3-SMI sarcopenia group (75.9%; mean, 40.9 months; 95% confidence interval [CI], 36.8–45.1 months) than in the L3-SMI non-sarcopenia group (87.8%; mean, 46.6 months; 95% CI, 44.5–48.4 months) (P = 0.008) (Supplementary Fig. 1A) and graft survival was also statistically lower in the L3-SMI sarcopenia group (82.6%; mean, 44.4 months; 95% CI, 40.7–48.1 months) than in the L3-SMI non-sarcopenia group (93.0%; mean, 48.8 months; 95% CI, 47.3–50.3 months) (P = 0.008) (Supplementary Fig. 1B). The scatterplot for females shows that the UT-SMI and L3-SMI values had a statistically significant, positive correlation (r = 0.83, P < 0.001) (Fig. 2A). The scatterplot for males also shows that the UT-SMI and L3-SMI values had a statistically significant, positive correlation (r = 0.80, P < 0.001) (Fig. 2B).
ROC curve analysis for the optimal sex-specific cut-off value of UT-SMI
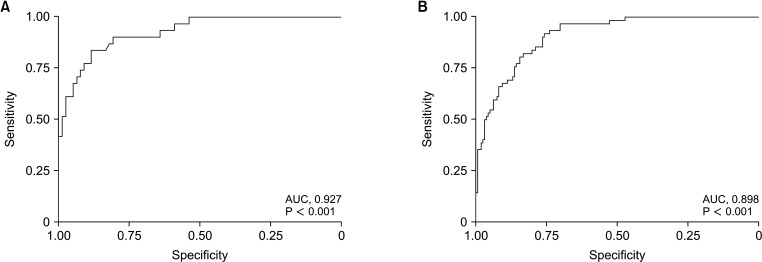
A ROC curve analysis was performed to calculate the optimal UT-SMI cut-off values for sarcopenia in males and females. In females, the optimal UT-SMI cut-off value for sarcopenia was 38.3 cm2/m2, with an area under the curve (AUC) of 0.927 (95% CI, 0.876–0.970; P < 0.001) (Fig. 3A); in males, it was 46.7 cm2/m2, with an AUC of 0.898 (95% CI, 0.858–0.937; P < 0.001) (Fig. 3B).
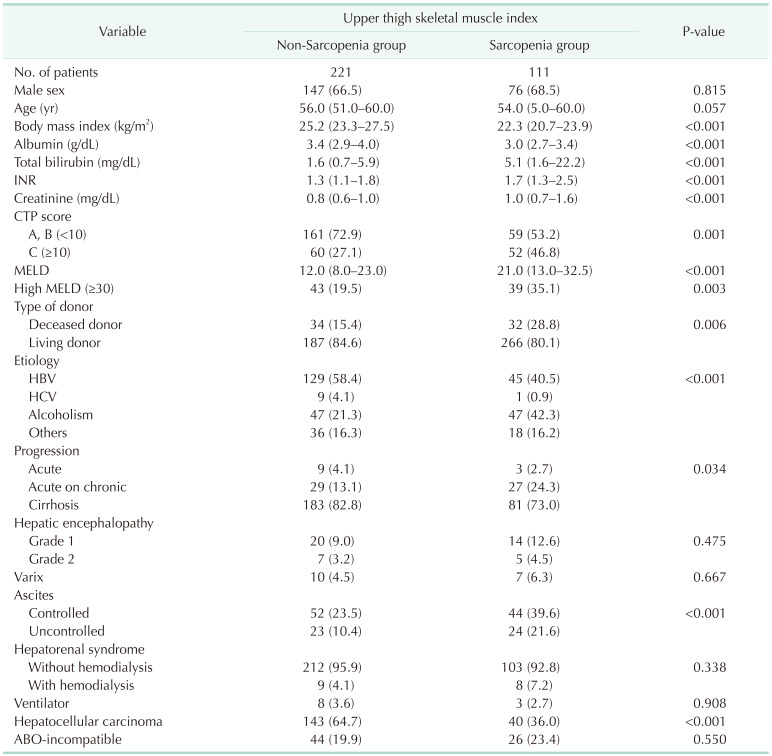
Comparison of the UT-SMI sarcopenia and non-sarcopenia groups in preoperative baseline characteristics and peri- and postoperative outcomes
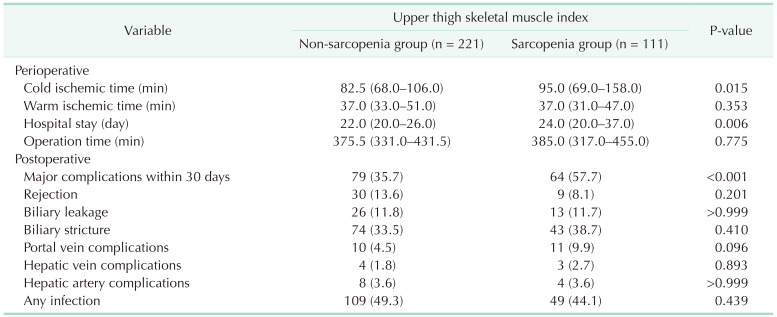
Of the 332 patients in our cohort, 111 were in the UT-SMI sarcopenia group, which was 33.4%. Table 1 shows the pretransplant baseline characteristics between the sarcopenia and non-sarcopenia groups. The sarcopenia group had lower BMI (median, 22.3 kg/m2; IQR, 20.8–23.9 kg/m2; P < 0.001) and albumin (median, 3.0 g/dL; IQR, 2.7–3.4 g/dL; P < 0.001) and higher total bilirubin (median, 5.1 mg/dL; IQR, 1.6–22.2 mg/dL; P < 0.001) and international normalized ratio (median, 1.7; IQR, 1.3–2.5; P < 0.001) than the non-sarcopenia group. The sarcopenia group also had a higher Child-Turcotte-Pugh score C (46.8% vs. 27.1%, P = 0.001) and a higher high MELD score (35.1% vs. 19.5%, P = 0.003) than the non-sarcopenia group. In etiology, the sarcopenia group had a lower rate of HBV (40.5% vs. 58.4%) and a higher rate of alcoholism (42.3% vs. 21.3%) than the non-sarcopenia group (P < 0.001). The sarcopenia group had a lower rate of HCC (36.0% vs. 64.7%) than the non-sarcopenia group (P < 0.001) and more deceased donors (28.8% vs. 15.4%) than the non-sarcopenia group (P = 0.006). In the perioperative results, the sarcopenia group had significantly longer cold ischemic time (median, 95.0 minutes; IQR, 69.0–158.0 minutes; P = 0.015) and hospital stay (median, 24.0 days; IQR, 20.0–37.0 days; P = 0.006). In the postoperative results, the sarcopenia group had significantly higher frequency of major complications within 30 days after LT (57.7% vs. 35.7%, P < 0.001) (Table 2).
Comparison of overall patient and graft survival between the UT-SMI sarcopenia and non-sarcopenia groups
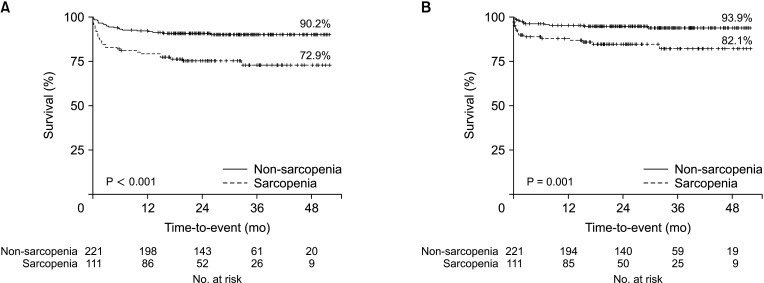
Overall patient survival between the UT-SMI sarcopenia and non-sarcopenia groups was significantly lower in the sarcopenia group (72.9%; mean, 39.8 months; 95% CI, 35.9–43.8 months) than in the non-sarcopenia group (90.2%; mean, 47.4 months; 95% CI, 45.6–49.3 months) (P < 0.001) (Fig. 4A). Overall graft survival was also significantly lower in the sarcopenia group (82.1%; mean, 44.2 months; 95% CI, 40.8–47.6 months) than in the non-sarcopenia group (93.9%; mean, 49.2 months; 95% CI, 47.8–50.7 months) (P = 0.001) (Fig. 4B).
Independent prognostic factors for overall survival
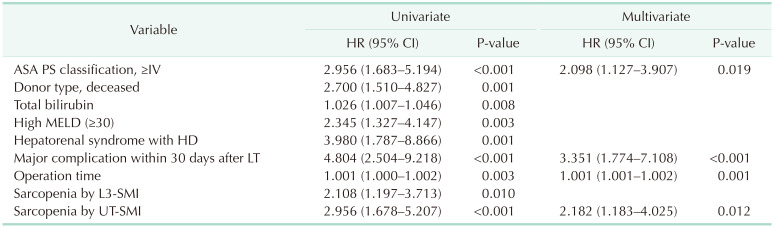
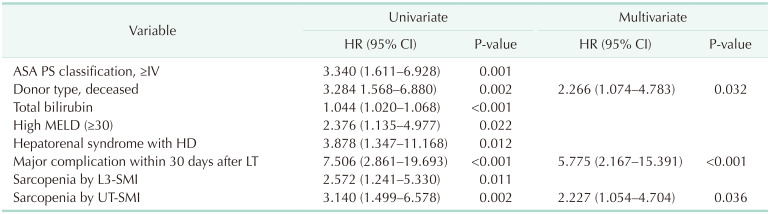
In the multivariable Cox regression analysis, the significant prognostic factors for overall survival were a high American Society of Anesthesiology physical status classification (≥IV) (hazard ratio [HR], 2.098; 95% CI, 1.127–3.907; P = 0.019), major complication within 30 days after LT (HR, 3.351; 95% CI, 1.774–7.108; P < 0.001), operation time (HR, 1.001; 95% CI, 1.001–1.002; P = 0.001), and sarcopenia diagnosed by UT-SMI (HR, 2.182; 95% CI, 1.183–4.025; P = 0.012) (Table 3). DDLT (HR, 2.266; 95% CI, 1.074–4.783; P = 0.032), a major complication within 30 days after LT (HR, 5.775; 95% CI, 2.167–15.391; P < 0.001), and sarcopenia diagnosed by UT-SMI (HR, 2.227; 95% CI, 1.054–4.704; P = 0.036) were significant prognostic factors of overall graft survival in multivariable Cox regression analysis (Table 4). Sarcopenia diagnosed by UT-SMI was a significant prognostic factor for both patient survival and graft survival, whereas sarcopenia diagnosed by L3-SMI was not.
DISCUSSION
In this study, we investigated the correlation between sarcopenia (diagnosed by the previously known L3-SMI and diagnosed with the newly calculated UT-SMI cut-off value) and the outcomes of LT recipients. We hypothesized that sarcopenia diagnosed by UT-SMI would have as much clinical significance for patient and graft survival after LT as sarcopenia diagnosed by L3-SMI. We found that both the L3-SMI sarcopenia group and the UT-SMI sarcopenia group had lower patient and graft survival after LT than the respective non-sarcopenia groups. Interestingly, sarcopenia diagnosed by UT-SMI was an independent prognostic factor of overall survival after LT in our Cox regression multivariable analysis, whereas sarcopenia diagnosed by L3-SMI was not.
Calculating the L3-SMI from CT scans is the most widely used method to evaluate sarcopenia in patients with various cancers and chronic diseases, as well as LT patients. Although groups such as the European Working Group on Sarcopenia in Older People and the Asian Working Group for Sarcopenia (AWGS) have defined sarcopenia and proposed criteria for diagnosing and evaluating it [1242526], they did not include criteria for calculating the SMI from CT scans. Several groups have suggested optimal cut-off values for the L3-SMI, but no gold standard has been established. According to the literature, cut-off values have been proposed through 3 methods: less than the 5th percentile of the population, 2 SDs from the healthy population, and a mortality-associated cut-off value. This study used the mortality-related cut-off value calculated with the ROC curve from a previous study.
Many research results indicate that L3-SMI correlates significantly with the prognosis of patients with various chronic diseases and the prognosis of patients after surgery. However, various cut-off values are used in research, and no gold standard has been established, so it is difficult to apply clinically. The most widely used and cited cut-off values for LT patients are 50 cm2/m2 for males and 39 cm2/m2 for females, as suggested by Carey et al. [21] in 2017. That was a large, multicenter study conducted in 5 North American liver transplant centers and reported the best correlation with waitlist mortality in patients with ESLD. However, in a validated study, Kappus et al. [27] could not confirm the previously presented link between those sarcopenia criteria and waitlist mortality, presumably because the study population was racially diverse. Racial differences affect body composition. Asians have less muscle mass and are more prone to age-related muscle loss than people from other racial groups. AWGS released a consensus report in 2014 and an updated version in 2019, but neither document contained SMI cut-offs [2426]. In 2016, the JSH published guidelines for sarcopenia in liver disease applicable to the Asian population [20]. The JSH cut-off values for L3-SMI calculated by CT are ≤42.0 cm2/m2 for males and ≤38.0 cm2/m2 for females. Because the JSH cut-off values are the study standard for Asian subjects, they were used in this study.
For SMI evaluation, abdominal CT has been preferred in most studies for sarcopenia [13]. Because it is used often in clinical practice, abdominal CT has the advantage of being easy to review in a retrospective study. However, some studies have used thigh CT to study sarcopenia [18]. In several studies, MT imaging was found to be a good predictor of whole-body skeletal muscle mass, and 1 study reported that MT muscle area had a stronger association with total body muscle volume than L1–L5 lumbar muscle [1628]. Another report found that the thigh muscles are lost before other muscles during aging. Among them, the thigh compression and recovery muscles, which mainly contain fast-twitch muscle fibers, atrophy faster than other muscles [29]. However, because the MT is not included in the range of a general abdominal-pelvic CT, using that calculation has clinical limitations. Ko et al. [19] demonstrated a high correlation among L3-SMI, MT-SMI, and UT-SMI values and presented UT-SMI as a reliable and robust method. Accordingly, we decided to investigate the correlation between sarcopenia diagnosed using UT-SMI and patient outcomes after LT. As we hypothesized, UT-SMI showed better correlations with patient outcomes than L3-SMI in LT patients. LT patients routinely receive abdominal-pelvis CT that includes the UT in its lower range before and after surgery, making it easy to evaluate both L3-SMI and UT-SMI.
Sarcopenia progression can be caused by aging, chronic disease, and malnutrition [30]. In this study, the sarcopenia group had lower BMI and albumin than the non-sarcopenia group, and the most common etiology was alcoholism. This suggests that the nutritional status of the sarcopenia group was relatively poor. As confirmed in this and several other studies, sarcopenia correlates with poor outcomes in LT patients [910], so more research and clinical efforts are needed on the connection between nutrition and sarcopenia. In addition, because diagnosing, educating patients about, and managing sarcopenia are beyond the capacity of a transplant surgeon, a multidisciplinary approach that includes a nutrition team in the hospital is required [30]. In particular, more intensive and systematic management and support are needed for patients hospitalized or receiving intensive care unit treatment before LT. This kind of multidisciplinary approach is being implemented in pre-LT patients in Samsung Medical Center, but its effects on patient outcomes require further research.
This study has some limitations. First, it is a retrospective single-center study with a small population and possibly unmeasured confounding factors. Second, an accurate evaluation of sarcopenia requires not only muscle mass reduction but also a muscle function evaluation, and this study did not consider that variable. Third, the presented cut-off value for UT-SMI was calculated from an Asian cohort at a single institution, so differences according to race might be relevant. For clinical application of UT-SMI, verifications by other institutions and research on cut-off values by race are required. Nevertheless, this study also has novel strengths. To our knowledge, our study is the first to simultaneously evaluate the correlations between sarcopenia diagnosed using UT-SMI and L3-SMI and patient outcomes in LT recipients. In addition, by presenting the optimal cut-off value for UT-SMI, it was confirmed that UT-SMI has a good correlation with both overall patient survival rate and graft survival rate. Additional studies may confirm the clinical significance of UT-SMI.
In conclusion, sarcopenia diagnosed with both UT-SMI and L3-SMI correlated with patient survival and graft survival in LT recipients. UT-SMI has been shown to be an independent prognostic factor for overall patient and graft survival in LT recipients. This study demonstrated that UT-SMI could be a good option for CT-based sarcopenia diagnosis in LT recipients. However, further study is needed because the cut-off value could differ according to race, and validation is required for clinical application.
 XML Download