Journal List > J Korean Med Sci > v.38(45) > 1516084575

Yi, Shin, Han, Choi, Lee, and Sung: Associations Between Phthalate, Eosinophil, and Aeroallergen Sensitization in Schoolchildren

Abstract

Background

Phthalates and bisphenol A (BPA) are endocrine-disrupting chemicals and may cause immunological disorders in children. Therefore, according to the region, we investigated urinary phthalates and BPA levels and the relationship between urinary phthalate, aeroallergen sensitization, and eosinophil count during the coronavirus disease 2019 pandemic.

Methods

In total, 203 schoolchildren (134 residential and 69 industrial) aged 7–10 years were enrolled between July 2021 and July 2022. The BPA, metabolites of four high-molecular-weight phthalates (Σ4HMWP) and three low-molecular-weight phthalates (Σ3LMWP), were measured in the urine samples. Total eosinophil count and transepidermal water loss (TEWL) were also measured along with the skin prick test.

Results

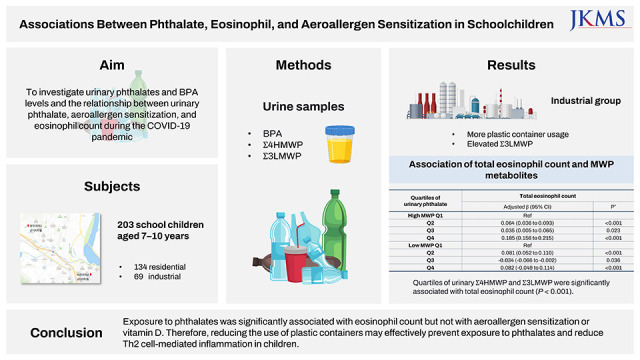
The two groups had no differences in terms of BPA. The industrial group had significantly more plastic container usage, and there was a difference in the Σ3LMWP (P < 0.001) between the two groups but no difference in the Σ4HMWP (P = 0.234). The quartiles of urinary Σ4HMWP and Σ3LMWP (P < were not associated with the total eosinophil count, vitamin D level, or TEWL. After adjusting for cofactors, the quartiles of urinary Σ4HMWP and Σ3LMWP were significantly associated with total eosinophil count (P < 0.001) but not with aeroallergen sensitization or vitamin D.

Conclusion

Exposure to phthalates was significantly associated with eosinophil count but not with aeroallergen sensitization or vitamin D. Therefore, reducing the use of plastic containers may effectively prevent exposure to phthalates and reduce Th2 cell-mediated inflammation in children.

Graphical Abstract

jkms-38-e391-abf001.jpg

INTRODUCTION

Endocrine-disrupting chemicals (EDCs) are a class of exogenous substances that can disrupt the synthesis or regulation of hormones.1 EDCs include synthetic or natural chemicals, such as phthalates and bisphenol A (BPA), that cause immunological disorders and aggravate allergic diseases.1234 It is well-known that children may be particularly susceptible to the effects of EDCs due to developmentally appropriate differences in physiology and toxicokinetics.2
Phthalate and BPA, two of the most common EDCs, can potentially destroy the endocrine system and aggravate allergic diseases.4567 Phthalates have been reported to decrease regulatory T-cell, interleukin (IL)-10, and interferon-γ levels and increase IL-4 and antigen-specific immunoglobulin E levels in two animal studies.48 Other studies found that phthalate and BPA exposure were positively associated with airway dysfunction and asthma and worsened atopic dermatitis (AD).7 BPA is produced in high volumes in the USA.910 Whereas, the Korean food and drug safety law for children has prohibited the use of BPA in the daily manufacturing of children’s products since 2018.11 Meanwhile, an industrial region is a geographical area with high-volume manufacturing or other industrial enterprises. Therefore, we hypothesized that industrial sites may be more frequently exposed to EDCs than residential or commercial areas, and EDC exposure varies by region.
Atopic sensitization is a complex interplay between the allergen in its environment and the propensity of the host's innate and adaptive immune cells towards allergic inflammation.12 Also, vitamin D modulates diverse immunological pathways that function in airway dysfunction and inflammation, and reduces excessive inflammatory responses.1314 The phthalates and BPA exposure might be associated with atopic sensitization and vitamin D in children.
To the best of our knowledge, no prior research has explored whether atopic sensitization and vitamin D levels affect EDC levels in schoolchildren compared to the general population in industrial or residential regions since the coronavirus disease 2019 (COVID-19) pandemic. Thus, we investigated if eosinophil or vitamin D act as an intermediate modulating factor as the mechanism of the association between urinary phthalates and aeroallergen sensitization in schoolchildren during the COVID-19 pandemic.

METHODS

Study design and subjects

A total of 203 schoolchildren aged 7–10 years from two elementary schools (one industrial and one residential region school) were enrolled in this study between July 2021 and July 2022. Parents of 220 children were asked to answer the questionnaires before the physical examination. Questionnaires were used to record the physicians' diagnoses of the children's illnesses (e.g., allergic rhinitis [AR], AD, and asthma). Questionnaires were based on the International Study of Asthma and Allergies in Childhood (ISAAC)15 and included questions regarding the frequency of food consumption in plastic containers or plastic container usage.
The parents of the 203 schoolchildren (92.3%) returned the completed questionnaires and agreed to provide their children’s blood and urine samples. Pediatricians and well-trained pediatric technicians visited two schools and regularly performed physical examinations, including weight, height, and blood and urine collection. Body mass index (BMI) z-scores were calculated based on age- and sex-standardized measures of adiposity in children based on the World Health Organization growth standards.16

Measurement of phthalate and BPA

Urine samples were collected in sterile cups between 7 and 11 am and stored at −80°C until further analysis. Phthalate and BPA metabolite concentrations were determined using gas chromatography/tandem mass spectroscopy17 and were expressed relative to urinary creatinine (µg/g) to control urine dilution.
A total of 203 urine samples were analyzed for the following seven phthalate metabolites: mono-(isobutyl) phthalate (MiBP), mono-n-butyl phthalate (MnBP), mono-benzyl phthalate (MBzP), mono-(2-ethylhexyl) phthalate (MEHP), mono-(2-ethyl-5-hydroxyhexyl) phthalate (MEHHP), mono-(2-ethyl-5-oxohexyl) phthalate (MEOHP), and mono-(2-ethyl-5-carboxypentyl) phthalate (MECPP).
Additionally, phthalate metabolites were grouped based on their molecular weight as high-molecular-weight phthalates (Σ4HMWP) metabolites (MEHHP, MEOHP, MECPP, and MEHP) or low-molecular-weight phthalates (Σ3LMWP) metabolites (MiBP, MnBP, and MBzP).18 Furthermore, they were divided into quartiles according to their concentrations (lowest, Q1, lowest to highest, Q4). Previous studies have demonstrated that these two groups of metabolites exhibit different physicochemical properties.18

Sensors

AEROCET 531S Particle Mass Profiler & Counter (Met One Instruments, Inc., Grants Pass, OR, USA) were used to measure particulate matter (PM) PM10, PM2.5, and PM1 and collected according to the manual. We investigated PM10, PM2.5, and PM1 twice on the same day (November 2021 and May 2022) from 8 am to 11 am in each school indoors.

Measurement of transepidermal water loss (TEWL)

TEWL (g/m2/hr) was measured in children using GPSkin Pro (closed TEWL measurements, USA) simultaneously by placing the probe on the skin for 5–10 seconds.19 In line with international recommendations, measurements were performed at room temperature between 20°C and 25°C and 45–60% humidity. Two successive measurements were performed on the right lower arm, keeping the room temperature as close to 22°C as possible while noting ambient temperature and humidity. Measurements were only performed on calm children, and the windows and doors were kept closed.

Measurement of atopy

The SPT was used to measure atopy using standardized allergen extracts and control solutions from Allergy Therapeutics Ltd. (ATL, Bencard, UK) on the volar surface of the left arm and skin with a normal appearance. The participants were tested for sensitivity to the following nine common aeroallergens: house dust mite (HDM, Dermatophagoides pteronyssinus, and Dermatophagoides farinae), animal dander (cat and dog), and pollen (birch, oak, mugwort, ragweed, and grass). A mean wheal diameter of 3 mm or more than the positive control was considered as a positive SPT result.20
Non-sensitization is defined as the absence of positive allergic reactions. Sensitization to pollen was defined as positive sensitization to birch, oak, mugwort, ragweed, and grass. Accordingly, children were categorized as non-sensitized, monosensitized (positive results for a single antigen), or polysensitized (positive results for multiple allergen).2021

Blood analyses

Non-fasting venous blood samples were collected, centrifuged, and analyzed within 2 hours of collection. We performed a 25-OHD assay using a Unicel DxI 800 (Beckman Coulter, Brea, CA, USA) after extraction with acetonitrile. For analysis, children were classified as deficient (< 20 ng/mL), insufficient (20–29.9 ng/mL), or sufficient (≥ 30 ng/mL).2223
Total cholesterol, high-density lipoprotein cholesterol (HDL-C), and triglyceride (TG) levels were measured using a Beckman Coulter AU 5800 (Beckman Coulter). Serum follicle-stimulating hormone (FSH), luteinizing hormone (LH), and estradiol (E2) levels were measured using four automated immunometric assays: ARCHITECT i1000SR (Abbott, Chicago, IL, USA) and UniCel DxI800 (Beckman Coulter, Brea, CA, USA). Reference ranges were calculated for each method.

Statistical analysis

All statistical analyses were performed using SPSS (version 27.0; IBM Corp., Armonk, NY, USA) and R software (version 3.6.3; R Foundation, Vienna, Austria). Continuous data were expressed as means with standard deviations or medians with interquartile ranges, depending on the data distribution. The relationships between the concentrations of different urinary phthalates and TEWL, total eosinophil count, and aeroallergen sensitization were analyzed using linear regression. Beta (β) and standard error from continuous variables (total eosinophil count, vitamin D, and TEWL), odds ratio and 95% confidence interval (CI) from dichotomous variable (aeroallergen sensitization) were calculated using a generalized linear mixed model with the gamma or logit function, adjusted for age, sex, BMI z score, school, ever AR, ever AD, and ever asthma. A P value ≤ 0.05 was considered significant.

Ethics statement

The study protocol was approved by the Institutional Review Board (IRB) of the Soonchunhyang University Gumi Hospital (IRB No. 2021-04-049). Written informed consent was obtained from the parents or guardians of all participants.

RESULTS

Characteristics of the study participants

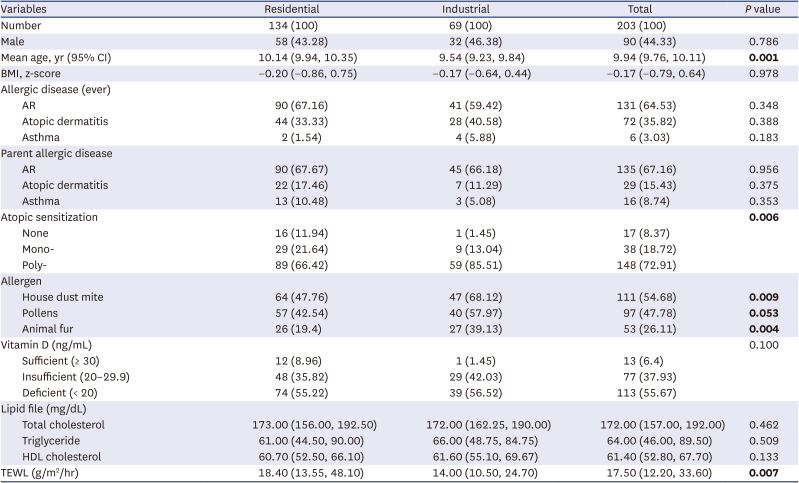
In total, 203 children (134 residential and 69 industrial) were recruited for this study (Tables 1 and 2), which included 90 boys (44.33%), and the mean age was 9.94 years (95% CI, 9.76, 10.11). Among 203 children, 131 (64.53%) had AR (ever), 72 (35.82%) had AD (ever), and 6 (3.3%) had asthma (ever). No significant differences were observed in gender, BMI, allergic disease, or parental allergic disease; however, there were differences in mean age (P = 0.001) between the industrial and residential groups.
Table 1

Demographic and clinical characteristics of study subjects (N = 203)

jkms-38-e391-i001
Variables Residential Industrial Total P value
Number 134 (100) 69 (100) 203 (100)
Male 58 (43.28) 32 (46.38) 90 (44.33) 0.786
Mean age, yr (95% CI) 10.14 (9.94, 10.35) 9.54 (9.23, 9.84) 9.94 (9.76, 10.11) 0.001
BMI, z-score −0.20 (−0.86, 0.75) −0.17 (−0.64, 0.44) −0.17 (−0.79, 0.64) 0.978
Allergic disease (ever)
AR 90 (67.16) 41 (59.42) 131 (64.53) 0.348
Atopic dermatitis 44 (33.33) 28 (40.58) 72 (35.82) 0.388
Asthma 2 (1.54) 4 (5.88) 6 (3.03) 0.183
Parent allergic disease
AR 90 (67.67) 45 (66.18) 135 (67.16) 0.956
Atopic dermatitis 22 (17.46) 7 (11.29) 29 (15.43) 0.375
Asthma 13 (10.48) 3 (5.08) 16 (8.74) 0.353
Atopic sensitization 0.006
None 16 (11.94) 1 (1.45) 17 (8.37)
Mono- 29 (21.64) 9 (13.04) 38 (18.72)
Poly- 89 (66.42) 59 (85.51) 148 (72.91)
Allergen
House dust mite 64 (47.76) 47 (68.12) 111 (54.68) 0.009
Pollens 57 (42.54) 40 (57.97) 97 (47.78) 0.053
Animal fur 26 (19.4) 27 (39.13) 53 (26.11) 0.004
Vitamin D (ng/mL) 0.100
Sufficient (≥ 30) 12 (8.96) 1 (1.45) 13 (6.4)
Insufficient (20–29.9) 48 (35.82) 29 (42.03) 77 (37.93)
Deficient (< 20) 74 (55.22) 39 (56.52) 113 (55.67)
Lipid file (mg/dL)
Total cholesterol 173.00 (156.00, 192.50) 172.00 (162.25, 190.00) 172.00 (157.00, 192.00) 0.462
Triglyceride 61.00 (44.50, 90.00) 66.00 (48.75, 84.75) 64.00 (46.00, 89.50) 0.509
HDL cholesterol 60.70 (52.50, 66.10) 61.60 (55.10, 69.67) 61.40 (52.80, 67.70) 0.133
TEWL (g/m2/hr) 18.40 (13.55, 48.10) 14.00 (10.50, 24.70) 17.50 (12.20, 33.60) 0.007
Values are presented as median (interquartile range) or number (%).
Bold are represented as significant differences (P < 0.05).
CI = confidence interval, BMI = body mass index, AR = allergic rhinitis, HDL = high-density lipoprotein, TEWL = transepidermal water loss.
Table 2

Demographic and clinical characteristics of study subjects (N = 203)

jkms-38-e391-i002
Variables Residential of indoor Industrial of indoor P value
PM1.0 (µg/m3)
November 2021 3.70 (3.50, 3.80) 6.20 (5.60, 7.03) < 0.001
May 2022 1.10 (1.00, 1.10) 1.40 (1.40, 1.50) < 0.001
PM2.5 (µg/m3)
November 2021 10.40 (10.00, 10.60) 16.85 (15.70, 19.13) < 0.001
May 2022 5.00 (4.80, 5.30) 5.35 (5.10, 5.70) < 0.001
PM10.0 (µg/m3)
November 2021 12.00 (11.60, 12.35) 39.70 (35.40, 43.70) < 0.001
May 2022 7.20 (6.80, 7.90) 33.30 (28.82, 37.20) < 0.001
Values are presented as median (interquartile range).
Bold are represented as significant differences (P < 0.05).
PM = particulate matter.
Concerning SPTs, 186 children were observed to be sensitive to allergens (91.63%), 38 (18.72%) had monosensitization, and 148 (72.91%) had polysensitization. Significant differences were found in allergen sensitization (P = 0.006), sensitization to HDM, pollen, and animal fur between the industrial and residential groups. TEWL levels were significantly different between the two groups, and children in the residential region had higher TEWL (P = 0.007). However, the industrial and residential groups showed no significant differences in lipid profiles (total cholesterol, TG, and HDL-C) or vitamin D levels.

PM (PM10.0/PM2.5/PM1.0) levels in the indoors of two region schools

The levels of PM (PM10.0/PM2.5/PM1.0) were measured twice on the same day (November 2021 and May 2022) in the indoors of two region schools (school hallway). The two groups differed in PM10.0/PM2.5/PM1.0 (Tables 1 and 2). The industrial group indoors had higher PM10.0/PM2.5/PM1.0 levels in November 2021 and May 2022 (all comparisons, P < 0.001).

Phthalate and BPA levels in study participants

Answers regarding food consumption in plastic containers (P = 0.018) or plastic container usage (P = 0.008) were significantly different between the two groups (Tables 3 and 4). The industrial group had a higher food consumption frequency in plastic containers or plastic container usage.
Table 3

The level of formaldehyde, bisphenol A, and phthalate in study subjects (expressed in μg/g creatinine) (N = 203)

jkms-38-e391-i003
Variables Residential (n = 134) Industrial (n = 69) Total (N = 203) P value
Questionnaire about frequency
Food consumption with plastic container 6.00 (5.00, 7.00) 6.00 (5.00, 8.00) 6.00 (5.00, 7.00) 0.018
Plastic container usage 14.00 (12.00, 16.00) 15.00 (13.00, 17.00) 15.00 (12.00, 16.00) 0.008
Bisphenol A 0.00 (0.00) 0.00 (0.00) 0.00 (0.00) 0.614
Sum of phthalate
4HighMW 42.70 (26.15, 66.43) 48.80 (28.70, 74.80) 44.10 (27.10, 71.20) 0.234
3LowMW 53.75 (37.13, 81.10) 85.60 (62.35, 144.65) 64.00 (42.90, 99.30) < 0.001
Values are presented as median (interquartile range).
Bold are represented as significant differences (P < 0.05).
MW = molecular-weight.
Table 4

The level of phthalate in study subjects (expressed in μg/g creatinine) (N = 203)

jkms-38-e391-i004
Phthalate Metabolite Q1 Q2 Q3 Q4 > 95 percentile
High molecular MEHHP < 6.40 6.40–10.70 10.70–16.80 > 16.80 > 32.60
MEOHP < 3.20 3.20–5.70 5.70–9.00 > 9.00 > 16.74
MECPP < 14.00 14.00–22.20 22.20–35.40 > 35.40 > 57.58
MEHP < 3.00 3.00–5.10 5.10–8.10 > 8.10 > 22.02
Low molecular MiBP < 6.70 6.70–11.30 11.30–26.20 > 26.20 > 110.96
MnBP < 28.20 28.20–41.10 41.10–63.30 > 63.30 > 131.44
MBzP < 0.20 0.20–0.80 0.80–1.70 > 1.70 > 4.78
MEHHP = mono-(2-ethyl-5-hydroxyhexyl) phthalate, MEOHP = mono-(2-ethyl-5-oxohexyl) phthalate, MECPP = mono-(2-ethyl-5-carboxypentyl) phthalate, MEHP = mono(2-ethylhexyl) phthalate, MiBP = mono-(iso-butyl) phthalate, MnBP = mono-n-butyl phthalate, MBzP = mono-benzyl phthalate.
Phthalate metabolites were grouped based on their molecular weight and reported as the sum of Σ4HMWP metabolites or Σ3LMWP metabolites, as prescribed the previous studies18 (Tables 3 and 4). The industrial group had higher Σ3LMWP metabolites, and a significant difference was observed in the Σ3LMWP (P < 0.001) between the industrial and residential groups. However, no difference was observed in the Σ4HMWP between the two groups (P = 0.234).
Meanwhile, the level of BPA was the same in the two groups (0.00 vs. 0.00), without any significant difference between the industrial and residential groups (P = 0.614) (Tables 3 and 4).

Association of urinary phthalate concentration with total eosinophil count, aeroallergen sensitization, vitamin D, and TEWL

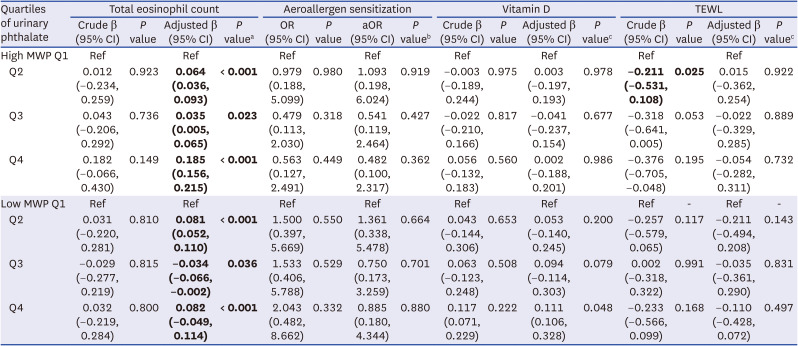
We examined the relationships between the quartiles of urinary phthalate metabolites (Σ4HMWP and Σ3LMWP), total eosinophil count, and aeroallergen sensitization (Tables 3 and 4). After adjusting for age, sex, BMI z-score, school, AR, AD, asthma, and P from a Poisson distribution generalized linear model with a log link function, the quartiles of urinary Σ4HMWP and Σ3LMWP were significantly associated with the total eosinophil count (all comparisons, P < 0.050). However, unadjusted or adjusted analyses showed that the quartiles of urinary Σ4HMWP and Σ3LMWP were not significantly associated with aeroallergen sensitization.
The relationships between the quartiles of urinary HMWP and LMWP metabolites and vitamin D and TEWL levels are shown in Table 5. The analysis was performed for unadjusted or adjusted age, sex, BMI z-score, school, ever AR, ever AD, and ever asthma, and revealed that vitamin D levels were not significantly associated with the quartiles of Σ4HMWP and Σ3LMWP (all comparisons, P > 0.050). However, the unadjusted analysis revealed that the TEWL level was mainly related to the quartiles of Σ4HMWP (β = −0.211; 95% CI, −0.531, 0.108; P = 0.025).
Table 5

Association of total eosinophil count, aeroallergen sensitization, vitamin D, and TEWL levels with high and low MWP metabolites

jkms-38-e391-i005
Quartiles of urinary phthalate Total eosinophil count Aeroallergen sensitization Vitamin D TEWL
Crude β (95% CI) P value Adjusted β (95% CI) P valuea OR (95% CI) P value aOR (95% CI) P valueb Crude β (95% CI) P value Adjusted β (95% CI) P valuec Crude β (95% CI) P value Adjusted β (95% CI) P valuec
High MWP Q1 Ref Ref Ref Ref Ref Ref Ref Ref
Q2 0.012 (−0.234, 0.259) 0.923 0.064 (0.036, 0.093) < 0.001 0.979 (0.188, 5.099) 0.980 1.093 (0.198, 6.024) 0.919 −0.003 (−0.189, 0.244) 0.975 0.003 (−0.197, 0.193) 0.978 −0.211 (−0.531, 0.108) 0.025 0.015 (−0.362, 0.254) 0.922
Q3 0.043 (−0.206, 0.292) 0.736 0.035 (0.005, 0.065) 0.023 0.479 (0.113, 2.030) 0.318 0.541 (0.119, 2.464) 0.427 −0.022 (−0.210, 0.166) 0.817 −0.041 (−0.237, 0.154) 0.677 −0.318 (−0.641, 0.005) 0.053 −0.022 (−0.329, 0.285) 0.889
Q4 0.182 (−0.066, 0.430) 0.149 0.185 (0.156, 0.215) < 0.001 0.563 (0.127, 2.491) 0.449 0.482 (0.100, 2.317) 0.362 0.056 (−0.132, 0.183) 0.560 0.002 (−0.188, 0.201) 0.986 −0.376 (−0.705, −0.048) 0.195 −0.054 (−0.282, 0.311) 0.732
Low MWP Q1 Ref Ref Ref Ref Ref Ref Ref - Ref -
Q2 0.031 (−0.220, 0.281) 0.810 0.081 (0.052, 0.110) < 0.001 1.500 (0.397, 5.669) 0.550 1.361 (0.338, 5.478) 0.664 0.043 (−0.144, 0.306) 0.653 0.053 (−0.140, 0.245) 0.200 −0.257 (−0.579, 0.065) 0.117 −0.211 (−0.494, 0.208) 0.143
Q3 −0.029 (−0.277, 0.219) 0.815 −0.034 (−0.066, −0.002) 0.036 1.533 (0.406, 5.788) 0.529 0.750 (0.173, 3.259) 0.701 0.063 (−0.123, 0.248) 0.508 0.094 (−0.114, 0.303) 0.079 0.002 (−0.318, 0.322) 0.991 −0.035 (−0.361, 0.290) 0.831
Q4 0.032 (−0.219, 0.284) 0.800 0.082 (−0.049, 0.114) < 0.001 2.043 (0.482, 8.662) 0.332 0.885 (0.180, 4.344) 0.880 0.117 (0.071, 0.229) 0.222 0.111 (0.106, 0.328) 0.048 −0.233 (−0.566, 0.099) 0.168 −0.110 (−0.428, 0.072) 0.497
TEWL = transepidermal water loss, MWP = molecular weight phthalate, CI = confidence interval, OR = odds ratio, aOR = adjusted odds ratio, BMI = body mass index.
Bold numbers are represented as significant differences (P < 0.05).
aAdjusted for age, sex, BMI z score, school, ever allergic rhinitis, ever atopic dermatitis, ever asthma and P from a Poisson distribution generalized linear model with a log link function.
bAdjusted for age, sex, BMI z score, school and P from a logistic regression.
cAdjusted for age, sex, BMI z score, school, ever allergic rhinitis, ever atopic dermatitis, ever asthma and P from a gamma distribution generalized linear model with a log link function.
Fig. 1. shows the associations of the quartiles of urinary phthalate concentration with total eosinophil count, vitamin D level, and TEWL. The quartiles of urinary Σ4HMWP and Σ3LMWP were not associated with total eosinophil count (Fig. 1A and B), vitamin D (Fig. 1C and D), or TEWL (Fig. 1E and F) (all comparisons, P > 0.050).
Fig. 1

Comparison of total eosinophil count (A and B), TEWL (C and D), vitamin D (E and F) in children with different levels of Σ4HMWP of Σ3LMWP metabolites (Kruskal–Wallis one-way analysis of variance).

TEWL = transepidermal water loss, Σ4HMWP = four high-molecular-weight phthalates, Σ3LMWP = three low-molecular-weight phthalates.
jkms-38-e391-g001

Association of urinary phthalate concentration with sex hormone

A total of 113 girls were recruited for sex steroid hormone analysis. The relationships between the quartiles of urinary HMWP and LMWP metabolites and sex steroid hormone levels in girls are shown in Tables 6 and 7. There were no differences in LH, FSH, or E2 levels, but there was a significant difference in the LH/FSH ratio (P = 0.021) between the industrial and residential groups.
Table 6

Association of sex steroid hormones between girls in residential and industrial groups

jkms-38-e391-i006
Variable Residential group Industrial group Total P value
Girls 76 37 113
Mean age, yr (95% CI) 10.03 (9.76, 10.30) 9.43 (8.96, 9.90) 9.83 (9.59, 10.07) 0.024
BMI, z-score −0.20 (−0.86, 0.66) −0.11 (−0.65, 0.31) −0.17 (−0.82, 0.44) 0.888
Sex steroid hormones
LH (mIU/mL) 0.20 (0.20, 0.38) 0.20 (0.20, 0.47) 0.20 (0.20, 0.44) 0.325
FSH (mIU/mL) 2.49 (2.09, 3.71) 2.25 (1.29, 3.02) 2.42 (1.90, 3.16) 0.053
LH/FSH ratio 0.10 (0.06, 0.16) 0.16 (0.09, 0.28) 0.10 (0.07, 0.18) 0.021
E2 (mIU/mL) 15.00 (15.00, 15.00) 15.00 (15.00, 15.00) 15.00 (15.00, 15.00) 0.254
Values are presented as median (interquartile range) or number.
Bold letters are represented as significant differences (P < 0.05)
MWP = molecular weight phthalate, CI = confidence interval, BMI = body mass index, LH = lower luteinizing hormone, FSH = follicle-stimulating hormone, E2 = estradiol.
Table 7

Association of sex steroid hormones in girls with high and low MWP metabolites

jkms-38-e391-i007
Variable LH FSH LH/FSH ratio E2
BMI, z-score r = 0.20* r = 0.01 r = 0.16 r = 0.17
4HighMW r = 0.05 r = −0.12 r = 0.05 r = −0.01
3LowMW r = 0.07 r = −0.08 r = 0.12 r = 0.01
MWP = molecular weight phthalate, LH = lower luteinizing hormone, FSH = follicle-stimulating hormone, E2 = estradiol, BMI = body mass index, MW = molecular-weight.
*P < 0.05.
Urinary Σ4HMWP and Σ3LMWP levels were not associated with all sex hormone (LH, FSH, the LH/FSH ratio, or E2). Among variable, BMI was weakly associated with LH (r = 0.196, P < 0.050) but not with FSH, the LH/FSH ratio, or E2 (Tables 6 and 7).

DISCUSSION

The involvement of EDCs, including phthalates and BPA, in allergic and endocrine diseases is of significant interest. Recently a few studies have been conducted to investigate the association between phthalates and BPA exposure, allergic inflammation, and skin barrier function. Our study analyzed phthalates and BPA in the general population of children living in industrial or residential areas during the COVID-19 pandemic.
Phthalates are common ingredients in polyvinyl chloride products, cosmetics, and infant toys.224 A study in Korea found that the atmospheric level of di(2-ethylhexyl)phthalate, the most toxic among phthalate metabolites, was higher in residential areas compared to the industrial areas of the two cities.25 The reason may be that the residential areas used more plastic bags and containers.25 Unfortunately, the present study had no data on phthalate metabolism in the atmosphere. Nevertheless, we found no differences between the two groups regarding exposure to HMWPs; however, exposure to LMWPs was significantly higher in the industrial area than in the residential area.
It is well-known that during the COVID-19 pandemic, the demand for food delivery with plastic containers or using plastic containers has been increasing worldwide.26 In the present study, the industrial group had more food frequency with a plastic container or plastic container usage because of the higher labor intensity. These results suggest that increased exposure to phthalate may be associated with the frequency of a plastic container, not the region.
The quartiles of urinary Σ4HMWP and Σ3LMWP were not associated with total eosinophil count, aeroallergen sensation, or vitamin D. However, after adjusting for confounding variables, HMWP and LMWP exposure were significantly associated with eosinophil count, but not with aeroallergen sensation or vitamin D. Furthermore, exposure to HMWPs was associated considerably with TEWL levels.
Some studies have revealed that urine phthalate levels correlate with blood eosinophil levels and aeroallergen sensitization.2728 However, our results indicated that HMWPs and LMWPs correlate only with blood eosinophil levels and not with aeroallergen sensitization, which corroborates the findings of a previous study,29 demonstrating that phthalates have a more substantial effect on sensitization in children with allergic disease. Additionally, a survey of schoolchildren in another city in Korea in 2017 found that exposure to HMWPs and LMWPs was not associated with atopic sensitization,30 which is consistent with this study. These results may also explain why the relationship between urine phthalate levels, eosinophil levels, and atopic sensitization has been disputed. Therefore, further studies on larger populations must clarify this relationship's mechanism.
It is well-known that AD in children impairs the patients' and their family members' quality of life and is associated with skin barrier dysfunction.3031
There were a few children with AD in the present study, so we did not get the association between AD and LMWP and HMWP levels. However, few studies have examined the association between phthalate exposure and skin barrier function.273132 Furthermore, one study revealed that the differences in the association between TEWL level and LMWP and HMWP levels might be attributed to the varying responses of the body parts to LMWP and HMWP, particularly those associated with the lower arm and leg.31 In the present study, there were no significant differences in the TEWL of the arm according to the quartiles of urinary Σ4HMWP and Σ3LMWP; however, after adjusting for confounding variables, exposure to HMWPs was significantly associated with TEWL in the low arm, indicating that increased phthalate exposure may be related to increased skin barrier dysfunction and inflammation.
Since 2018, the new Korean food law has extended the restriction on using BPA in containers and packaging for infants' and children's products. Surprisingly, we observed no differences in BPA exposure between the two groups. The mean level of BPA was 0.00 μg/g creatinine in both industrial and residential groups, which differed from previous data from another city in Korea in 2017.23 Additionally, because of this result, we did not analyze the relationship between BPA and eosinophil count or aeroallergen sensitization.
Previous studies have indicated that phthalate exposure is adversely associated with E2 and positively associated with sex hormone-binding globulin in 179 children aged 6–19 years,33 which contradicts our findings and may be due to differences in subjects' ages. Moreover, sex hormones in 113 female children aged 7–10 years were not associated with HMWPs or LMWPs, and no regional differences existed. Therefore, more studies are needed to elucidate these relationships.
The present study has some limitations. First, in this study, 91.63% (186/203) of the children showed sensitization to aeroallergens, a prevalence higher than that reported in previous studies.1823 Selection bias may have occurred because parents concerned about their child's allergic diseases during COVID-19 responded to our questionnaire without visiting the hospital. Second, due to the study's cross-sectional nature, direct evidence of cause-and-effect relationships was not obtained. Furthermore, we did not conduct large-sample research on industrial and residential children due to the COVID-19 pandemic closing schools. Third, the correlation between urinary phthalate metabolites and TEWL alone may be insufficient to address the association with barrier dysfunction because TEWL may be increased even in dermatitis. Therefore, prospective and longitudinal studies involving repeated observations are warranted to analyze the long-term effects of phthalates on allergic inflammation.
Nonetheless, this study has several merits. To the best of our knowledge, this is the first study on industrial and residential schoolchildren that comprehensively investigates the role of phthalate and BPA metabolites during the COVID-19 pandemic. We used a comprehensive and stringent questionnaire to evaluate TEWL, SPTs, eosinophil count, and vitamin D levels, which yielded accurate and objective data.
Conclusively, there was a regional difference in phthalate exposure due to using plastic containers. Moreover, exposure to phthalates is significantly associated with eosinophil count but not aeroallergen sensitization and vitamin D in schoolchildren during the COVID-19 pandemic. Therefore, reducing the use of plastic containers in children effectively prevents exposure to phthalates and reduces Th2 cell-mediated inflammation.

ACKNOWLEDGMENTS

The authors thank an investigator, Sungeui Yoon, for her technical assistance in this study.

Notes

Funding: This work was supported by the (NRF) grant funded by the Ministry of Education (NRF-20201104). Grant funding was provided by the Soonchunhyang University Research Fund.

Disclosure: The authors have no potential conflicts of interest to disclose.

Author Contributions:

  • Conceptualization: Sung M, Han MY.

  • Data curation: Choi HJ.

  • Formal analysis: Choi HJ.

  • Funding acquisition: Sung M.

  • Investigation: Sung M.

  • Methodology: Sung M.

  • Software: Yi J, Choi HJ.

  • Validation: Han MY.

  • Visualization: Lee MS.

  • Writing - original draft: Yi J, Sung M.

  • Writing - review & editing: Yi J, Shin HS, Han MY, Choi HJ, Lee MS, Sung M.

References

1. De Coster S, van Larebeke N. Endocrine-disrupting chemicals: associated disorders and mechanisms of action. J Environ Public Health. 2012; 2012:713696. PMID: 22991565.
crossref
2. Kim MA, Yon DK, Jee HM, Kim JH, Park J, Lee SW, et al. Association of phthalates with nasal patency and small airway dysfunction in first-grade elementary school children. Allergy. 2020; 75(11):2967–2969. PMID: 32473031.
crossref
3. Ha EK, Kim JH, Park D, Lee E, Lee SW, Jee HM, et al. Personal exposure to total VOC is associated with symptoms of atopic dermatitis in schoolchildren. J Korean Med Sci. 2022; 37(8):e63. PMID: 35226421.
crossref
4. Gascon M, Casas M, Morales E, Valvi D, Ballesteros-Gómez A, Luque N, et al. Prenatal exposure to bisphenol A and phthalates and childhood respiratory tract infections and allergy. J Allergy Clin Immunol. 2015; 135(2):370–378. PMID: 25445825.
5. Stelmach I, Majak P, Jerzynska J, Podlecka D, Stelmach W, Polańska K, et al. The effect of prenatal exposure to phthalates on food allergy and early eczema in inner-city children. Allergy Asthma Proc. 2015; 36(4):72–78. PMID: 26108074.
crossref
6. Kim JH, Lim JS. Early menarche and its consequence in Korean female: reducing fructose intake could be one solution. Clin Exp Pediatr. 2021; 64(1):12–20. PMID: 32403898.
crossref
7. Berger K, Eskenazi B, Balmes J, Kogut K, Holland N, Calafat AM, et al. Prenatal high molecular weight phthalates and bisphenol A, and childhood respiratory and allergic outcomes. Pediatr Allergy Immunol. 2019; 30(1):36–46. PMID: 30338578.
crossref
8. Jahreis S, Trump S, Bauer M, Bauer T, Thürmann L, Feltens R, et al. Maternal phthalate exposure promotes allergic airway inflammation over 2 generations through epigenetic modifications. J Allergy Clin Immunol. 2018; 141(2):741–753. PMID: 28392331.
crossref
9. Rochester JR. Bisphenol A and human health: a review of the literature. Reprod Toxicol. 2013; 42:132–155. PMID: 23994667.
crossref
10. Seachrist DD, Bonk KW, Ho SM, Prins GS, Soto AM, Keri RA. A review of the carcinogenic potential of bisphenol A. Reprod Toxicol. 2016; 59:167–182. PMID: 26493093.
crossref
11. Ministry of Food and Drug Safety. Bisphenol A. Updated 2018. Accessed August 31, 2022. http://www.mfds.go.kr .
12. Kiguchi T, Yamamoto-Hanada K, Saito-Abe M, Fukuie T, Ohya Y. Eczema phenotypes and IgE component sensitization in adolescents: a population-based birth cohort. Allergol Int. 2023; 72(1):107–115. PMID: 35781407.
crossref
13. Pfeffer PE, Hawrylowicz CM. Vitamin D in asthma: mechanisms of action and considerations for clinical trials. Chest. 2018; 153(5):1229–1239. PMID: 28923762.
14. Rafiq R, Thijs W, Prein R, de Jongh RT, Taube C, Hiemstra PS, et al. Associations of serum 25(OH)D concentrations with lung function, airway inflammation and common cold in the general population. Nutrients. 2018; 10(1):35. PMID: 29301349.
crossref
15. Lee SI, Shin MH, Lee HB, Lee JS, Son BK, Koh YY, et al. Prevalences of symptoms of asthma and other allergic diseases in Korean children: a nationwide questionnaire survey. J Korean Med Sci. 2001; 16(2):155–164. PMID: 11306740.
crossref
16. Lee SJ, Ha EK, Jee HM, Lee KS, Lee SW, Kim MA, et al. Prevalence and risk factors of urticarial with a focus on chronic urticaria in children. Allergy Asthma Immunol Res. 2017; 9(3):212–219. PMID: 28293927.
crossref
17. Koch HM, Lorber M, Christensen KLY, Pälmke C, Koslitz S, Brüning T. Identifying sources of phthalate exposure with human biomonitoring: results of a 48h fasting study with urine collection and personal activity patterns. Int J Hyg Environ Health. 2013; 216(6):672–681. PMID: 23333758.
crossref
18. Baek HS, Won HY, Kim JH, Ha EK, Jee HM, Shin YH, et al. Association of phthalate exposure and airway dysfunction with mediation by serum periostin. Pediatr Allergy Immunol. 2021; 32(8):1681–1690. PMID: 34291496.
crossref
19. Logger JG, Driessen RJ, de Jong EM, van Erp PE. Value of GPSkin for the measurement of skin barrier impairment and for monitoring of rosacea treatment in daily practice. Skin Res Technol. 2021; 27(1):15–23. PMID: 32573826.
crossref
20. Kim J, Hahm MI, Lee SY, Kim WK, Chae Y, Park YM, et al. Sensitization to aeroallergens in Korean children: a population-based study in 2010. J Korean Med Sci. 2011; 26(9):1165–1172. PMID: 21935271.
crossref
21. Sung M, Yon DK, Lee SW, Kim JH, Baek HS, Jee HM, et al. The relationship between aeroallergen sensitization and chronic cough in school-aged children from general population. Biomed Res Int. 2021; 2021:5513611. PMID: 34840976.
crossref
22. Holick MF. Vitamin D deficiency. N Engl J Med. 2007; 357(3):266–281. PMID: 17634462.
crossref
23. Sung M, Jee HM, Kim JH, Ha EK, Shin YH, Kim JH, et al. Serum vitamin D level mitigates fractional exhaled nitric oxide linked to bisphenol-A in school-aged children. Eur Rev Med Pharmacol Sci. 2022; 26(5):1640–1647. PMID: 35302211.
24. Schettler T. Human exposure to phthalates via consumer products. Int J Androl. 2006; 29(1):134–139. PMID: 16466533.
crossref
25. Baek KM, Seo YK, Baek SO. Occurrence of particulate polycyclic aromatic hydrocarbons and phthalates in the ambient air of Yeosu·Gwangyang Area. J Korean Soc Atmos Environ. 2019; 35(6):767–785.
crossref
26. Rapada MZ, Yu DE, Janairo JI, Yu KD. Impact of online-based information and interaction to proenvironmental behavior on plastic pollution. Clean Responsib Consum. 2023; 9:100126.
crossref
27. Bekö G, Callesen M, Weschler CJ, Toftum J, Langer S, Sigsgaard T, et al. Phthalate exposure through different pathways and allergic sensitization in preschool children with asthma, allergic rhinoconjunctivitis and atopic dermatitis. Environ Res. 2015; 137:432–439. PMID: 25625823.
crossref
28. Bølling AK, Sripada K, Becher R, Bekö G. Phthalate exposure and allergic diseases: Review of epidemiological and experimental evidence. Environ Int. 2020; 139:105706. PMID: 32371302.
crossref
29. United States Environmental Protection Agency. Phthalates. Assessing and managing chemicals under TSCA. Updated 2015. Accessed April 7, 2017. http://www.epa.gov .
30. Jeon YH, Ahn K, Kim J, Shin M, Hong SJ, Lee SY, et al. Clinical characteristics of atopic dermatitis in Korean school-aged children and adolescents according to onset age and severity. J Korean Med Sci. 2022; 37(4):e30. PMID: 35075829.
crossref
31. Sung M, Kim DH, Jee HM, Kim JH, Ha EK, Shin YH, et al. Urine phthalate levels were associated with skin barrier dysfunction and atopic sensitization in children. Eur Rev Med Pharmacol Sci. 2023; 27(7):2888–2898. PMID: 37070889.
32. Overgaard LEK, Main KM, Frederiksen H, Stender S, Szecsi PB, Williams HC, et al. Children with atopic dermatitis and frequent emollient use have increased urinary levels of low-molecular-weight phthalate metabolites and parabens. Allergy. 2017; 72(11):1768–1777. PMID: 28281298.
crossref
33. Hu P, Pan C, Su W, Vinturache A, Hu Y, Dong X, et al. Associations between exposure to a mixture of phenols, parabens, and phthalates and sex steroid hormones in children 6–19 years from NHANES, 2013–2016. Sci Total Environ. 2022; 822:153548. PMID: 35114227.
crossref
TOOLS
Similar articles