

 PDF
PDF Citation
 Print
Print


INTRODUCTION
Lung cancer remains the leading cause of cancer-related death and is predicted to remain the number one cause of cancer death in South Korea through 2032.1 Small cell lung cancer (SCLC) is a type of neuroendocrine tumor that accounts for approximately 15% of all lung cancers. SCLC is an aggressive tumor characterized by a more rapid tumor growth rate and earlier metastasis than non-SCLC. Its prognosis is also poor, and the 2-year survival rate of the extensive disease (ED), which accounts for approximately two-thirds of SCLC, is only 8%.2 In recent years, the median survival of patients with ED-SCLC has been improved to 12–13 months by incorporating immune checkpoint inhibitors (ICIs) into cytotoxic chemotherapy; however, more efforts are required to improve the prognosis of SCLC.34
Genome-wide association studies have found lots of single nucleotide polymorphisms (SNPs) associated with susceptibility to diseases, including cancers.56 Studies have also demonstrated that some SNPs are involved in the prognosis of diverse cancers.789 Achaete-scute homolog 1 and neurogenic differentiation 1 (NeuroD1) are representative SCLC transcription regulators and are known to be involved in the carcinogenesis and behavior of SCLC.10 In particular, NeuroD1 is highly expressed in ED-SCLC and involved in metastasis by promoting cancer cell migration.11 In our previous studies, we selected putative functional SNPs by searching research articles and public databases and reported that genetic variants in Achaete-scute homolog 1 and NeuroD1 target genes were associated with the clinical outcome in SCLC.1213
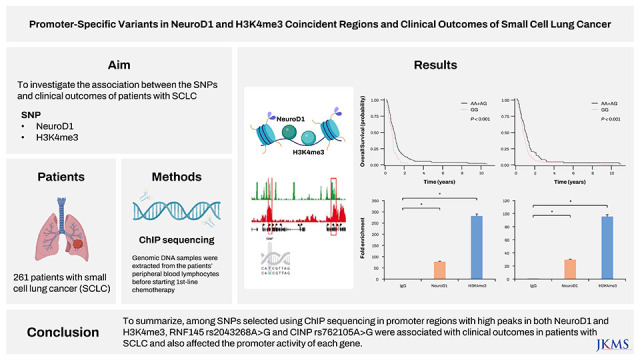
With advancements in genetic analysis technologies, our understanding of transcriptional regulation has also improved. In particular, histone modifications play a vital role in transcription, and nucleosomes with H3 lysine 4 trimethylation (H3K4me3) and histone H3 lysine 9 and 14 modifications have been found to occupy the promoters of most protein-coding genes.1415 Specifically, H3K4me3 is primarily associated with promoters, and nucleosomes modified with H3K4me3 are found at transcription initiation sites.141516 Applying this information to association studies, SNPs within the H3K4me3 peak are more functional and more likely to affect gene transcription by influencing promoter activity. ChIP sequencing (ChIP-seq) is used to explore the interaction between proteins and DNA. In this study, we selected potentially functional SNPs in promoter regions with high peaks in both NeuroD1 and H3K4me3 using the ChIP-seq technique and investigated the association between the SNPs and clinical outcomes of patients with SCLC.
METHODS
Study population
The basic characteristics of the patients who participated in this study have been described in our previous study.1213 Briefly, subjects were patients diagnosed with SCLC and received chemotherapy from 1997 to 2017 at Kyungpook National University Hospital (KNUH). To determine the effect on chemotherapy, patients who received more than two cycles of either etoposide–cisplatin or irinotecan–cisplatin chemotherapy, which were then the primary treatment, were included in this study. Patients who received concurrent chemoradiation were excluded to avoid the effect of radiation on the chemotherapy response, but patients who received radiation sequentially after chemotherapy were included. A total of 261 patients were enrolled. Genomic DNA samples were extracted from the patients’ peripheral blood lymphocytes before starting first-line chemotherapy. The chemotherapy response was evaluated for every two cycles of chemotherapy and analyzed by dividing into responders (complete or partial response) and nonresponders (stable or progressive disease).
SNP selection and genotyping
We performed ChIP-seq to select putative functional SNPs. Experiments were conducted on H82 and H524 cell lines with high NeuroD1 expression among four SCLC cell lines (Supplementary Fig. 1). SNPs in H3K4me3, as one of the histone modification markers, related to promoter regions were also evaluated. Through ChiP-seq of NeuroD1 and H3K4me3, SNPs in promoter regions with high peaks in both NeuroD1 and H3K4me3 were selected as putative functional SNPs. In the H82 and H524 cell lines, 435 and 1,302 SNPs were collected, respectively, in the regions where the NeuroD1 peak and H3K4me3 peak coincide. Among 1,737 SNPs, 230 were prepared for genotyping, except for SNPs with low minor allele frequencies (≤ 0.2 by HapMap-JPT data) and those in linkage disequilibrium (r2 > 0.8) assessed using TagSNP in the SNPinfo web server (https://snpinfo.niehs.nih.gov/). After excluding 13 SNPs with genotyping failure and 46 SNPs with a deviation from the Hardy–Weinberg equilibrium (P < 0.05) or a low call rate (< 95%), 171 SNPs were evaluated for the association with the clinical outcomes of patients with SCLC (Supplementary Table 1). Genotyping was performed using an iPLEX Assay and MassARRAY System (Agena Bioscience, San Diego, CA, USA).
Cell culture and antibodies
The H82 and H524 cells were obtained from the American Type Culture Collection. Cells were cultured at 37°C in a humidified atmosphere with 5% CO2 in RPMI medium (Corning Inc., Corning, NY, USA) supplemented with 10% FBS (Corning Inc.), 100 U/mL penicillin, and 100 mg/mL streptomycin. Anti-NeuroD1 antibody (4373) from Cell Signaling Technology (Danvers, MA, USA) and H3K4me3 antibody (ab8580) from Abcam (Cambridge, UK) were used in this study.
ChIP-seq and data analysis
ChIP-seq was essentially performed in the H82 and H524 cells as previously described17 using anti-NeuroD1 and H3K4me3 antibodies. ChIP-seq library was prepared using a TruSeq ChIP Library Preparation Kit (Illumina, San Diego, CA, USA). Sequencing was performed on an Illumina NovaSeq 6000 system. Sequence reads for each sample were aligned to the human genome (hg19) using Bowtie (version 1.1.2 parameter set -n 2 -m 1 -X 500),18 allowing up to two nucleotide mismatches to the reference genome per seed and returning only uniquely mapped reads. Mapped data (SAM file format) were sorted and indexed using SAMtools (version 1.9).19 Then, duplicate reads were excluded using a MarkDuplicates module in Picard (version 1.118). Peaks were called in the aligned sequence data using a model-based analysis of ChIP-seq (MACS2 version 2.1.1).20 ChIPseeker (version 1.6.6),21 a bioconductor package within the statistical programming environment R (version 3.5.1) to facilitate batch annotation of enriched peaks, was used to identify nearby genes and transcripts from the peaks obtained from MACS2. For variant calling, we identified regions where the peaks of the samples for each combination overlap. In the BAM file for each sample, reads aligned to the region were used in the downstream analysis. The aligned reads that can be used in the analysis were created through Split ‘N’ Trim, mapping quality reassignment, indel realignment, and base recalibration process. The aligned reads are used for variant calling with HaplotypeCaller. Variant filtering for each sample was performed based on Fisher Strand values (> 30.0) and Qual By Depth values (< 2.0) in the VariantFilteration module of GATK v2015.1-3.4.0-1-ga5ca3fc.222324 The datasets for ChIP-seq (NeuroD1 and H3K4me3) have been deposited and are available at Gene Expression Omnibus (accession no. GSE211475) (https://www.ncbi.nlm.nih.gov/geo/query/acc.cgi?acc=GSE211475).
ChIP–quantitative polymerase chain reaction (qPCR) assay
Chromatin from H82 and H524 cells was immunoprecipitated using the Pierce Magnetic ChIP kit (Thermo Fisher Scientific, Waltham, MA, USA) using 10 µg of anti-NeuroD1 and anti-H3K4me3 antibodies and 2 µg of normal rabbit IgG antibodies per immunoprecipitation reaction. ChIP DNA was subjected to real-time qPCR using SYBR Green PCR Master Mix (Qiagen, Hilden, Germany) with the following primers: ring finger protein 145 (RNF145) forward, 5′-GGCTCGCGAAGAAAAACGCG-3′; RNF145 reverse, 5′-CCCTTCTGTCTTCTCCCTCC-3′; cyclin-dependent kinase 2 interacting protein (CINP) forward, 5′-CCTCACTCCGCTCCAGTTTC-3′; and CINP reverse, 5′-CAGGGGCTCCCCTTTACT-3′. ChIP–qPCR enrichment analysis was performed using the comparative Ct method. Each sample was normalized to the input, and the fold difference between the sample and IgG was calculated using 2(−ΔΔCt).25
Promoter–luciferase constructs and luciferase assay
We determined the effect of rs2043268A>G or rs762105A>G on the activity of the promoter of RNF145 or CINP using a luciferase reporter assay. A 393-bp fragment including rs2043268A>G and a 535-bp fragment including rs762105A>G were synthesized by PCR using human genomic DNA with the following primers: RNF145 forward, 5′-CCGCTCGAGTCCCTTCGTCTTACCCTGCT-3′; RNF145 reverse, 5′-CCCAAGCTTTATCTCGCCAAGGGTGCTGA-3′; CINP forward, 5′-CCGCTCGAGCAGGCCTTGACACTCATCCA-3′; and CINP reverse, 5′-CCCAAGCTTCTGGTATCCCACATTCTGCC-3′. The PCR products were cloned into the XhoI/HindIII site of the pGL3-basic vector (Promega, Madison, WI, USA). The correct sequences of all clones were confirmed by DNA sequencing. All constructs were confirmed by direct sequencing before use. The SCLC cell line H446 was transfected with each reported construct and pRL-SV40 Vector (Promega) using a lipofectamine 2000 transfection reagent (Thermo Fisher Scientific) according to the manufacturer’s protocol. The cells were collected 48 hours after transfection, and lysates were prepared using the Dual-Luciferase Reporter Assay System (Promega). The luciferase activity was measured using a Synergy HTX Multi-Mode Microplate Reader (BioTek Instruments). Firefly luciferase activity measurements were normalized with respect to pRL-SV40 Renilla luciferase activity to correct for variations in transfection efficiency.
Statistical analysis
The response to chemotherapy was analyzed as the ratio of responders and nonresponders according to clinical variables and genotypes. The adjusted odds ratio (aOR) and 95% confidence intervals (CIs) were calculated using logistic regression analysis. For survival assessment, the period from the first day of chemotherapy to the date of patient death or last follow-up was calculated and defined as the overall survival (OS). The log-rank test and Kaplan-Meier method were used to analyze the estimated OS according to the clinical variables and genotypes. To determine the association between SNPs and OS, the adjusted hazard ratio (aHR) and 95% CIs were calculated using multivariate statistical models (Cox proportional hazards models). The following clinical factors were adjusted: age, sex, smoking status, clinical stage, Eastern Cooperative Oncology Group performance status, weight loss, chemotherapy regimen, second-line chemotherapy, neuron-specific enolase, and radiation to the tumor. All statistical analyses were conducted using the Statistical Analysis System version 9.4 for Windows (SAS Institute, Cary, NC, USA).
Ethics statement
This study was approved by the Institutional Review Board of Kyungpook National University Hospital (Approval No. KNUCH 2020-03-040). Blood samples for genotyping were provided by the National Medical Center-KNUH Biobank with support from the Ministry of Health, Welfare and Family Affairs. Informed consent was submitted by all subjects when they were enrolled. This study was conducted in accordance with the Declaration of Helsinki and Good Clinical Practice guidelines.
RESULTS
Study population and clinical variables
The chemotherapy response and OS according to the clinical variables of 261 patients are presented in Supplementary Table 2. A total of 190 patients had a complete or partial response after first-line chemotherapy, with a response rate of 72.8% (95% CI, 67.4–78.2). Among the two chemotherapy regimens, the irinotecan–cisplatin regimen showed a higher response rate than the etoposide–cisplatin regimen, but there was no difference in OS. The median survival time was 10.5 months (95% CI, 9.3–11.4). Age, clinical stage, Eastern Cooperative Oncology Group performance status, weight loss, neuron-specific enolase, second-line chemotherapy, and radiation to tumor were the variables that affected OS (Supplementary Table 2). These variables were adjusted in the association analysis between SNPs and clinical outcomes.
Association between SNPs and clinical outcomes
Among the examined SNPs, two were associated with both chemotherapy response and OS. RNF145 rs2043268A>G was significantly associated with worse chemotherapy response and OS (under a recessive model, aOR, 0.50, 95% CI, 0.26–0.94, P = 0.031, and aHR, 1.88, 95% CI, 1.38–2.57, P < 0.001; Table 1, Fig. 1). CINP rs762105A>G was also significantly associated with worse chemotherapy response and OS (under a dominant model, aOR, 0.47, 95% CI, 0.23–0.99, P = 0.046, and aHR, 2.03, 95% CI, 1.47–2.82, P < 0.001; Table 1, Fig. 1). After stratification by stage, RNF145 rs2043268 was associated with chemotherapy response and OS in both limited disease (LD) and ED (Table 2). However, CINP rs762105 was associated with chemotherapy response and OS only in ED and not in LD (Table 2).
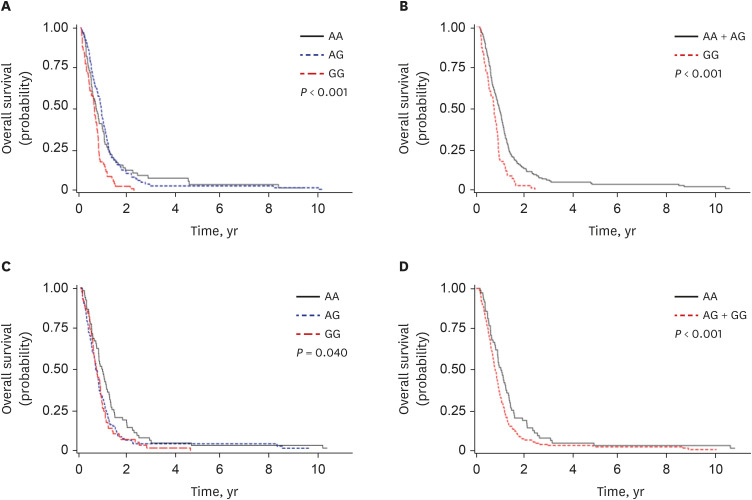
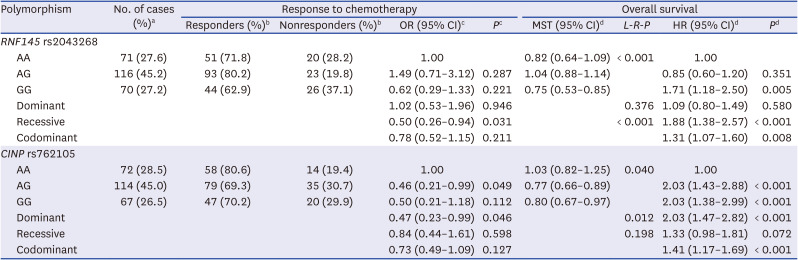
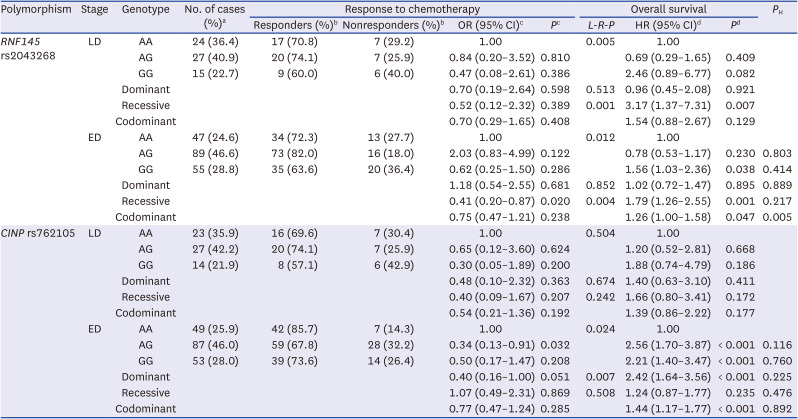
Fig. 1
Kaplan-Meier curves for overall survival according to polymorphisms. RNF145 rs2043268A>G (A, B) and CINP rs762105A>G (C, D). P values were calculated using log-rank (A, C) and multivariate Cox proportional hazards models (B, D).
![]()
Table 1
Polymorphisms and the association with the response to chemotherapy and overall survival
OR = odds ratio, CI = confidence interval, MST = median survival time (years), L-R-P = log-rank P, HR = hazard ratio, ECOG = Eastern Cooperative Oncology Group, NSE = neuron specific enolase.
aColumn percentage.
bRow percentage.
cORs, 95% CI, and their corresponding P values were calculated by multivariate regression analysis, adjusted for age, gender, smoking status, stage, ECOG performance status, weight loss, NSE level, and first chemotherapy regimen.
dHRs, 95% CI and their corresponding P values were calculated using multivariate Cox proportional hazard models, adjusted for age, gender, smoking status, stage, ECOG performance status, weight loss, NSE level, first chemotherapy regimen, 2nd line chemotherapy and radiation to primary tumor.
![]()
Table 2
Stratified analysis of the associations between polymorphism and clinical outcomes according to stage
LD = limited disease, ED = extensive disease, OR = odds ratio, CI = confidence interval, L-R-P = log-rank P, HR = hazard ratio, ECOG = Eastern Cooperative Oncology Group, NSE = neuron specific enolase.
aColumn percentage.
bRow percentage.
cORs, 95% CI, and their corresponding P values were calculated by multivariate regression analysis, adjusted for age, sex, smoking status, stage, ECOG performance status, weight loss, NSE level, and first chemotherapy regimen.
dHRs, 95% CI and their corresponding P values were calculated using multivariate Cox proportional hazard models, adjusted for age, sex, smoking status, stage, ECOG performance status, weight loss, NSE level, first chemotherapy regimen, 2nd line chemotherapy and radiation to primary tumor.
![]()
ChIP–qPCR assays in two SNP-containing regions
To confirm whether the two SNPs were located in the functional promoter or enhancer sites, we conducted ChIP–qPCR assays using antibodies against NeuroD1 and H3K4me3. The rs2043268-containing region demonstrated a much stronger fold enrichment of NeuroD1 and H3K4me3, which mark the active promoter, in both H82 and H524 cell lines (Fig. 2A and B). The rs762105-containing region also demonstrated a much stronger fold enrichment of NeuroD1 and H3K4me3 than IgG (Fig. 2C and D).
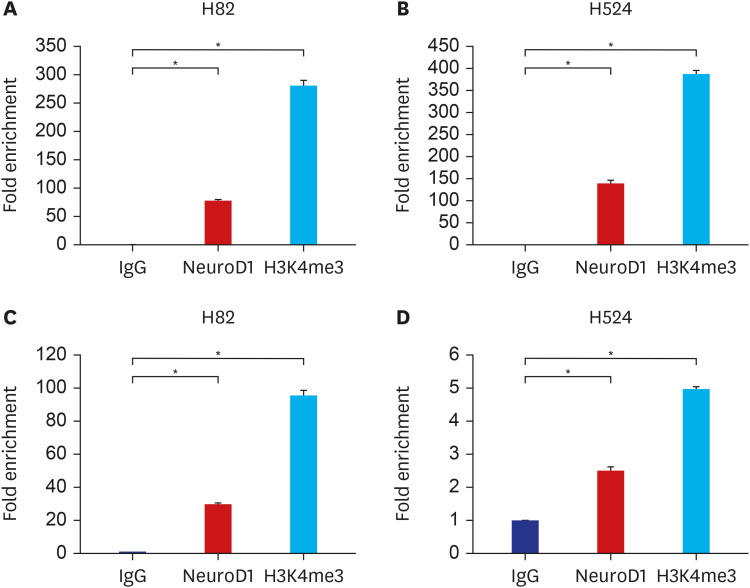
Fig. 2
ChIP–quantitative polymerase chain reaction analysis of NeuroD1 and H3K4me3 for RNF145 rs2043268 (A, B) and CINP rs762105 (C, D) in H82 and H524 cancer cell lines. Data are expressed as mean ± standard error of the mean, and P values were calculated using Student’s t-test.
NeuroD1 = neurogenic differentiation 1, H3K4me3 = H3 lysine 4 trimethylation.
*P < 0.001.
![]()
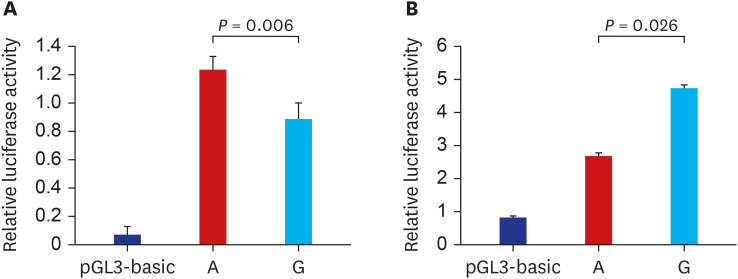
Effect of SNPs on the promoter assay of RNF145 and CINP
The results of ChIP–qPCR assays suggested that rs2043268A>G and rs762105A>G are regulatory SNPs that could affect the promoter activity of each gene. We conducted in vitro luciferase assays to determine whether the SNPs affect the promoter activity of each gene. The promoter activity of RNF145 was significantly lower in the rs2043268 G allele than in the rs2043268 A allele (P = 0.006, Fig. 3A). The promoter activity of CINP was significantly higher in the rs762105 G allele than in the rs762105 A allele (P = 0.026, Fig. 3B).
DISCUSSION
We investigated the association between SNPs in NeuroD1 and H3K4me3 coincident regions and the clinical outcomes of patients with SCLC using ChIP-seq for the selection of putative functional SNPs. Among 230 SNPs, two were significantly associated with both chemotherapy response and OS. ChIP–qPCR revealed that the two SNPs were located in the functional promoter region, and luciferase assays also demonstrated that these SNPs affected the promoter activities of each gene.
CINP encodes a protein that is a component of the DNA replication complex and a genome maintenance protein. CINP interacts with cell cycle-dependent kinase 2 and cell division cycle gene 7, which are essential for mitosis and DNA replication.26 In addition, CINP acts as a regulator of ataxia telangiectasia-mutated and Rad3-related checkpoint pathways that promote genome maintenance.27 In cancer, CINP, as a novel cofactor of Krüppel-like factor 5 (KLF5), plays a crucial role in promoting cell proliferation and survival and tumor growth.28 KLF5 exerts both suppressor and promoter functions in tumor growth, and knockdown of CINP was found to attenuate the promoting effects of KLF5 on cell proliferation and tumor growth.28 This result was consistent with that of our study, wherein we found that CINP rs762105A>G was significantly associated with worse chemotherapy response and OS in patients with SCLC. The luciferase assay showed that the promoter activity of CINP was higher for the rs762105 variant G allele than for the wild-type A allele. As reported in a previous study,28 in which CINP knockdown reduced cell proliferation and tumor growth, rs762105A>G increases the promoter activity of CINP, and this increase in the expression of CINP may exert a worse effect on the clinical outcome of patients with SCLC.
RNF145 encodes an ER-resident E3 ubiquitin ligase that plays an important role in regulating cholesterol metabolism.29 A recent study showed that RNF145 regulates cholesterol biosynthesis through sterol-induced degradation of HMG-CoA reductase.30 The role of cholesterol as a cancer pathogenesis or therapeutic target is a controversial topic. Nevertheless, studies have reported that the development of various cancers is related to cholesterol or its metabolites.3132 Some meta-analyses showed that cholesterol reduction with statins resulted in a favorable survival benefit for patients with cancers.3334 In lung cancer, in vitro studies have shown that statins induced cancer cell apoptosis, inhibited tumor angiogenesis and delayed metastasis.353637 Moreover, a meta-analysis of observational studies reported that statins improved the survival of patients with lung cancer.38 In our study, RNF145 rs2043268A>G was associated with worse chemotherapy response and OS in patients with SCLC. It is possible that RNF145 rs2043268A>G affected the biosynthesis of cholesterol and thus affected the prognosis of SCLC. Nonetheless, a recent meta-analysis reported that cholesterol reduction with statins did not affect mortality and OS in patients with lung cancer in randomized controlled trials.39 Hence, it is also possible that RNF145 affected the survival of patients with SCLC through pathways other than cholesterol metabolism. In oral squamous cell carcinoma, RNF145 promotes cancer progression by activating the nuclear factor kappa B signaling pathway and regulating IL-8 transcription.40 Further research is needed on the mechanism by which RNF145 affects lung cancer.
In the present study, we used ChIP-seq for the selection of putative functional SNPs. ChIP-seq can identify specific genomic regions, such as the transcription factors of promoters or other DNA-binding sites associated with specific proteins. Therefore, ChIP-seq can be a good method to identify functional SNPs considering that it can identify genome-wide DNA-binding sites for transcription factors and other proteins. Although it is not yet a widely used method for SNP selection, using ChIP-seq for SNP selection may have potential for further application in gene association studies.
In our previous study,13 we selected 121 potentially functional SNPs in NeuroD1 target genes associated with NeuroD1 expression by searching research articles and public databases. Of those selected SNPs, 32 were located in the promoter area and the remaining 89 were located in other regions (23 in 3′ UTR, 2 in 5′ UTR, 47 in intron, and 17 in exon). In the present study, we selected 230 SNPs in the promoter region with high peaks in both NeuroD1 and H3K4me3, and only one SNP (SLC8A3 rs8022091C>A) overlapped with the previously examined 121 SNPs. This may be due to the selection of SNPs that exhibit high-peak H3K4me3 among the lots of SNPs in the promoter regions. The fact that there were not many overlaps with the SNPs selected through existing databases or research papers suggests that SNP selection through ChIP-seq can play a complementary role.
One of the limitations of our study was that we did not include patients who received ICIs, the latest SCLC treatment. Because ICIs have been used for SCLC treatment in Korea for < 3 years, it was not included in the patient group of this study. Considering that ICI combination therapy is currently the standard treatment for ED-SCLC, further studies on ED-SCLC patients treated with ICI combination therapy are warranted. LD patients who received concurrent chemoradiotherapy were also excluded in this study. Therefore, it is unclear whether the SNPs identified in this study will affect the survival outcome of patients with LD, including those received concurrent chemoradiotherapy. Several previous studies have assessed genotype concordance between germline DNA and DNA isolated from tumor tissues. Very high genotyping concordance (> 97%) has been documented comparing germline DNA and with DNA isolated from tumor tissue.41 Additionally, the large sample size and genome-wide study provided strong evidence that the genotyping results using DNA isolated from peripheral blood and tumor tissue were remarkably similar at the genome level.42 Therefore, most modern association studies, including genome-wide association studies, use blood as a genomic DNA sample. Since blood samples were used as a genomic DNA source in this study, it is also necessary to consider the difference between somatic mutations in cell lines and germline mutations in blood.
To summarize, we investigated the association of putative functional SNPs in NeuroD1 and H3K4me3 coincident regions selected using ChIP-seq with the clinical outcomes of patients with SCLC. RNF145 rs2043268A>G and CINP rs762105A>G were significantly associated with both chemotherapy response and OS, and functional studies also showed that these variants affected the promoter activity of each gene.
 XML Download