

 PDF
PDF Citation
 Print
Print


INTRODUCTION
Breastfeeding (BF) is known to have various health benefits for both the baby and the mother, and many of these benefits increase with the duration of BF.12 Therefore, the World Health Organization(WHO) recommends ≥ 24 months of BF, while the American Academy of Pediatrics recommends ≥ 12 months, along with 6 months of exclusive BF.34 In line with international recommendations, the Korean Academy of Pediatrics strongly recommends 6 months of exclusive BF, especially through the National Health Screening Program for Infants and Children (NHSPIC), but it does not include formal guidelines for the maximum duration of BF and nutrition education based on them.56 A recent study using the Korean National Health and Nutrition Examination Survey (KNHANES) found that the prevalence of prolonged BF (PBF) duration ≥ 12 months has been approximately 33.7% for the past decade and has been declining more rapidly in recent years.7 This study found that PBF was significantly and positively associated with maternal education, specifically that mothers who chose to breastfeed for longer periods were more likely to apply nutritional knowledge to inform their dietary choices. Therefore, it can be assumed that active education emphasizing the important nutrition-related health benefits of PBF, such as that provided by the NHSPIC, could promote PBF in Korea.7
Recently, as the prevalence rates of childhood obesity and metabolic syndrome have increased worldwide, including in Korea, the preventive effects of BF on childhood and adult obesity have received more attention.128 The protective effects of BF against obesity and overweight may be associated with slower postnatal growth in breastfed infants, which is thought to involve behavioral as well as metabolic and hormonal mechanisms. In other words, breast milk is relatively low in protein and contains bioactive factors such as hormones involved in appetite control and energy metabolism.89 In addition, compared with bottle-fed infants, those who are directly breastfed are more likely to acquire better self-regulation of food intake and appetite control, which may persist into later life.10 Moreover, breastfed infants are constantly exposed to their mother's dietary flavors, which may increase their tolerance for bitter and sour tastes, leading to better food preferences for healthy foods such as vegetables and fruits in infancy.91011 These food preferences are thought to persist into later life,12 increasing the likelihood of developing healthy dietary patterns, which may contribute to reduced risks of obesity, metabolic syndrome, and other diseases. A recent Spanish study found that breastfed infants were more likely to consume a Mediterranean diet between the ages of 24–36 months, compared with formula-fed children.13 While few Korean studies have found meaningful differences in dietary patterns based on BF status, a recent study of children aged 2–3 years in KNHANES data was the first to report significantly better vegetable and fruit intake in breastfed children aged ≥ 12 months.14 However, the study did not examine differences in other dietary or nutrient intake.
A previous study using the last 10-year KNHANES data showed that Korean 12–23-month-olds not only had different growth outcomes based on PBF status but also had distinct differences in dietary patterns and nutrient intake.15 In other words, children with PBF consumed more grains and fruits and, less soy products (including soy milk), dairy products, protein, calcium, and iron per calorie. In this study, a significant proportion of children aged 12–23 months were not fully weaned and were consuming breast milk or formula; hence, BF intake might have influenced the results of the study. Exploring whether these differences persist beyond the age of 24 months, which is considered an age beyond the completion of weaning, may be essential to understanding the association between PBF and patterns of dietary and nutrient intake. Therefore, the present study sought to investigate significant differences in growth and dietary and nutrient intake patterns with and without PBF using data of 24-to-35-month-old toddlers participating in the KNHANES during the same period. The findings of this study are expected to provide a basis for education and recommendations for PBF of Korean children and to provide a useful information for healthcare providers to understand the growth and nutritional status of children of this age for providing counseling and nutritional education.
METHODS
Study design and population
This study was based on data from the KNHANES, which is conducted yearly since 2007 by the Korea Disease Control and Prevention Agency (KDCA). This nationwide cross-sectional survey selected representative households and children aged ≥ 1 year using a stratified and multi-stage clustered probability sampling design. The health interviews and examinations were performed by a trained survey team using face-to-face interview methods, while the nutritional surveys were conducted by dieticians during home visits, and they involved collecting detailed information on dietary behavior, food security, and food intake. The detailed description of the KNHANES design and data profile has been published as a separate paper.16
Data on body measurements, feeding behavior, and food and nutrient intake of children aged 24–35 months were extracted from the KNHANES conducted from 2010 to 2020. Children with a birth weight < 2.5 kg or without dietary information were excluded. Regarding feeding patterns, BF without formula feeding was defined as full BF, with or without the intake of complementary foods. In addition, continued BF for at least 12 months was defined as PBF. Accordingly, the study population was divided into two groups based on PBF status, and their growth and dietary pattern, and nutritional status at 24–35 months were analyzed. In addition, information on the education level of the mothers of these children and household income were extracted to adjust for factors that may affect dietary and nutrient intake patterns other than BF. Maternal educational level was classified into two categories: high school graduates or under (≤ 12 years) and college and university graduates or over (> 12 years). Household income was classified by quartiles and divided into four categories: low (< 25 percentile), middle-low (25–50 percentile), middle-high (50–75 percentile) and high (≥ 75 percentile).
Measurements
Weight and height were transformed into standard deviation scores (z-scores) for age and sex using the 2017 Korean National Growth Chart.17 Weight gain after birth was expressed as fold weight gain by dividing the current weight by the birth weight.18 Body mass index was calculated as weight divided by height squared. Obesity and overweight were defined as ≥ 95 and ≥ 85 percentiles for age and sex, respectively.
We extracted data on dietary behaviors from responses to the dietary questionnaire: feeding type (BF or formula feeding), starting age and duration of each feeding module, starting age of complementary feeding, and daily dietary and nutrient intake patterns. Children who were breastfed at 12 months of age regardless of simultaneous formula feeding were defined as the PBF group. Conversely, children who were weaned before 12 months of age or never breastfed were defined as the non-PBF group.
The food intake questionnaire in the nutrition survey was designed as an open-ended survey using the 24-hour recall method. All dishes reported to be consumed in one day were classified into 22 different food codes representing food groups. Each dish and food was converted to a tertiary food code based on the reference food, which was used to calculate the intake of the food group. The amount of each food group was summed up by each participant, and the total daily intake of the following 16 food groups were used as variables for analysis: cereals and grains, potatoes and starch, sugars and sweeteners, legumes and soy products, nuts and seeds, vegetables, fungi and mushrooms, fruits, seaweed, seasonings, oil and fat, meat and poultry, eggs, fish and shellfish, milk and dairy products, and beverages. In addition, soy milk from the legume and soy product group, red meat from the meat and poultry group, anchovies from the fish and shellfish group were extracted as variables for further analysis.
Nutrient intake was calculated based on food data consumed in the last 24 hours and expressed as total daily nutrient intake, which does not include intake from breast milk or dietary supplements. Nutrient variables used in this study were energy, carbohydrate, dietary fiber, sugar, protein, fat, saturated fatty acid (SFA), n-3 fatty acid, cholesterol, calcium, phosphorus, iron, sodium, potassium, vitamin A, thiamin, riboflavin, niacin, folic acid, and vitamin C. We had only partial data in several variables because they were not analyzed from 2010: SFA, n-3 fatty acid, and cholesterol from 2013, dietary fiber from 2015, and sugar, vitamin A, and folic acid from 2016.
Nutrient intake adequacy was determined based on age-specific intake reference values from the 2020 Dietary Reference Intake (DRI) for Koreans.19 Nutrient intake inadequacy was defined as total calorie intake less than the estimated energy requirement of 900 kcal/day for children aged 24 to 35 months. Inadequate carbohydrate, protein, calcium, phosphorus, iron, and vitamins intake were defined as those less than the estimated average requirement for age: 100 g/day for carbohydrate, 15 g/day for protein, 400 mg/day for calcium, 380 mg/day for phosphorus, 4.5 mg/day for iron, 190 ug RAE (retinol activity equivalent)/day for vitamin A, 0.4 mg/day for thiamin and riboflavin, 4 mg/day for niacin, 120 ug/day for folic acid, and 30 mg/day for vitamin C. Dietary fiber less than 15 g/day or 12 g/1,000 kcal and potassium less than 1,900 mg/day were considered inadequate according to the adequate intake for age group. Energy from sugar > 20% and sodium >1,200 mg/day were considered inadequate based on the required intake for chronic disease risk reduction. In addition to the DRI, 7 g/day (age + 5 g/day),20 which is considered another criterion for inadequate dietary fiber intake, was also included and analyzed.
Statistical analyses
Sample weights were constructed to represent the Korean population by considering the complex survey design, non-response rate, and post-stratification, and they were applied to all analyses. Complex sample analysis using Rao–Scott χ2 test and a generalized linear model were used to evaluate the differences in categorical and continuous variables, respectively, according to BF practice. Data are presented as weighted percentages with standard errors for categorical variables and as weighted mean ± standard errors for continuous variables. To analyze the associations of BF practice with growth parameters, dietary patterns, or nutrient intake, complex sample multiple linear or logistic regression analysis was used to estimate adjusted regression coefficients (β) or odds ratio and 95% confidence intervals (CIs) of BF after adjusting for possible confounders. All analyses were performed using SAS software version 9.4 (SAS Institute Inc., Cary, NC, USA). Statistical significance was set at P < 0.05.
Ethics statement
The KNHANES was reviewed and approved by the Institutional Review Board (IRB) of the KDCA (IRB Nos. 2010-02CON-21-C, 2011-02CON-06-C, 2012-01EXP-01-2C, 2013-07CON03-4C, 2013-12EXP-03-5C, 2018-01-03-P-A, 2018-01-03-C-A, and 2018-01-03-2C-A), and written informed consents were obtained from the parents/guardians of all children included in the survey. This study was approved by the IRB of Boramae Medical Center (IRB No. 07-2023-17) and was conducted in compliance with the current revision of the Declaration of Helsinki and Good Clinical Practice guidelines.
RESULTS
Demographic characteristics and feeding behaviors of the study population
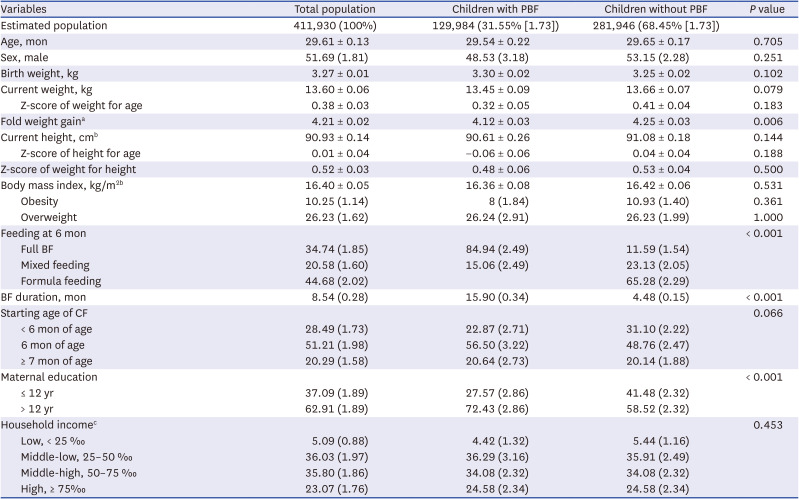
In total, 931 children aged 24–35 months with a birth weight ≥ 2.5 kg were included in the study, and their weighted mean age was 29.61 months. The total estimated population was 411,930: 129,984 (31.55%) in the PBF group and 281,946 (68.45%) in the non-PBF group. At 6 months of age, 34.74% of the study population were fully breastfed. The mean duration of BF in children with PBF was 15.90 months. Within the PBF group, 84.94% were fully breastfed at 12 months of age, and 8.25% were being breastfed at the time of the survey. There was no significant difference in the starting age of complementary feeding between the study groups, but the non-PBF group tended to commence complementary feeding earlier than the PBF group (P = 0.066).
Maternal educational level in the PBF group was significantly higher than that in the non-PBF group (> 12 years; 72.43% vs. 58.52%, P < 0.001). However, there was no difference in household income between the study groups (P = 0.423). The detailed characteristics of the study population are presented in Table 1.
Table 1
Growth status, feeding behavior and demographic characteristics of the study population (N = 931)
All continuous variables were expressed as weighted mean ± SEs. All categorical variables were expressed as weighted percentages (SE).
PBF = prolonged breastfeeding, BF = breastfeeding, CF = complementary feeding.
aFold weight gain was calculated as the current weight divided by birth weight.
bThe number of participants with information about height and body mass index in the health examination survey was 853.
cThe number of participants with information about family income in the health examination survey was 816.
Growth, dietary patterns, and nutritional status of children with PBF
The growth, dietary patterns, and nutrient intake of children with PBF were analyzed by comparison with those of children without PBF.
Growth parameters
Birth weight (3.30 ± 0.02 kg vs. 3.25 ± 0.02 kg, P = 0.102), current weight (13.45 ± 0.09 kg vs. 13.66 ± 0.07 kg, P = 0.079), z-scores of current weight (0.32 ± 0.05 vs. 0.41 ± 0.04, P = 0.183), current height (90.61 ± 0.26 cm vs. 91.08 ± 0.18 cm, P = 0.144), and z-scores of current height (−0.06 ± 0.06 vs. 0.04 ± 0.04, P = 0.188) were not significantly different between PBF and non-PBF groups. However, children with PBF were significantly less likely to gain weight from birth, compared with those without PBF (4.12 ± 0.03 vs. 4.25 ± 0.03, P = 0.006). Body mass index, obesity, and overweight were not significantly different between the study groups (P = 0.531; P = 0.361; P = 1.000, respectively). Growth comparison between the groups is presented in Table 1.
Daily food group intake
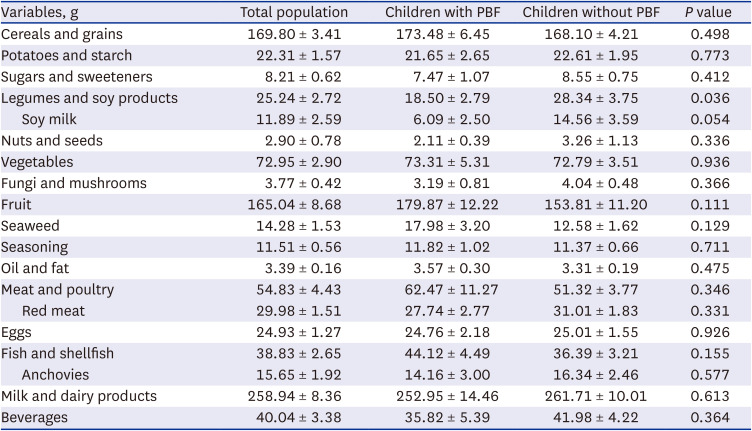
We compared the differences in daily food group intake patterns according to PBF status (Table 2). Children with PBF were significantly less likely to consume legumes and soy products (18.50 ± 2.79 g vs. 28.34 ± 3.75 g, P = 0.036) and tended to consume less soy milk (6.09 ± 2.50 g vs. 14.56 ± 3.59 g, P = 0.054), compared with those without PBF. There was no significant difference in the dietary patterns of other food groups between the PBF and non-PBF groups.
Table 2
Daily food group intake patterns of the study population (N = 931)
Daily nutrient intake
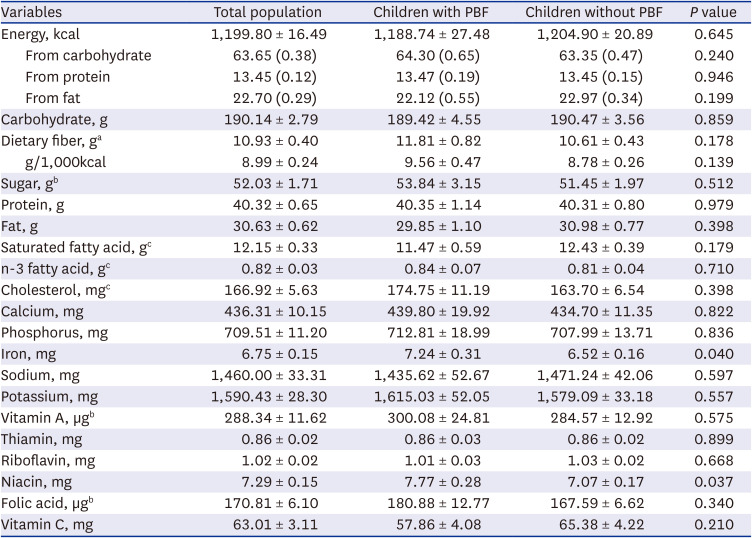
In the analysis of daily nutrient intake (Table 3), children with PBF had significantly higher intake of iron (7.24 ± 0.31 mg vs. 6.52 ± 0.16 mg, P = 0.040) and niacin (7.77 ± 0.28 mg vs. 7.07 ± 0.17 mg, P = 0.037) than children without PBF. Regarding inadequacy of daily nutrient intake (Table 4), there was no significant difference between the PBF and non-PBF groups. However, children with PBF had a slightly higher incidence of inadequate intake of protein, compared with children without PBF, with borderline significance (4.33 ± 1.53% vs. 1.61 ± 0.65%, P = 0.056). Notably, inadequate intake of dietary fiber (79.5%), calcium (49.4%), potassium (73.8%), and sodium (54.8%) was observed in nearly half or more of the children regardless of feeding type.
Table 3
Daily nutrient intake of the study population (N = 931)
All continuous variables were expressed as weighted mean ± SEs. All categorical variables were expressed as weighted percentages (SEs).
PBF = prolonged breastfeeding, SE = standard error.
aThe number of participants with information about dietary fiber in the health examination survey from 2015 was 447, and the estimated population was 223,937.
bThe number of participants with information about sugar, vitamin A, and folic acid in the health examination survey from 2016 was 377, and the estimated population was 182,740.
cThe number of participants with information on saturated fatty acids, n-3 fatty acids, and cholesterol in the health examination survey from 2013 was 622, and the estimated population was 295,730.
Table 4
Inadequacy of daily nutrient intake in the study population (N = 931)
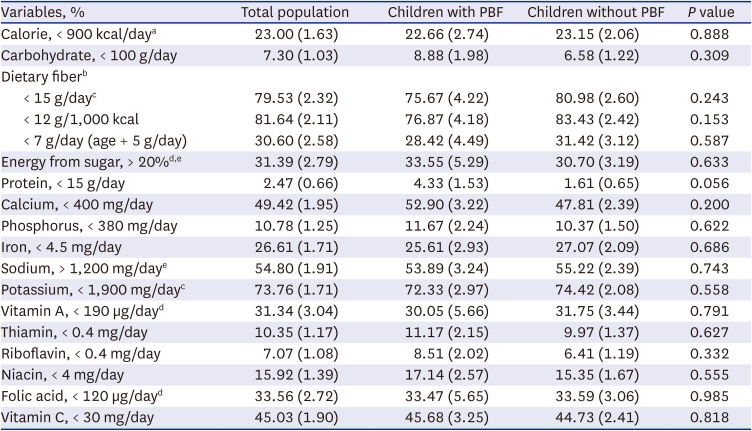
All categorical variables were expressed as weighted percentages (standard errors).
PBF = prolonged breastfeeding.
Most variables were compared with estimated average requirement except for calorie, dietary fiber, potassium, energy from sugar, and sodium.
aEER (estimated energy requirement) for calories.
bThe number of participants with information about dietary fiber in the health examination survey from 2015 was 447, and the estimated population was 223,937.
cAI (adequate intake) for dietary fiber and potassium.
dThe number of participants with information about sugar, vitamin A, and folic acid in the health examination survey from 2016 was 377, and the estimated population was 182,740.
eCDRR (chronic disease risk reduction intake) for energy from sugar and sodium.
Association of PBF with growth status, dietary patterns, and nutrient intake
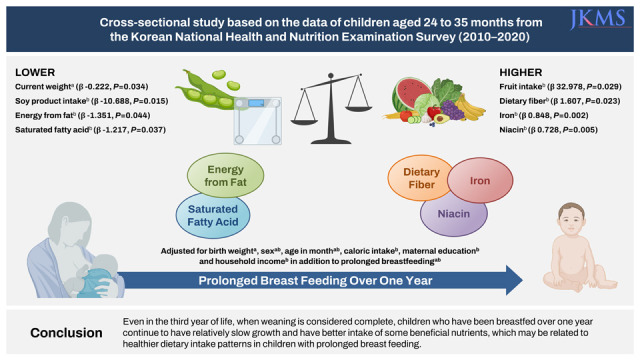
We evaluated the association of PBF with growth parameters with P < 0.2 in the univariate analysis in Table 1, adjusting for sex, age in month, and birth weight (Table 5). PBF was significantly associated with lower current weight (β [95% CI], −0.222 [−0.428, −0.017], P = 0.034). Regarding food group and nutrient variables with P < 0.2 in Tables 2-4, sex, age in month, total caloric intake, maternal educational level, and household income were adjusted to analyze the associations between BF practice and dietary pattern or nutrient intake (Table 5). Regarding dietary pattern, PBF was significantly associated with lower legume and soy product intake (β [95% CI], −10.688 [−19.314, −2.062], P = 0.015), lower soy milk intake (β [95% CI], −0.033 [−0.064, −0.003], P = 0.033), and higher fruit intake (β [95% CI], 32.978 [3.349, 62.608], P = 0.029). Regarding nutrient intake, PBF was significantly associated with higher dietary fiber (β [95% CI], 1.607 [0.218, 2.996], P = 0. 034), iron (β [95% CI], 0.848 [0.317, 1.380], P = 0. 002), and niacin (β [95% CI], 0.728 [0.222, 1.235], P = 0. 005) intake and was significantly associated with lower SFA intake (β [95% CI], −1.217 [−2.364, −0.071], P = 0. 037) and lower percentage of energy from fat (β [95% CI], −1.351 [−2.666, −0.035], P = 0. 044).
Table 5
The association of prolonged breastfeeding with growth status, dietary patterns and nutrient intake
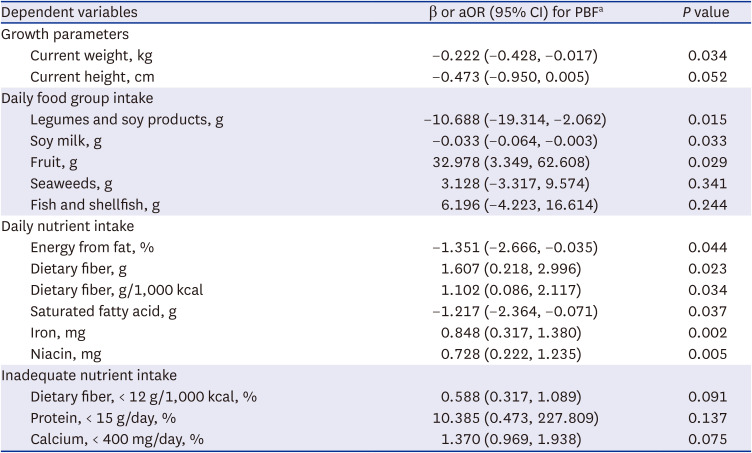
aOR = adjusted odds ratio, CI = confidence interval, PBF = prolonged breastfeeding.
aComplex sample multiple linear or logistic regression analyses were used to estimate the adjusted regression coefficients (β) or aOR and 95% CIs of the PBF; for growth parameters, sex, monthly age, birth weight were adjusted for in addition to PBF. For dietary and nutrient intake-related parameters, sex, monthly age, total caloric intake, maternal education, and household income were adjusted for in addition to PBF.
DISCUSSION
This study shows that, even after completion of weaning, at 24 to 35 months of age, differences in growth, dietary and nutrient intake patterns can be attributed to PBF. Children who were breastfed for more than a year gained less weight than those who were primarily formula-fed or who stopped BF earlier and had significantly lower legume and soy product intake and higher fruit intake. Moreover, intake of some nutrients, such as iron, niacin, and dietary fiber, were significantly higher, while the intake of SFAs were significantly lower, after adjusting for confounders, suggesting that children who were breastfed for longer periods of time may have healthier dietary and nutrient intake patterns at this age.
The main findings of this study indicate that dietary preferences of mothers and children who prefer long-term BF may be healthier during weaning and beyond, compared to those of mothers and children who do not prefer long-term BF. Previous research has shown that, in addition to innate preferences, a baby's food preferences are also influenced by the mother's diet, which they are exposed to through amniotic fluid and breast milk; thus, if the mother has a healthy dietary pattern, it is more likely to positively influence the development of the baby's food preferences.21 It is thought that the influence of mothers' higher education and nutritional knowledge in choosing PBF7 may have played a role in their food choices and their infants' weaning food choices; however, differences in dietary and nutrient intake by PBF status remained significant after adjusting for maternal education (> 12 years vs. ≤ 12 years) in the present study.
Previous research on how and by when breastfed children's growth differs from formula-fed children depends on the conditions of the study population and growth measurement parameters.2223242526 A recent Korean study of infants and toddlers from the NHSPIC found that infants who were exclusively breastfed for six months before the age of four were shorter and weighed lesser than those who were not, consistent with our findings.23 However, the degree of significance of the growth difference during 24–35 months of age was less than that during 12–23 months of age using the same methodology,15 with the difference in weight averaging 200 g vs. 400 g and the difference in weight gain decreasing from a 0.2 to 0.13. Additionally, the difference in height was not significant at age 2 years, nor was the difference in obesity. A European cohort study of BF duration and growth patterns found that BF duration and height and weight gain were negatively associated up to 12 and 24 months of age but not thereafter.22 Thus, as early as the third year of life, differences in growth by feeding type appear to be small or disappear.
Regarding food group intake, during 12–23 months of age, breastfed infants had higher intake of cereals and fruits and lower intake of legumes and dairy products.15 Most of these differences remained in the same direction in this study, but only legume and soy product including soy milk and fruit intake were significantly associated with PBF status after adjustment. The lower intake of legumes and soy products in the breastfed group appeared to be largely due to the lower intake of soy milk. Some parents limit soy intake, including soy milk, because they believe that high soy intake increases the likelihood of sexual precocity due to isoflavones.27 Given the limited recommendations for soy-based formulas, the relatively low intake of soy milk in the PBF group is thought to be a desirable dietary pattern. However, although there are concerns that intake of isoflavones above a certain amount in infancy and early childhood may affect reproductive parameters in later life,28 there appears to be no basis for limiting the intake of legumes and soy products in daily diet, except for the consumption of soy-based formulas in infancy. Soy products are a good source of dietary fiber along with protein; therefore, consumption of soy products other than soy milk should be highly encouraged, especially if there is a history of long-term BF.
In the present study, higher dietary fiber intake was significantly associated with PBF, and this could be explained by the finding that children with PBF had higher intake of the cereal, fruits and vegetables, and seaweed food groups than children without PBF, although no statistically significant differences were found except for fruit. In a recent Australian study that followed dietary fiber intake from ages 9 to 60 months, children who were breastfed for at least six months and those whose mothers had a college education or higher were less likely to have a low fiber intake pattern.29 Dietary fiber has a number of positive effects on health; most notably, it is an energy source for the gut flora, which is essential for a healthy immune system.30 Low dietary fiber intake has been linked to gastrointestinal disorders such as childhood-onset constipation and irritable bowel syndrome, as well as allergies and various autoimmune disorders,31 and eventually, it is known to be very important in reducing the risk of obesity, metabolic diseases and cardiovascular disease, etc.30 In the past, KNHANES data have shown that dietary fiber intake was relatively adequate in Korean adults, with the intake being more deficient than adequate at younger ages.193233 However, the 2020 DRI, which is stricter than the 2015 standard, showed significant increases in dietary fiber inadequacy across all age groups, with about 67% of all Koreans consuming inadequate amounts.19 Many international standards for dietary-fiber intake have also been raised in recent years,31 with the UK's recent national diet and nutrition survey showing an average dietary fiber intake of 10.4 g for children aged 1.5 to 3 years, similar to the result of the present study, with only 12% of the children meeting the recommended intake.34 However, even with use of the 7 g (age + 5 g), criterion previously considered the minimum dietary fiber intake at 2 years of age,20 30.6% of children in the present study were significantly underserved, suggesting the need for active education to emphasize dietary fiber intake in this age group.
To the best of our knowledge, the observation that iron and niacin intake were higher in the PBF group appears to be a finding rarely reported in the literature. A previous Korean study in primary school children has reported that inadequate intake of iron and niacin were more common in households with lower income, regardless of parental education level, suggesting that intake of these nutrients may be associated with better dietary patterns.35 Regarding iron intake, a previous study has shown that Korean infants who are predominantly breastfed until late infancy are at risk of iron deficiency in the absence of adequate supplemental dietary intake.18 Iron intake was also significantly lower in the PBF group at 12–23 months in the previous KNHANES study15; however, it was higher in the PBF group at 24–35 months of age in the present study. This finding is probably related to the higher education level of mothers in the PBF group.7 In other words, mothers' perception that iron intake may be low during BF is thought to be associated with food choices that lead infants and toddlers to consume more iron-rich foods.1936 Although not significant in the present study, the PBF group tended to consume more of the meat, seafood, grains, and vegetables group, which are considered good sources of iron. On the other hand, this study also suggests that iron intake above the recommended amount is due to higher overall food intake, not higher intake of a particular food, which is similar to the results of the 12–23-month-old toddler study.15 Although the overall average intake and adequacy of intake have been improved compared with what was reported in KNHANES 2007–2009,37 the rate of iron intake inadequacy in this age group still seems to be the highest among the pediatric age groups, except for adolescent girls.193839 Iron is particularly important for infant growth, neurodevelopment, and immune function40; therefore, dietary intake should be emphasized. In particular, there may be a need to emphasize the consumption of green vegetables, not just meat, in order to develop healthy eating habits.
Niacin, also known as vitamin B3, forms the coenzymes nicotinamide adenosine dinucleotide (NAD) and NAD phosphate, which are important in cell differentiation and DNA (deoxyribonucleic acid) processing, fatty acid and steroid synthesis, and the respiratory chain.41 Therefore, it is considered very important in the developing pediatric age. Fortunately, the adequacy of niacin intake was better in this age group in our study than in Korean adults.3839 The main sources of niacin are meat, fish, poultry, cereals, and green vegetables,41 which could explain the higher intake in PBF group.
Because SFAs can be synthesized by the body and can raise LDL (low density lipoprotein) cholesterol even in children and adolescents when consumed in excess,42 the Korean Dietary Guidelines recommend less than 7% of total energy from the age of 3 years and above, which is similar to international standards.19 Although there are limitations, such as the lack of DRI criteria to assess adequacy of intake at 2 years of age19 and the fact that SFA intake through breast milk was not summed for a small number of toddlers at the time of the study, the significantly lower SFA intake in the PBF group may suggest that they are probably forming a healthier dietary pattern in terms of cardiometabolic disease risk.43 The highest SFA intake per serving among Koreans was found to be in fast foods such as cakes, hamburgers, pizza, ramen, and ice cream, all of which are commonly consumed by children and adolescents.19 Therefore, it is expected that the intake of these food would be relatively low in the PBF group, which could be further explored in future analyses by individual food type.
In addition to dietary fiber, intake of calcium, potassium, and sodium were found to be inadequate in nearly half or more of the children in this study, regardless of feeding type. Majority of Koreans of all ages, including children, consume these minerals inadequately.19 In a previous study of children aged 12–23 months, the calcium intake per calorie was significantly lower in the PBF group, and its inadequacy was primarily associated with lower intake of dairy products.15 However, in the present study, neither calcium intake nor dairy intake was significantly different according to PBF status. In addition, calcium intake was slightly better than the 2007–2009 rate of inadequate intake among 2-year-olds at 55.2% (< 390 mg).37 Although the adequacy of calcium intake is better in 1–2-year-olds compared with Korean adults and school-aged children, calcium intake should be emphasized more, given the near majority of those consuming below the adequate intake for skeletal growth.193839 The average calcium intake for 2–3-year-olds in the 2016 U.S. national data, including supplementation, was over 900 mg, with a reported nutrient adequacy rate of over 88% of children consuming more than the RDA (recommended daily allowances) of 700 mg.44
Sodium and potassium intake has been linked to the risk of high blood pressure, stroke, and heart disease.45 According to WHO recommendations, desirable potassium intake is linked to sodium intake, ideally in the same molar ratio.46 Therefore, sodium intake guidelines have been established to reduce the risk of chronic disease, and potassium adequacy recommendations are based on actual sodium intake.19 According to the KNHANES data, inadequate intake of sodium was more prevalent in older children, while inadequate intake of potassium was more prevalent in younger children.193839 Inadequate potassium intake was also prevalent in 2–3-year-olds in the US in 2016, with an average intake of 1,890 mg, which is higher than the 1,591 mg in this study; however, the adequate intake rate was 62%, significantly lower than the rates for other nutrients.44 Potassium is found in almost all foods but is especially abundant in legumes, nuts, vegetables, and fruits46; therefore, it is important to encourage children this age to eat more vegetables and fruits, along with efforts to reduce salt intake.
This study has some limitations. First, because nutrient and food group amounts were calculated from a single 24-hour recall diary, this study may be subject to recall bias and limitations in representativeness of an individual’s average dietary pattern.47 Second, the calculated intake of each nutrient may be slightly lower than the actual intake in the PBF group because intake through breast milk, although very small44 and only applicable to a small proportion of children, is not presented in the KNHANES data and therefore not included in the calculated total nutrient intake. Therefore, the actual difference in intake between the two groups may be slightly larger or smaller than the calculated difference in intake between the two groups; for example, for SFA, the actual difference in intake between the two groups may be slightly smaller than that indicated by the results of this study. Lastly, other factors that may have influenced the differences in dietary patterns and nutrient intake, such as complementary feeding patterns, were not included in the analysis, which may limit the interpretation of the causal relationship between BF and dietary and nutrient intake patterns. However, since it used the KNHANES data from the last 10 years, a strength of this study is that it is representative of the Korean population. In addition, to the best of our knowledge, this is the first study to show the differences in overall dietary and nutrient intake patterns according to the PBF status in Korean toddlers in their third year of life.
In conclusion, even in the third year of life, when weaning is considered complete, children who have been breastfed over one year continue to have relatively slow growth and have better intake of some beneficial nutrients, which may be related to healthier dietary intake patterns in children with PBF. This supports the knowledge that BF may be an important factor in shaping the development of food preferences in infants and toddlers, and it is another piece of evidence that PBF may be the foundation for lifelong health of children. Future analyses in later age groups are required to determine if the differences according to PBF status persist into later childhood. The findings of this study may support PBF recommendations for infants and toddlers in Korea and can help healthcare providers understand the growth and nutritional status of children in this age group to provide counseling and nutrition education.
 XML Download