

 PDF
PDF Citation
 Print
Print


INTRODUCTION
Mineral trioxide aggregate (MTA) is widely indicated in dentistry for several clinical applications due to its successful long-term results [1]. However, to overcome its drawbacks, such as a long setting time, tooth discoloration, and handling properties, bioactive endodontic cements, such as Biodentine (Septodont, Saint Maur des Fossés, France) have been developed [12]. Intermediate restorative material (IRM; Dentsply DeTrey, Konstanz, Germany) is a zinc oxide-eugenol–based cement that is generally used as a comparator when evaluating new root-end filling materials [34].
The potential of the root-end filling materials to adhere to the surrounding dental tissue is desirable to provide sealing and avoid bacterial leakage and contamination [5]. Therefore, it is important to evaluate the interactions between teeth and materials in dentistry, since gaps between the dentin and material could promote poor sealing [67]. The selection of an appropriate material is a challenge in clinical practice, mainly because there is little information about the adaptation of materials to dentin [8], which is critical for achieving favorable treatment outcomes.
Micro-computed tomography (micro-CT) is a 3-dimensional (3D) nondestructive and reproducible tool that is highly accurate for the evaluation of root canal filling quality and the presence of voids [391011]. Many studies have focused on evaluating the material/dentin using 3D information using micro-CT, but have presented significant variation in the reported voxel sizes used for scanning [35121314]. Voxel size is a factor that can impact image quality [15]. Consequently, the quality of the image could affect the segmentation technique, and therefore quantitative and qualitative measurements [16]. Low-resolution scanning can cause an underestimation of material density due to the partial-volume effect and an overestimation of object thickness [15]. Moreover, high resolution is crucial for obtaining accurate results in the calculation of voids, which can be underestimated at higher voxel sizes [10]. Although the smallest possible voxel size should be chosen for most studies, higher-resolution scans require longer acquisition times and generate large data sets [15].
There is a lack of information on the evaluation of endodontic materials and factors involved in micro-CT image postprocessing, such as resolution variables [1718]. Therefore, the aim of this study was to use micro-CT to evaluate the material/dentin interface voids and thickness of different endodontic cements at voxel sizes of 5, 10, and 20 µm. The null hypothesis was that there would be no difference between the different voxel sizes in the evaluation of the materials.
Go to : 
MATERIALS AND METHODS
Specimen selection and preparation
After approval by the Institutional Ethics Committee (#CAAE: 79779617.5.0000.5416), 12 extracted 2-rooted maxillary premolars were selected. Any teeth with previous root canal treatments, cracks, or perforations were excluded from the experiment. A digital radiography system (Kodak RVG 6100; Carestream, Rochester, NY, USA) was used to confirm the inclusion criteria of teeth with similar morphology and to obtain a homogeneous distribution of the samples. The initial sample selection was performed using G* Power (3.1.7 for Windows; Heinrich Heine, Universität Dusseldorf, Germany). The t-test for 2 independent groups was used with an alpha-type error of 0.05 and beta power of 0.95, based on a previous study [12]. The teeth were randomly assigned to 3 groups according to the root-end filling materials (n = 24).
Root-end resections were performed at 90° to the long axis for both roots of the selected premolars, using a high-speed hand-piece under constant water spray irrigation. To standardize the length of the root end resection, the teeth were fixed in condensation silicone (Oranwash; Zhermack SpA, Badia Polesine, Italy), and efforts were made to use the burs exactly 3 mm from the apex. After apicectomy, 3.0-mm-deep cavities were prepared using a P1 ultrasonic retrotip (0.5 mm in diameter; Helse Ultrasonic, Santa Rosa de Viterbo, SP, Brazil) and an ultrasound device (Ultrawave XS; Ultradent, South Jordan, UT, USA) at 50% power and using irrigation with distilled water. The movement of introduction and removal was performed with slight pressure in the direction of the long axis of the root canal.
MTA (Angelus, Londrina, PR, Brazil), Biodentine (Septodont) and IRM (Dentsply DeTrey) were mixed according to the manufacturers' instructions and the cavities were filled with the materials. The samples were kept in an oven at 37°C and 95% relative humidity for 24 hours. All procedures were performed with the aid of magnifying glass under ×3.5 magnification (Bio-Art, Sao Carlos, SP, Brazil), by a single operator who was previously trained and calibrated.
Image acquisition and reconstruction
All samples were scanned using SkyScan 1272 micro-CT system (SkyScan; Bruker, Kontich, Belgium). The parameters for image acquisition and correction settings during reconstruction of the images using NRecon software (V1.6.10.4; Bruker) are described in Table 1. All data sets were exported using the Digital Imaging and Communications in Medicine file format with an isotropic voxel size of 5 µm [18].
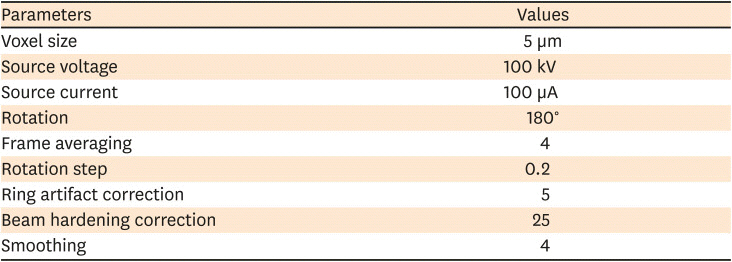
Image segmentation and analysis
For the evaluation of voids, the reconstructed images were segmented, differentiating material and dentin using CTAn software (V1.15.4.0; Bruker) at 5 µm, and after resizing the images isotropically [18]. The percentage of voids at the interface between the dentin surface of the root canal walls and the filling materials was evaluated based on the method described in a previous study [12]. The 3D distribution of the interface voids in a pre-defined volume of interest was calculated at 5, 10, and 20 μm using CTAn software. Three-dimensional models of the voids were created and exported to Materialise 3-matic (Materialise, Leuven, Belgium) to show the voids’ thickness.
Data sets were also imported for segmentation at 5, 10, and 20 µm into a dedicated tool developed in MeVisLab (MeVis Research, Bremen, Germany) in order to quantify the thickness of the materials [1819]. After segmentation using MeVisLab, morphological analysis was performed in Materialise 3-matic and the thickness of all materials was measured.
Statistical analysis
All data were analyzed with statistical software package GraphPad Prism 7.00 (GraphPad Software, La Jolla CA, USA). The normality of the data was tested using the D'Agostino and Pearson test. One-way analysis of variance and the Tukey test were used to test the statistical significance of differences between the materials and voxel sizes. The degree of agreement between the different voxel sizes was evaluated using the Bland and Altman method (MedCalc Software, Ostend, Belgium). Bland and Altman analysis is based on quantifying the agreement between 2 quantitative measurements, achieved by analyzing the bias between the mean differences, and estimating an agreement interval [20]. The level of significance was set at 5%.
Go to :
RESULTS
A box plot graph representing the materials’ thickness is presented in Figure 1. All materials showed an increase in their thickness from 5 to 10 and 20 µm (p < 0.05). The evaluation of materials using the 3-matic software can be visualized in Figure 2.
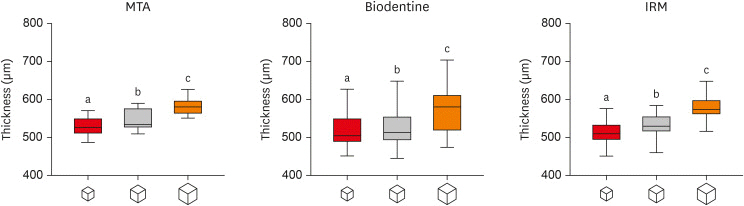 | Figure 1Box-plot graph representing the material’s thickness (µm) at 5 (small cube representing the smaller voxel size), 10 (medium cube representing the medium voxel size), and 20 µm (large cube representing the larger voxel size) for MTA, Biodentine, and IRM. Different letters (a, b, c) represent statistically significant difference among voxel sizes. Statistically significant differences were observed in the thickness of all materials from 5 to 10 and 20 µm.MTA, mineral trioxide aggregate; IRM, intermediate restorative material.
|
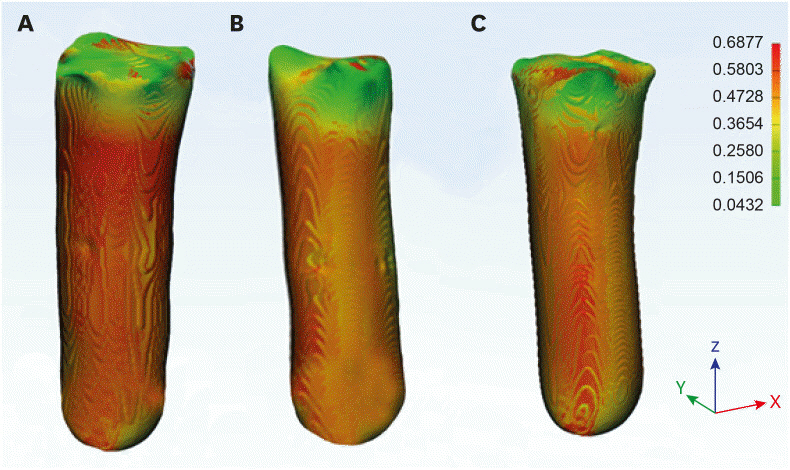
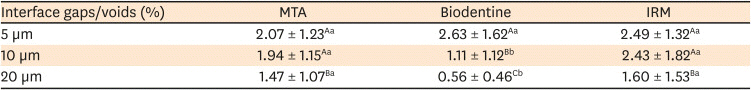
When evaluating the material/dentin interface, the cements showed a decrease in the percentage of voids when a greater voxel size was used (Table 2 and Figure 3). The percentage of interface voids was similar between the materials at 5 µm, while at 10 and 20 µm Biodentine showed lower values than MTA and IRM (p < 0.05). There was no significant difference between 5 and 10 µm for MTA and IRM (p > 0.05), while the voxel size of 20 µm was significantly different (p < 0.05). Biodentine showed statistically significant differences among all resolutions (p < 0.05). The Bland-Altman plots for comparison among voxel sizes showed the largest deviation when comparing images with 5 and 20 µm voxel sizes (Figures 4 and 5).
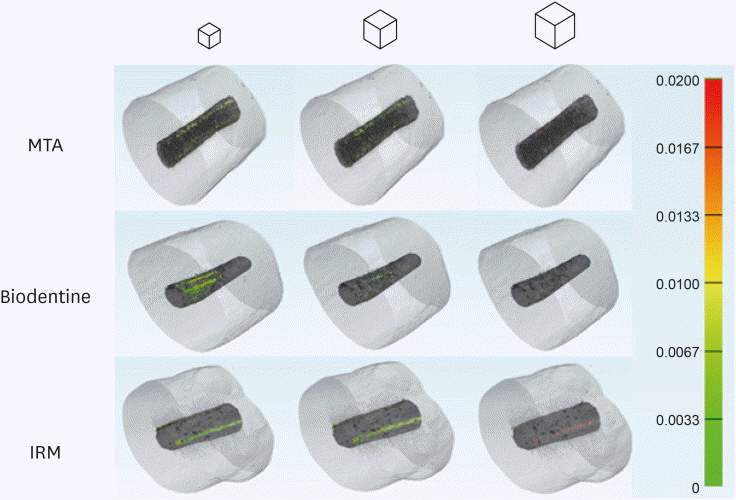 | Figure 3Three-dimensional models representing the interface gaps/voids of the MTA, Biodentine, and IRM cements at 5 (small cube representing the smaller voxel size), 10 (medium cube representing the medium voxel size), and 20 µm (large cube representing the larger voxel size). The color map shows the thickness (mm) of the voids.MTA, mineral trioxide aggregate; IRM, intermediate restorative material.
|
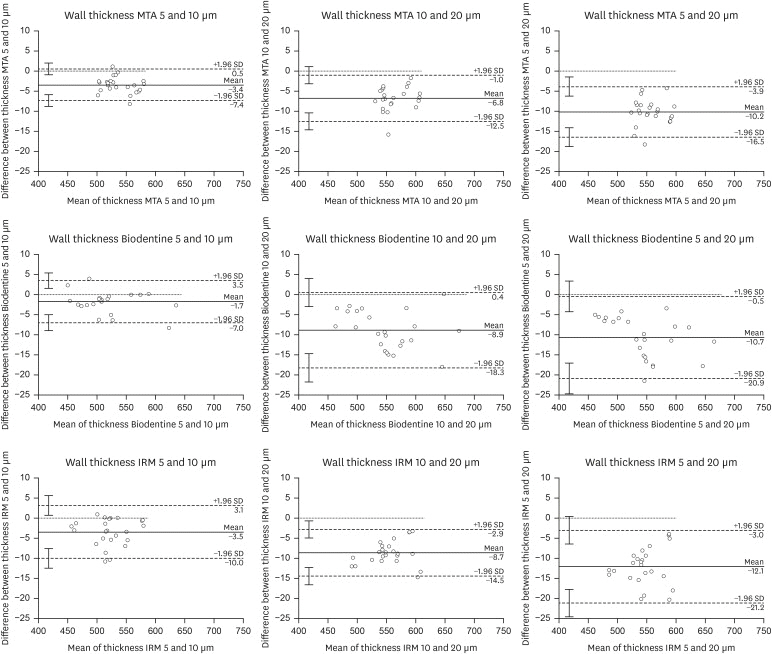 | Figure 4Bland-Altman plots for comparisons of agreement regarding wall thickness analysis according to voxel size. The difference between the measurements is plotted against their mean. The graphs represent MTA, Biodentine, and IRM, with comparisons between 5 and 10 µm, 10 and 20 µm, and 5 and 20 µm, respectively.MTA, mineral trioxide aggregate; SD, standard deviation; IRM, intermediate restorative material.
|
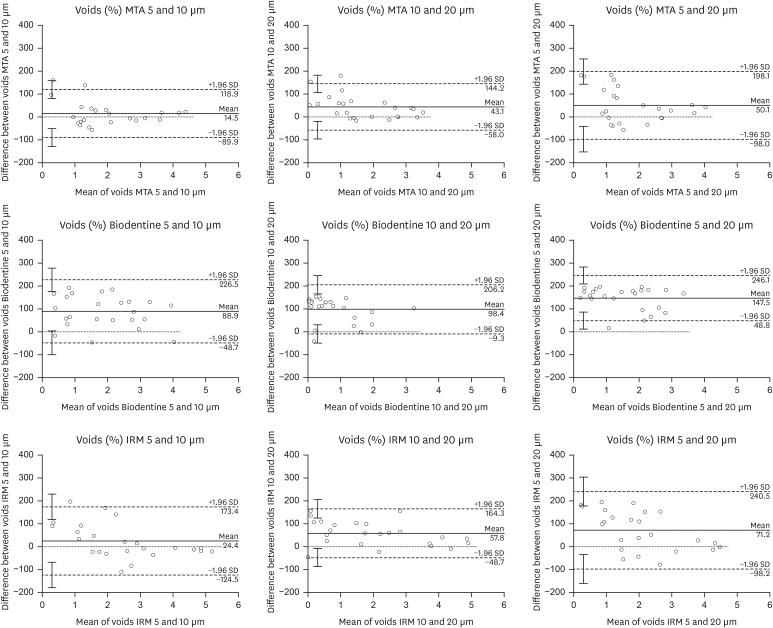 | Figure 5Bland-Altman plots for comparisons of agreement regarding interface gaps/voids of the cements according to voxel size. The difference between the measurements is plotted against their mean. The graphs represent MTA, Biodentine, and IRM, with comparisons between 5 and 10 µm, 10 and 20 µm, and 5 and 20 µm, respectively.MTA, mineral trioxide aggregate; SD, standard deviation; IRM, intermediate restorative material.
|
Table 2
Interface void values (%) using different voxel sizes observed in endodontic materials
| Interface gaps/voids (%) | MTA | Biodentine | IRM |
|---|---|---|---|
| 5 µm | 2.07 ± 1.23Aa | 2.63 ± 1.62Aa | 2.49 ± 1.32Aa |
| 10 µm | 1.94 ± 1.15Aa | 1.11 ± 1.12Bb | 2.43 ± 1.82Aa |
| 20 µm | 1.47 ± 1.07Ba | 0.56 ± 0.46Cb | 1.60 ± 1.53Ba |
The values are mean ± standard deviation.
MTA, mineral trioxide aggregate; IRM, intermediate restorative material.
*Different capital letters in the same column represent statistically significant differences among voxel sizes. Different lowercase letters in the same line represent statistically significant differences among materials (p < 0.05) (1-way analysis of variance and the Tukey test).
![]()
Go to :
DISCUSSION
Although micro-CT has been extensively used to characterize dental materials, specific guidelines for image acquisition, processing, and analysis have not been defined yet [1821]. Since the voxel size can have a significant impact on quantitative analyses using micro-CT, studies of image parameter dependency are essential to provide background information to support the choice of scan protocols and allow inter-study comparisons [1822]. Therefore, the current study was undertaken to determine the voxel size dependency in the accurate evaluation of the material/dentin interface and thickness of endodontic materials using 3D micro-CT imaging. A Bland and Altman plot was used to compare voxel sizes in regard to correlation and differences, by analysis of the same variable. The Bland and Altman analysis defines only the intervals of agreement, without determining whether or not the limits are acceptable [20]. However, the differences observed in the current study may highlight the effects of decreasing resolution on the accuracy of micro-CT quantification [17].
The wall thickness of the materials was evaluated using the 3-matic program (Materialise). According to the manufacturer, this analysis refers to the distance between a surface of the material and its opposite sheer surface. The wall thickness analysis takes a voxel-based approach. It is comparable to pixels in 2D, but it is used in 3D space and represented by a cube volume. The analysis tool splits up the 3D model into a series of voxel or cube-shaped volumes. The 3D triangulated surfaces are used to generate a finite element mesh, which is a commonly used method in the medical field in studies aiming to develop and validate a workflow to simulate treatment prior to an intervention [23]. Our results showed that the thickness of the materials increased when we increased the voxel size. This probably occurred because a lower spatial resolution induces errors in the calculation of the 3D images, creating an overestimation of some parameters and increasing the percent volume [24]. When the resolution of the image decreases, the partial-volume effect is expected, which is an inevitable phenomenon that occurs when neighboring voxels include multiple materials. The partial volume does not have the same attenuation value as any of the individual materials inside the voxel, and voxels at the external surface of the sample can contain volumes occupied by both materials. Therefore, completely accurate object volume measurements are not possible [2526]. The partial-volume effect depends on the size of the target object, the contrast between the object and background, the spatial resolution, the reconstruction method, and the smoothing filters used [27].
Unlike what occurred in the analysis of thickness, the assessment of the interface voids generally showed decreasing values when we increased the voxel size. Our findings showed no significant differences among the materials regarding their interface voids when evaluating images at 5 µm, in agreement with previous studies [282930]. However, at 10 and 20 µm, Biodentine showed lower void values than MTA and IRM. These values occurred since the micro-CT images are limited by the dimensions of the target object. If the resolution exceeds the dimensions of micropores or very thin structures, they are not correctly visualized [31].
When reducing the spatial resolution from 5 to 10 and 20 μm, our results showed a decrease in percentage of interface voids of 6% and 29% for MTA, 42% and 78% for Biodentine, and 2% and 35% for IRM, respectively. One explanation for the highest values of Biodentine may be the smaller voids present in its interface, as observed in Figure 3. This finding could be justified since MTA has difficult handling characteristics as a direct result of its granular consistency, while Biodentine has a hydro-soluble polymer incorporated into the water, which improves its handling properties [3233]. Moreover, the Biodentine powder presents a small and optimized particle size distribution [33]. Therefore, these characteristics could explain the low diameter of pores or voids in the cement-dentin interface for Biodentine [5]. A previous study compared different voxel sizes using nano-CT (1.5 and 5.0 μm) and micro-CT (5.2, 8.1, 11.2, and 16.73 μm) for the evaluation of root canal filling voids [10]. The authors suggested a voxel resolution of 11.2 μm as a cut-off value in micro-CT and nano-CT imaging, corroborating another study stating that 9.52 μm could be considered the optimal micro-CT-based resolution for the quantification of porosity in different materials [21]. These findings are in agreement with our results for MTA and IRM. The reliability of the evaluation using smaller voxel sizes when evaluating dental materials was shown with similar methodology [18].
A limitation of the current study is that the samples were digitized with a voxel size of 5 µm and the reconstructed images were resized to acquire images with larger voxel sizes. Although this method may overestimate the quality of the image, the voxel size was the only variable evaluated, allowing accurate comparisons between the same regions of interest [2634]. This method does not require a new scan, and the smaller voxel size used during the scan can be considered the gold standard for comparing other images with lower resolution [3536]. In addition, our results showed that smaller voxel sizes are preferable for assessing the thickness of materials and interface voids of cement, rejecting our null hypothesis. Even if a lower resolution makes these assessments possible, it is important to consider that the measures are approximations of the real values [22].
Go to :
 XML Download