INTRODUCTION
MATERIALS AND METHODS
Patient enrollment
Surgical procedure and postoperative management
Clinical evaluation
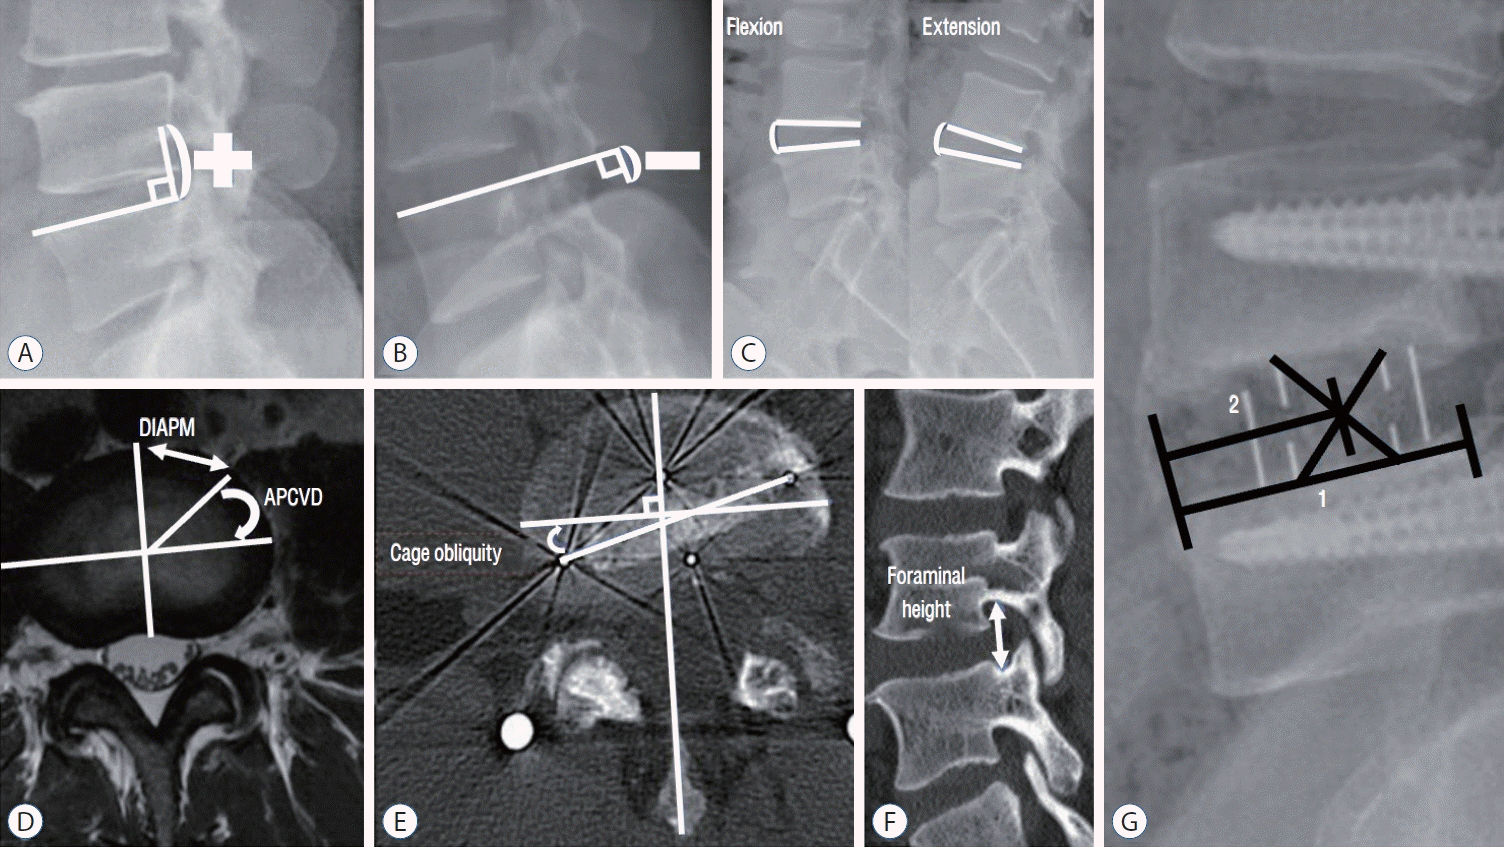
Radiologic evaluation
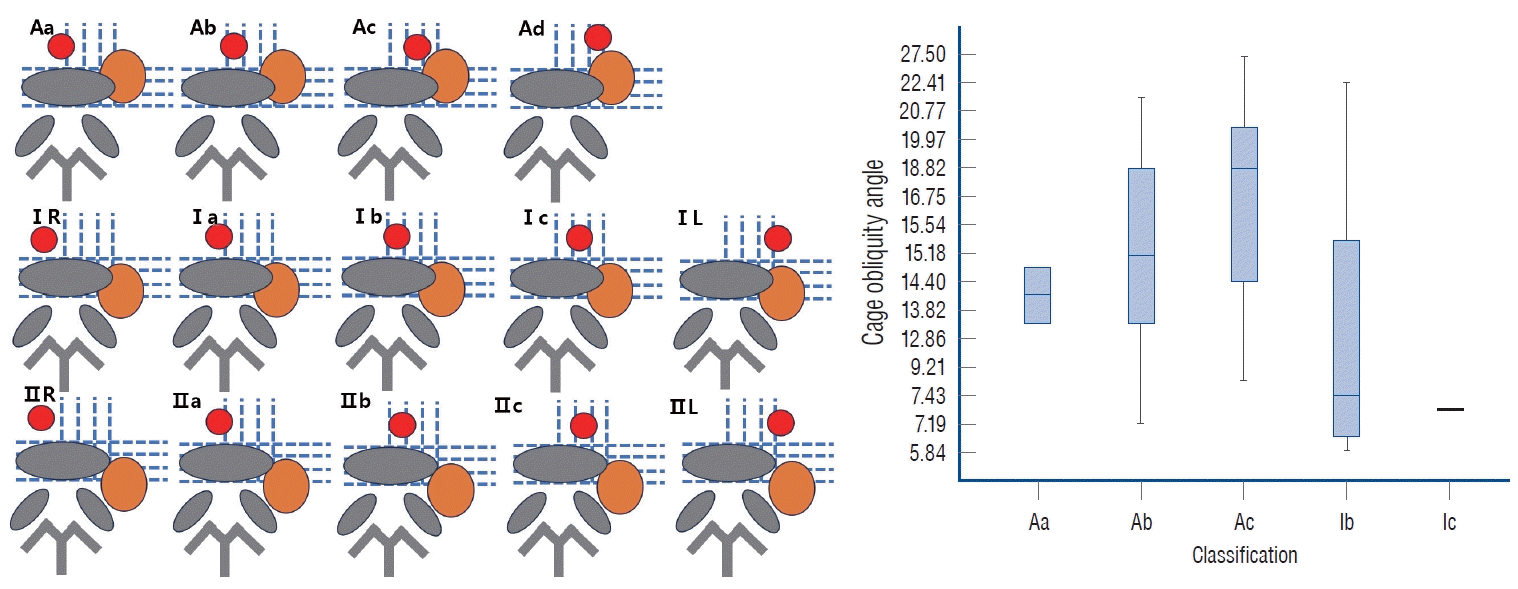
Fig. 2.
Statistical analysis
RESULTS
Table 1.
Values are presented as mean±standard deviation (range) or number unless otherwise indicated. OLIF : oblique lateral interbody fusion, DM : diabetes mellitus, BMI : body mass index, TPAI : the total psoas area index, DIAPM : the distance from the iliac artery to the origin of the psoas muscle, APCVD : the angle between the origin of the psoas muscle and the center of the vertebral disc, PI : pelvic incidence
Radiological measurements
Table 2.
Table 3.
Single and multiple regression analysis
Fig. 3.
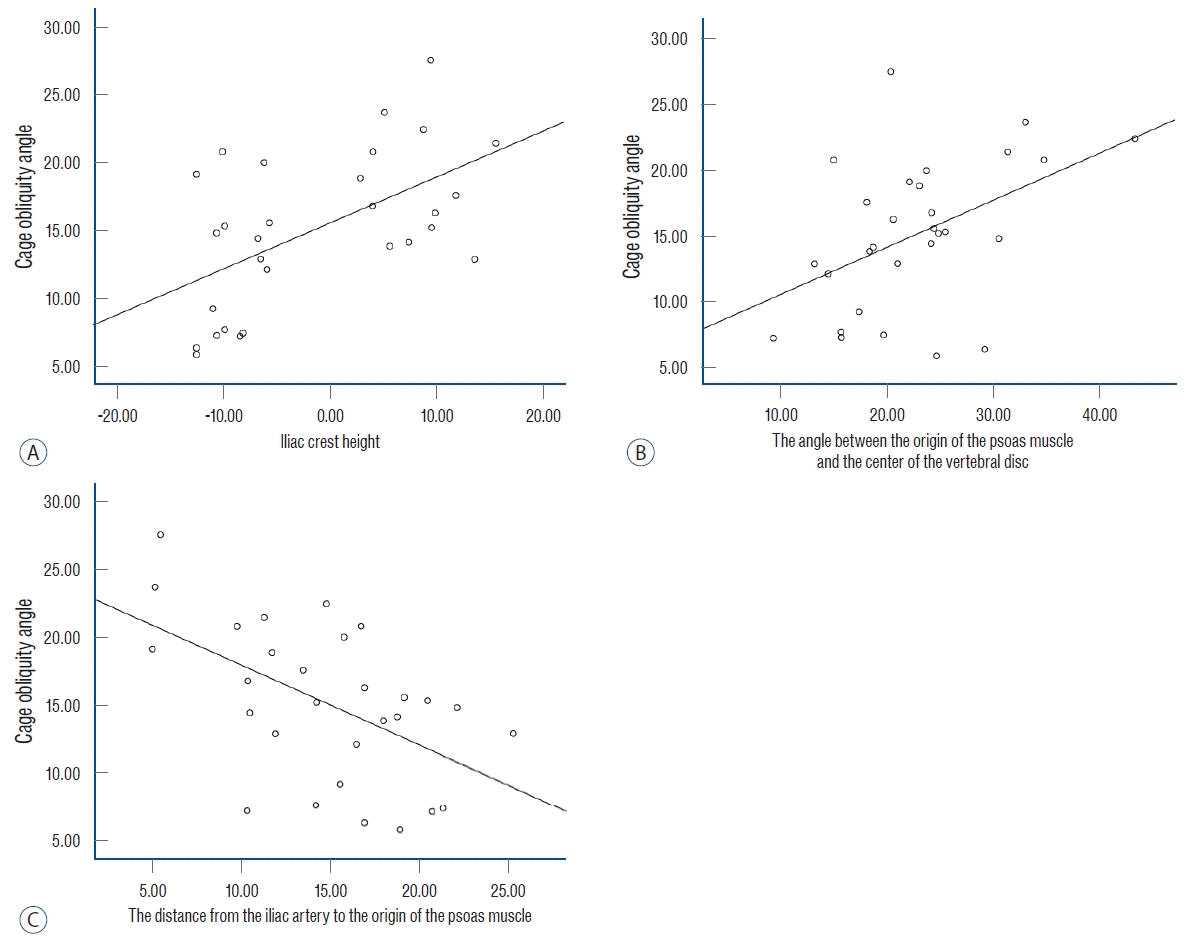
Fig. 4.
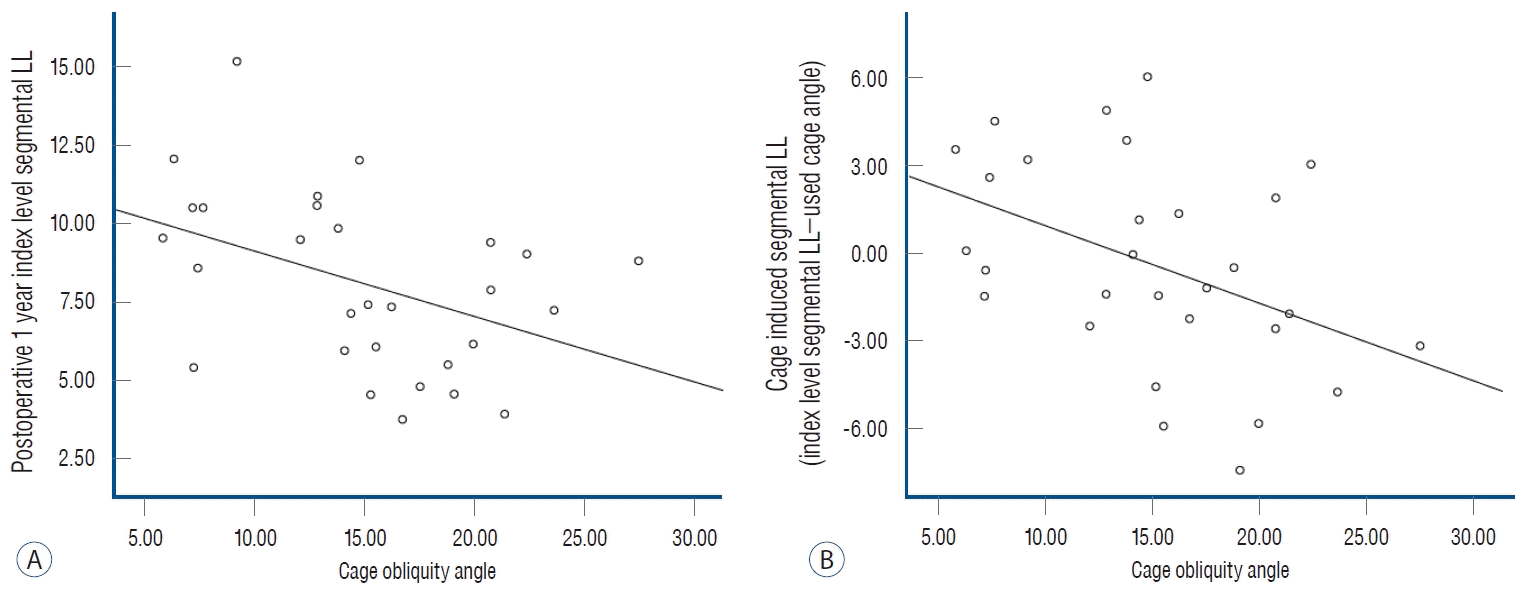
Table 4.
| R2 | p-value | |
|---|---|---|
| Age (years) | 0.001 | 0.84 |
| Height (cm) | 0.005 | 0.73 |
| Weight (kg) | 0.075 | 0.15 |
| BMI | 0.099 | 0.09 |
| DM | 0.043 | 0.28 |
| Smoking | 0.002 | 0.81 |
| Preoperative PI | 0.029 | 0.37 |
| Preoperative LL | 0.001 | 0.90 |
| Preoperative SVA | 0.066 | 0.21 |
| Preoperative FH | 0.084 | 0.15 |
| Preoperative index level SLA | 0.018 | 0.49 |
| Preoperative index level SCA | 0.033 | 0.10 |
| Index level left psoas muscle volume | 0.014 | 0.54 |
| TPAI | 0.046 | 0.27 |
| DIAPM | 0.28 | 0.003* |
| APCVD | 0.21 | 0.012* |
| Iliac crest height | 0.31 | 0.002* |
| Preoperative index level DAH | 0.021 | 0.46 |
| Index level flexibility (flexion-extension angle) | 0.02 | 0.52 |
| Cage location ratio | 0.02 | 0.52 |
| Postoperative 1 year index level SLA | 0.18 | 0.02* |
| Postoperative 1 year index level SCA | 0.095 | 0.35 |
| Cage induced segmental LL, postoperative index level SLA – used cage angle | 0.19 | 0.02* |
| Cage induced disc height, postoperative index level DAH – used cage height | 0.02 | 0.49 |
| Index level DAH changes | 0.00 | 0.94 |
| Index level FH changes | 0.03 | 0.38 |
| Fusion grade | 0.00 | 0.91 |
| Subsidence rate | 0.005 | 0.72 |
BMI : body mass index, DM : diabetes mellitus, PI : pelvic incidence, LL : lumbar lordosis, SVA : sagittal vertical axis, FH : foraminal height, SLA : segmental lumbar lordotic angle, SCA : segmental lumbar coronal Cobb angle, TPAI : total psoas muscle area index, DIAPM : the distance from the iliac artery to the origin of the psoas muscle, APCVD : the angle between the origin of the psoas muscle and the center of the vertebral disc, DAH : disc anterior height
Table 5.
Excluded variable statistics : age, height, weight, body mass index, L4-L5 level preoperative foraminal height, L4-L5 level segmental lumbar lordosis, L4-L5 level preoperative segmental coronal angle, L4-L5 level left psoas muscle volume, TPAI, L4-L5 level preoperative anterior disc height, L4-L5 level flexibility (flexion-extension angle), used cage angle, used cage height. Estimated regression expression statistics : cage obliquity angle = 13.062–0.318×DIAPM+0.325×APCVD+0.174×Iliac crest height (adjusted R2, 55.1%) (for example, if the DIAPM is 18.71 mm, the APCVD is 18.71°, and the iliac crest height is 7.49 mm, a cage obliquity angle of 14.50° can be expected). B : unstandardized coefficients, SE : standard error, TOL : tolerance, VIF : variance inflation factor, DIAPM : the distance from the iliac artery to the origin of the psoas muscle, APCVD : the angle between the origin of the psoas muscle and the center of the vertebral disc
Table 6.
Statistical comparison by artificially dividing participants into two groups
Fig. 5.
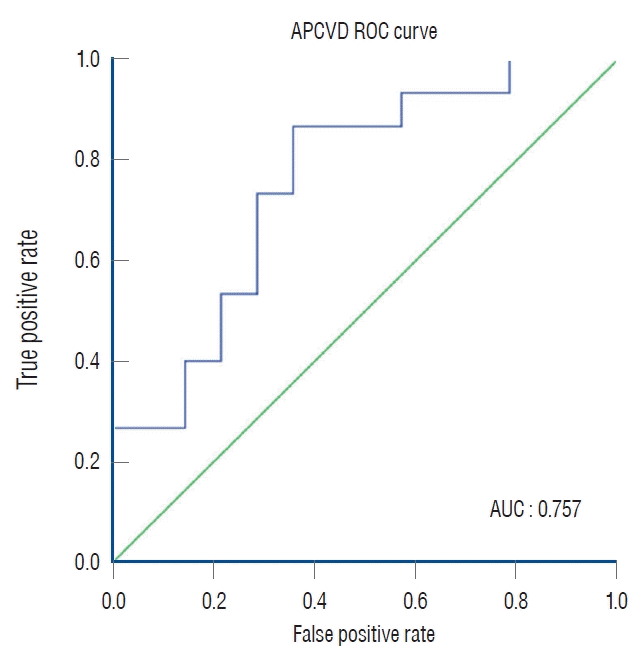
Table 7.
Values are presented as mean±standard deviation (range) or number (%). BMI : body mass index, DM : diabetes mellitus, PI : pelvic incidence, LL : lumbar lordosis, SVA : sagittal vertical axis, FH : foraminal height, SLA : segmental lumbar lordotic angle, SCA : segmental lumbar coronal Cobb angle, DAH : disc anterior height, TPAI : the total psoas area index, DIAPM : the distance from the iliac artery to the origin of the psoas muscle, APCVD : the angle between the origin of the psoas muscle and the center of the vertebral disc
Table 8.
Clinical outcomes
Intra-rater and inter-rater reliabilities
DISCUSSION
Fig. 6.


 PDF
PDF Citation
 Print
Print


 XML Download