INTRODUCTION
METHODS
Setting
Participants
Sample size
Ethics
Participant characteristics data
Division into groups with or without heart failure
Measurements
Accelerometer-measured physical activity
Statistical analysis
Participant characteristics data
Physical activity
RESULTS
Participant characteristics
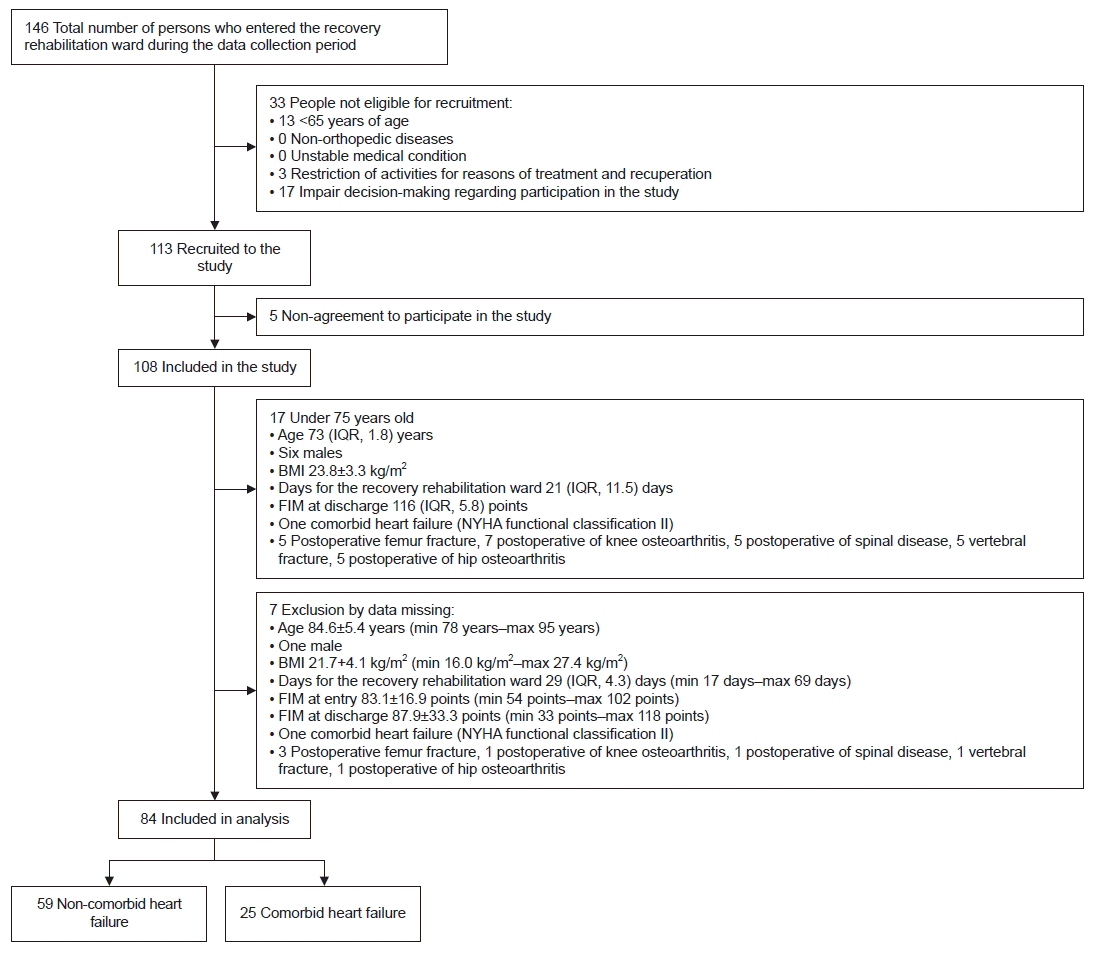
 | Fig. 1.This image presents a flowchart of study participant selection. IQR, interquartile range; BMI, body mass index; FIM, Functional Independent Measure; NYHA, New York Heart Association; min, minimum; max, maximum. |
Table 1.
|
All (n=84) |
With heart failure (n=25) |
Without heart failure (n=59) |
p-value a),b),c) | Effect sizea),b),c) | ||||||||
|---|---|---|---|---|---|---|---|---|---|---|---|---|
| Value | Min | Max | Value | Min | Max | Value | Min | Max | ||||
| Age (yr) | 85.0 (80.8–89.0) | 76 | 98 | 86.0 (80.0–91.0) | 76.0 | 95.0 | 85.0 (81.0–87.5) | 76 | 98 | 0.44a) | 0.08d) | |
| Body mass index (kg/m2) | 20.5 (18.3–24.0) | 14.2 | 30.5 | 20.2 (17.8–22.7) | 15.0 | 30.5 | 21.6 (19.0–24.4) | 14.2 | 30.1 | 0.47a) | 0.08d) | |
| Days from onset to admission to the rehabilitation ward day) | 13.0 (9.8–17.0) | 0 | 70 | 15.0 (9.0–26.0) | 7 | 48 | 13.0 (10.0–15.0) | 0 | 70 | 0.16a) | 0.23d) | |
| Days for the rehabilitation ward day) | 30.5 (20.0–50.3) | 10 | 88 | 34.0 (23.0–64.0) | 10 | 88 | 29.0 (20.0–44.5) | 12 | 79 | 0.29a) | 0.11d) | |
| FIM (point) | ||||||||||||
| At entry | 85.5 (72.0–96.0) | 33 | 119 | 76.0 (60.0–96.0) | 33 | 111 | 86.0 (76.0–96.0) | 51 | 119 | 0.08a) | 0.15d),f) | |
| At discharge | 108.0 (96.5–117.0) | 41 | 124 | 108.0 (86.0–113.0) | 41 | 122 | 109.0 (97.5–117.0) | 78 | 124 | 0.28a) | 0.19d),f) | |
| Sex | 0.28b) | 0.14e) | ||||||||||
| Male | 21 (25.0) | 4 (16.0) | 17 (28.8) | |||||||||
| Female | 63 (75.0) | 21 (84.0) | 42 (71.2) | |||||||||
| Postoperative femur fracture | 0.10b) | 0.19e) | ||||||||||
| Postoperative femur fracture | 38 (45.2) | 15 (60.0) | 23 (39.0) | |||||||||
| Other than postoperative femur fracture | 46 (54.8) | 10 (40.0) | 36 (61.0) | |||||||||
| Postoperative knee joint replacement | 22 | 2 | 20 | |||||||||
| Conservative treatment for osteoporotic compression fracture | 9 | 3 | 6 | |||||||||
| Postoperative osteoporotic compression fracture | 7 | 2 | 5 | |||||||||
| Postoperative spinal canal stenosis | 5 | 3 | 2 | |||||||||
| Postoperative hip joint replacement | 3 | 0 | 3 | |||||||||
| Diabetes mellitus | 27 (32.1) | 10 (40.0) | 17 (28.8) | 0.32b) | 0.11e) | |||||||
| History of cerebrovascular disease | 12 (14.3) | 4 (16.0) | 8 (13.6) | 0.77c) | 0.04e) | |||||||
| Preadmission indoor mobilityーunassisted | 74 (88.1) | 20 (80.0) | 54 (91.5) | 0.14b) | 0.16e) | |||||||
| Indoor mobility at dischargeーambulation | 78 (92.9) | 21 (84.0) | 56 (94.9) | 0.11c) | 0.18e) | |||||||
Table 2.
Multiple liner regression forced-entry method was used for analysis; outcomes were physical activities; factors were sex, age, FIM at discharge, days for recovery ward, chronic heart failure, postoperative femur fractures, diabetes mellitus, and cerebrovascular disease.
LIPA, light-intensity physical activity; MVPA, moderate to vigorous physical activity; FIM, Functional Independent Measure.
*p<0.05.
Table 3.
| Value | Minimum | Maximum | p-valuea) | Effect sizeb) | |
|---|---|---|---|---|---|
| NYHA functional classification | |||||
| Ⅰ | 0 (0) | ||||
| Ⅱ | 20 (80.0) | ||||
| Ⅲ | 5 (20.0) | ||||
| Ⅳ | 0 (0) | ||||
| Parameters of cardiac function | |||||
| BNP (pg/mL) | 0.11 | 0.27 | |||
| At admission | 124.5 (72.6–221.8) | 10.0 | 800.0 | ||
| At discharge | 76.4 (42.7–182.5) | 11.6 | 555.0 | ||
| LVEF (%) | 67.0 (60.0–72.0) | 36.0 | 81.0 | ||
| Average E/e' | 13.6 (10.4–16.6) | 7.1 | 28.4 | ||
| E/A | 0.7 (0.6–0.9) | 0.5 | 3.4 | ||
| Septal e’ velocity (cm/s) | 5.0 (4.5–7.0) | 3.0 | 8.0 | ||
| TR velocity (m/s) | 2.3 (1.9–2.5) | 1.6 | 3.4 |
Values are presented as number (%) or median (interquartile range [25th percentile–75th percentile]).
NYHA, New York Heart Association; BNP, brain natriuretic peptide; LVEF, left ventricular ejection fraction; Average E/e', average E velocity divided by average mitral annular e' velocity; E/A, E velocity divided by A-wave velocity; TR, tricuspid regurgitation.
Physical activities
Table 4.
|
All (n=84) |
With heart failure (n=25) |
Without heart failure (n=59) |
p-valuea) | Effect size | p-value of ANCOVAb) | |||||||
|---|---|---|---|---|---|---|---|---|---|---|---|---|
| Median (IQR) | Min | Max | Median (IQR) | Min | Max | Median (IQR) | Min | Max | ||||
| Single continuous period (s) | ||||||||||||
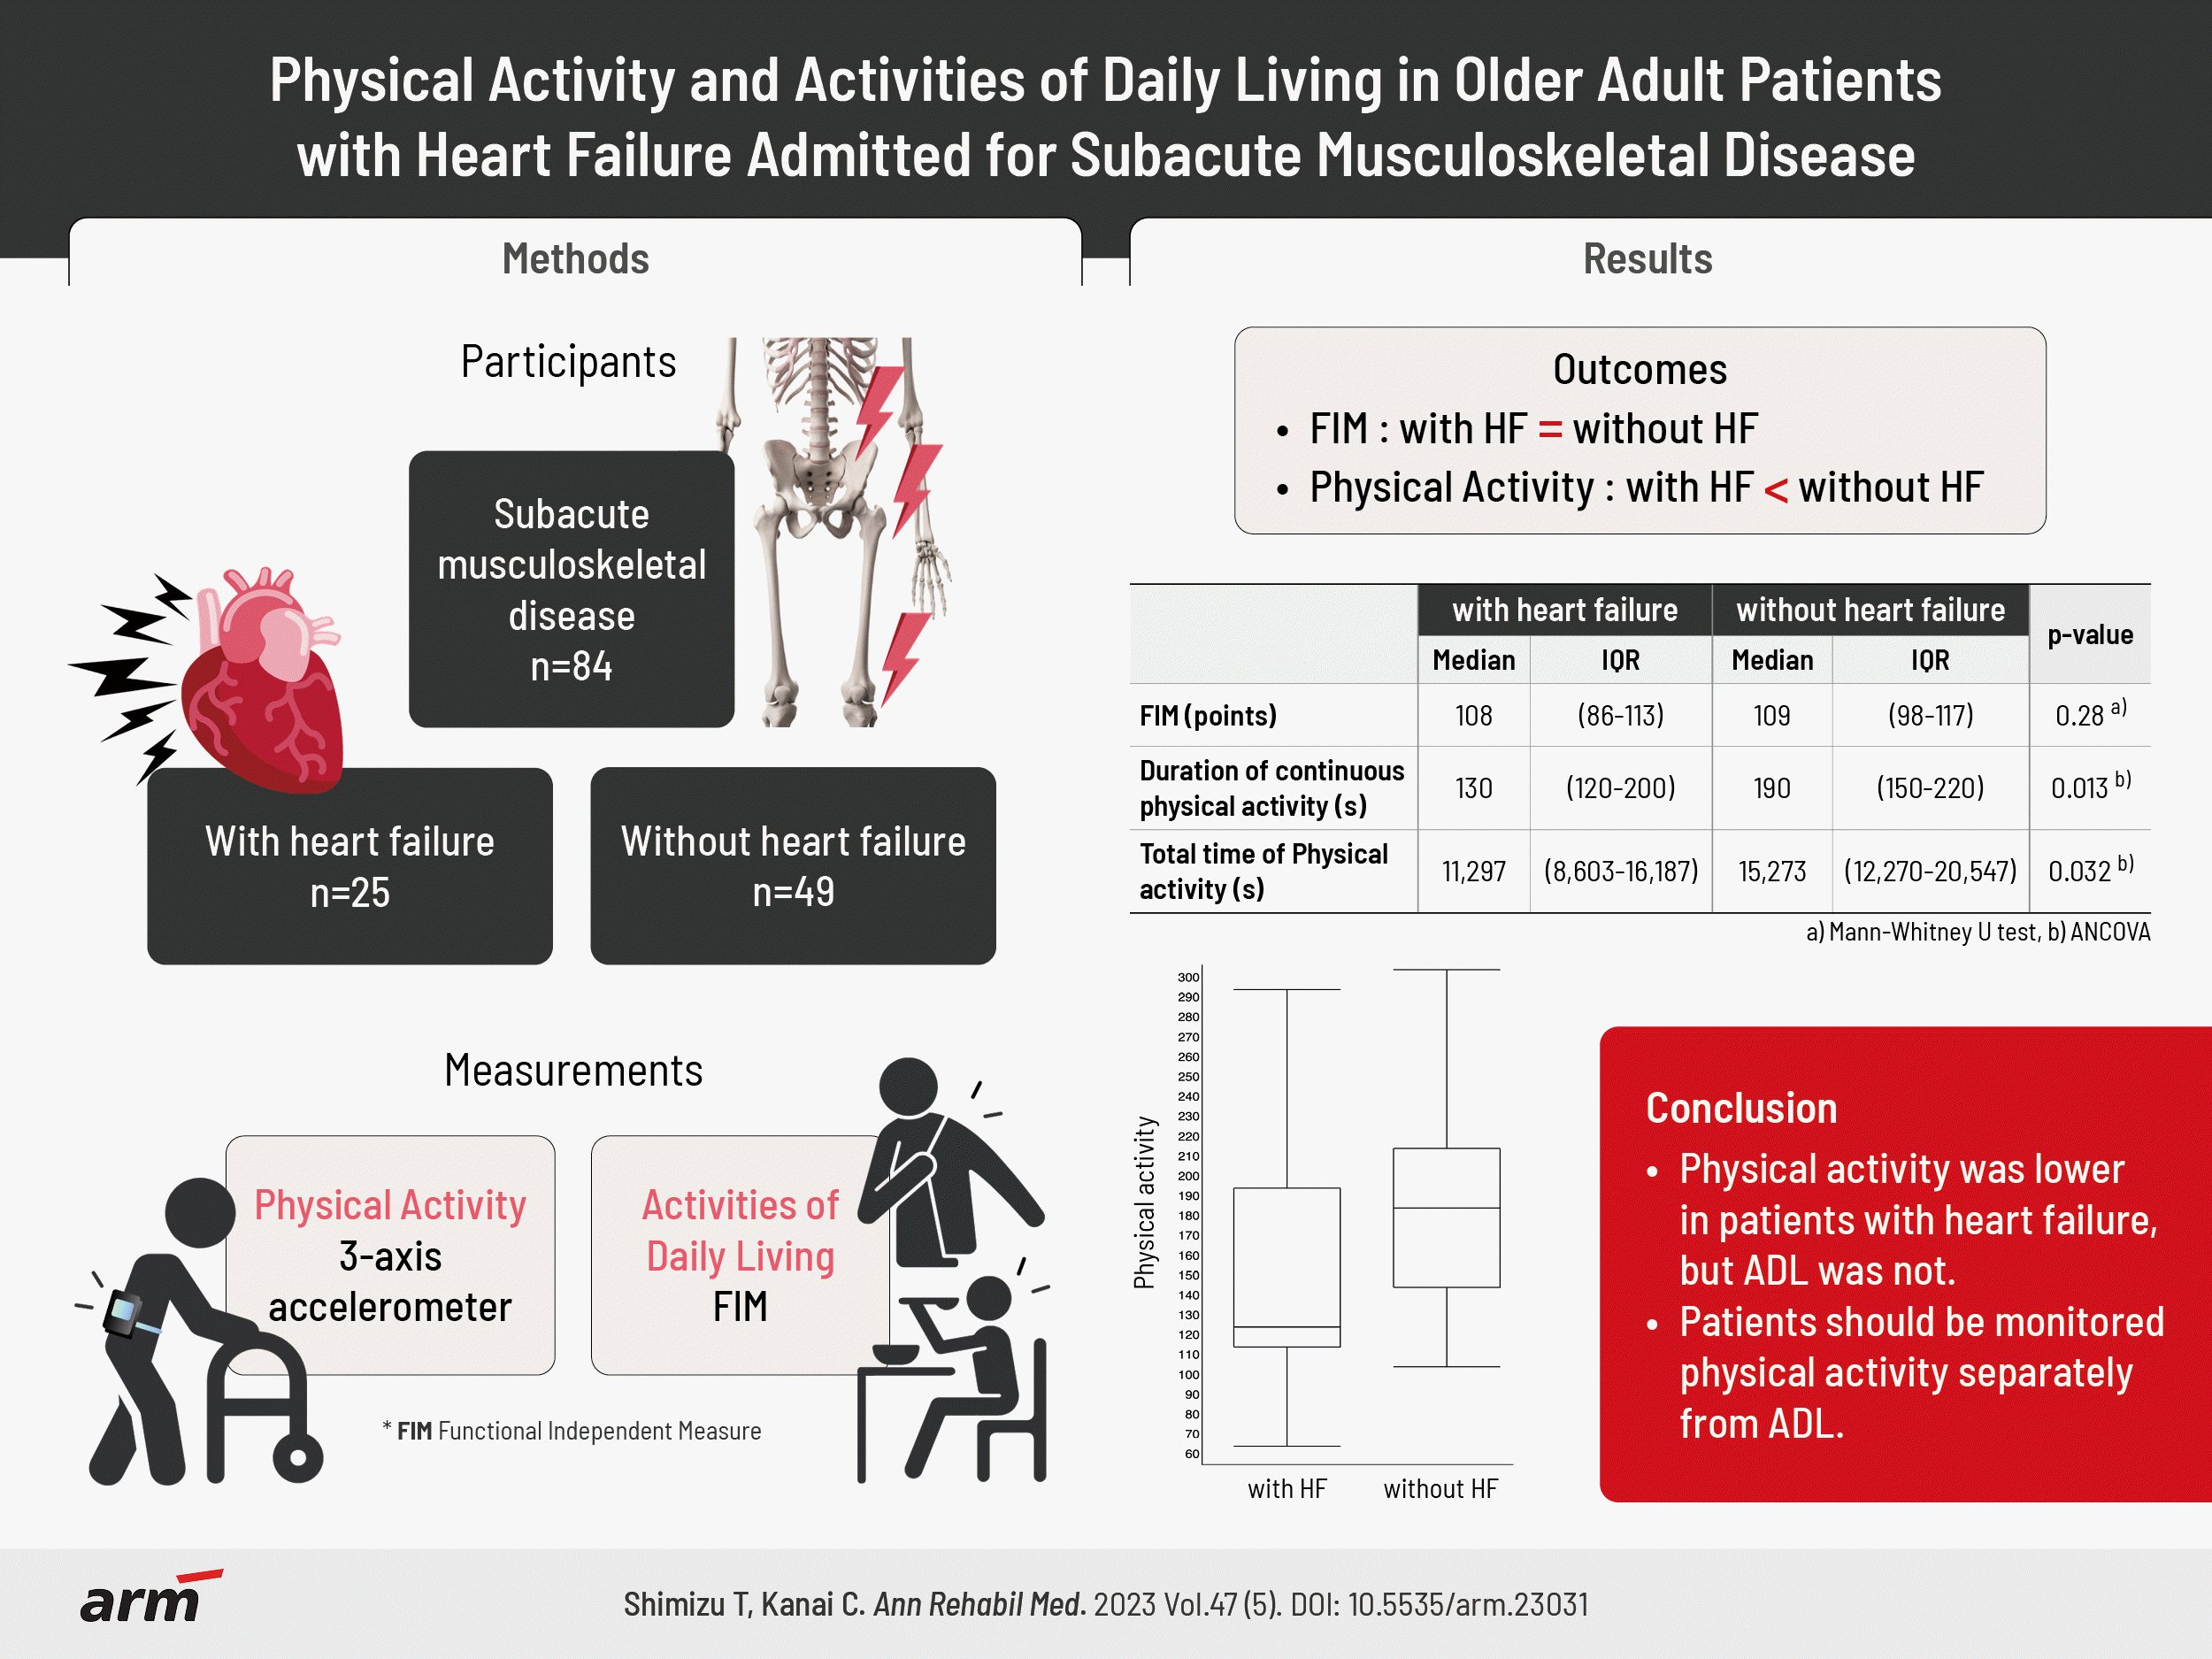
| ≥Light-intensity physical activity | 180.0 (130.0–220.0) | 110.0 | 300.0 | 130.0 (120.0–200.0) | 70 | 300 | 190.0 (150.0–220.0) | 110 | 310 | 0.004* | 0.32 | 0.013* |
| Moderate to vigorous physical activity | 15.0 (10.0–20.0) | 10.0 | 20.0 | 10.0 (10.0–20.0) | 10 | 50 | 20.0 (10.0–20.0) | 10 | 21 | 0.019* | 0.26 | 0.44 |
| Total time (s) | ||||||||||||
| ≥Light-intensity physical activity | 14,913.4 (10,569.2–19,502.5) | 7,428.0 | 25,950.9 | 11,296.6 (8,603.3–16,186.7) | 4,485.0 | 26,086.6 | 15,273.3 (12,270.0–20,546.7) | 7,050.0 | 33,433.4 | 0.005* | 0.32 | 0.032* |
| Moderate to vigorous physical activity | 633.4 (354.6–927.5) | 201.2 | 1,560.5 | 383.3 (296.7–613.3) | 150.0 | 2613.3 | 730.0 (538.4–1,071.7) | 143.3 | 1,873.3 | <0.001* | 0.39 | 0.05 |


 PDF
PDF Citation
 Print
Print


 XML Download