Journal List > Endocrinol Metab > v.38(5) > 1516084349

Koo, Lee, Moon, Kwon, Lee, Park, Park, Lee, Oh, Cho, Jeong, and Rhee: Coronary Artery Calcium Score as a Sensitive Indicator of Cardiovascular Disease in Patients with Type 2 Diabetes Mellitus: A Long-Term Cohort Study

Abstract

Background

Coronary artery calcium score (CACS) has become an important tool for evaluating cardiovascular disease (CVD). This study evaluated the significance of CACS for future CVD through more than 10 years of follow-up in asymptomatic Korean populations with type 2 diabetes mellitus (T2DM) known to have a relatively low CACS burden.

Methods

We enrolled 981 asymptomatic T2DM patients without CVD at baseline who underwent CACS evaluation using multidetector computed tomography between January 2008 and December 2014. They were grouped into five predefined CACS categories based on Agatston scores and followed up by August 2020. The primary endpoint was incident CVD events, including coronary, cerebrovascular, and peripheral arterial disease.

Results

The relative risk of CVD was significantly higher in patients with CACS ≥10, and the significance persisted after adjustment for known confounders. A higher CACS category indicated a higher incidence of future CVD: hazard ratio (95% confidence interval) 4.09 (1.79 to 9.36), 12.00 (5.61 to 25.69), and 38.79 (16.43 to 91.59) for 10≤ CACS <100, 100≤ CACS <400, and CACS ≥400, respectively. During the 12-year follow-up period, the difference in event-free survival more than doubled as the category increased. Patients with CACS below 10 had very low CVD incidence throughout the follow-up. The receiver operating characteristic analysis showed better area under curve when the CACS cutoff was 10 than 100.

Conclusion

CACS can be a sensitive marker of CVD risk. Specifically, CACS above 10 is an indicator of CVD high-risk requiring more intensive medical treatment in Koreans with T2DM.

GRAPHICAL ABSTRACT

INTRODUCTION

Patients with diabetes have at least twice the coronary heart disease (CHD)-related mortality risk compared with individuals without diabetes [1] as well as a similar risk of new-onset myocardial infarction (MI) as of non-diabetic individuals with a prior MI [1,2]. Despite the absence of comorbidities, such as hypertension, or symptoms related to cardiovascular disease (CVD) [3,4], assessment of CVD risk is very important in patients with diabetes to enable early diagnosis or preventive management to decrease the risk [5].
The coronary artery calcium score (CACS) is an independent risk factor for all-cause mortality in subjects with or without diabetes [6,7], albeit with a higher burden in patients with diabetes [7-9]. And the CACS constitutes an additional cardiovascular (CV) risk assessment tool for patients with diabetes, and the diagnostic value has been emphasized, especially in asymptomatic patients [10]. The prognostic value of coronary artery calcium (CAC) for CV events in asymptomatic patients, regardless of race, is-well known [11-15]. Furthermore, a prospective study showed an approximately 30% increase in the CHD risk for each doubling of CACS in patients with type 2 diabetes mellitus (T2DM) [9]. A meta-analysis including eight studies with mean follow-up of 5.18 years revealed the association of CACS ≥10 with CHD risk in patients with T2DM [16]. A 15-year long-term follow-up study showed that patients with diabetes have a higher CACS burden (≥100) than non-diabetic individuals, whereas CACS=0 indicated a good 5-year prognosis for mortality that was similar to that of non-diabetic patients [8]. In an additional 15-year follow-up study based on the Multi-Ethnic Study of Atherosclerosis (MESA) data, the CVD risk including heart failure according to the increase in the CAC category in non-diabetic patients is similar to the risk of CVD in diabetic patients with CAC of one category lower [15]. However, in this study, the CAC category was broadly divided into 0, 1–100, or 100+ based on American College of Cardiology (ACC)/American Heart Association (AHA) guideline [17], which the authors also suggest as a limitation. And they did not suggest a specific CACS cutoff for stratification of high-risk CVD groups in asymptomatic diabetic patients. The current ACC/AHA guideline strongly recommended to start on statins if CACS is ≥100 in non-diabetic patients with an “intermediate risk” of 10-year atherosclerotic cardiovascular disease (ASCVD) [17]. However, regardless of diabetes, only CACS of ≥100 correlated well with the 10-year ASCVD risk category for primary prevention, helping to improve CVD risk prediction [18].
In this long-term (12 years) cohort study, we evaluated the relative risk for CVD according to the baseline CACS burden. The primary endpoint was incident CVD, defined as coronary artery, cerebrovascular, and peripheral artery disease [3,4]. The too broad CACS category mentioned as a limitation of previous MESA analysis was further subdivided by referring to previous imaging studies [19]. Based on this, a specific CACS cutoff was proposed to stratify CVD risk in Korean patients with T2DM.

METHODS

Study population and design

This long-term retrospective study was conducted from January 2008 to August 2020, and included 1,058 asymptomatic patients with T2DM who underwent CACS evaluations at the Department of Endocrinology and Metabolism, Kangbuk Samsung Hospital between January 2008 and December 2014. The CAC was examined using a multidetector computed tomography, which scans in conjunction with an electrocardiogram (Brilliance 64 slice and CT 6000 iCT scanners, Philips, Amsterdam, Netherlands). The CACS was evaluated by the Agatston score [20], which was obtained by multiplying the indexed maximal computer tomographic number according to a specific category with a computed tomography density ≥130 Hounsfield units for the lesion by the lesion area, and then summing the values for all lesions [21]. At the baseline evaluation, no assessment of the degree of coronary artery stenosis, besides the CACS score, was performed.
The term CVD encompasses coronary artery disease (CAD; also known as CHD), cerebrovascular disease, and peripheral artery disease [3,4]: fatal/non-fatal MI, stable/unstable angina, atherosclerotic coronary disease, ischemic heart disease, stroke (cerebral infarction), transient ischemic attack, carotid artery stenosis, and peripheral artery disease. In addition, CVD diagnosis was included only when the official diagnosis name (or code) and date of diagnosis were confirmed simultaneously on the chart or computerized data. After excluding 69 patients with underlying CVD or eight patients with data missing for the analysis variables, 981 participants (male, 57.4%) were enrolled and classified into five risk stratification categories based on the CACS [19] as follows: absent (CACS=0, n=543), minimal (1≤ CACS <10, n=88), mild (10≤ CACS <100, n=172), moderate (100≤ CACS <400, n=133), and extensive (CACS ≥400, n=45) (Supplemental Fig. S1). This study was approved by the Institutional Review Board of Kangbuk Samsung Hospital (KBSMC 202211049-HE001, Seoul, Korea), which waived the requirement for informed consent because of the analysis of deidentified data in this retrospective cohort study.

Acquisition of medical information and anthropometrics

The diagnosis of incident CVD was confirmed using computerized patient disease codes and official records that were obtained from the physicians’ notations in medical charts. Information on medical history, alcohol consumption, smoking status, and physical activity was obtained from official medical charts and interview records of the patient’s visits to the study center and meticulously verified. Alcohol intake was determined based on the average number of weekly standard drinks in accordance with the World Health Organization guidelines, and active alcohol consumption was defined, regardless of sex, as consuming >14 standard drinks (140 g pure ethanol) per week [22]. Current smoking status was determined based on yes or no responses to questions. Regular exercise was defined as moderate- or high-intensity exercise lasting more than 1 hour, at least three times a week. The blood pressure was measured using a standard sphygmomanometer with the patient in the sitting position with a stable status after sufficient rest. All biochemical tests were performed in laboratories with standardized equipment, and anthropometric measurements were performed by well-trained staff. Total cholesterol, high-density lipoprotein cholesterol, and low-density lipoprotein cholesterol (LDL-C) levels were measured by using enzymatic colorimetric method, selective inhibition method, and homogeneous enzymatic colorimetric test, respectively. Urinary albumin-to-creatinine ratio (UACR) was determined by measuring spot urine albumin base on radioimmunological competition assay (Immunotech, Prague, Czech Republic) method and spot urine creatinine concentration by using a modified Jaffe method. Blood glucose levels were assessed by the hexokinase method (Modular D2400, Hitachi, Tokyo, Japan). Glycated hemoglobin (HbA1c) levels were measured by the immunoturbidimetric assay method (Cobra Integra 800 automatic analyzer, Roche Diagnostics, Basel, Switzerland).

Statistical analysis

To determine the hazard ratio (HR) with 95% confidence interval (CI) for CV events, a Cox proportional hazard model with five baseline CACS category groups was used. The main reference group is patients with a CACS of <10, and additionally, in the supplementary analysis, patients with zero CACS were applied as a reference group. And known confounding factors for the risk of MI or CVD [23] were adjusted in various models: model 1, adjusted for age and sex; model 2 additionally adjusted for body mass index (BMI), HbA1c, hypertension, LDL-C, and creatinine; model 3, additionally adjusted for smoking status, alcohol consumption, regular exercise, diabetes mellitus (DM) medications, and anti-dyslipidemia medications; model 4, additionally adjusted for DM duration. Kaplan-Meier estimation was used to determine the probability of CV events over time, whereby the interval survival rates at each timepoint in the follow-up period as well as the cumulative survival rate were calculated. Restricted spline curve analysis was used to estimate the baseline log-cumulative hazards, and local regression smoothing in a generalized additive model was used to obtain curves of pointwise estimation and CI.
The participants were divided into subgroups stratified by CVD-associated confounding factors, including age (years; 20≤ age <59 and 59≤ age), sex, BMI (kg/m2; <25 and ≥25), exercise status (times/week; <3 and ≥3), smoking status (current smoker, nonsmoker), hypertension (yes, no), and diabetes duration (years; <10 and ≥10). The adjusted model 4 was used for the abovementioned subgroup analyses.
Continuous data were expressed as the mean±standard deviation and compared using a t test for two independent samples, as appropriate. In case of skewed distribution, the median (interquartile range) was used in the Mann-Whitney U test. Oneway analysis of variance (ANOVA) was used for evaluating more than two continuous independent variables, and the Kruskal-Wallis test was applied for non-normally distributed variables. All two-tailed values with P<0.05 were considered statistically significant. All statistical analyses were performed using STATA version 16.1 (StataCorp., College Station, TX, USA).

RESULTS

Of the 981 participants, 438 (44.7%) had positive CAC at the baseline (Table 1) who were relatively older and had a longer duration of diabetes, higher rates of hypertension, and significantly higher levels of UACR than participants without CAC. During the follow-up period (median, 10.1 years), 71 patients were diagnosed with CVD: only CAD=55, only cerebrovascular disease=14, CAD and cerebrovascular disease combined=1, and peripheral artery disease=1.
Patients with CVD were older, and had longer duration of diabetes, higher prevalence of hypertension, and higher creatinine and UACR levels than in participants without CVD, albeit without statistical significance. No intergroup difference in the ratio of anti-dyslipidemia drug administration was noted. Interestingly, the proportion of patients taking thiazolidinediones was more than twice as high in the non-CVD group as in the CVD group, but the proportion of patients receiving insulin therapy reversed. (Supplemental Table S1).
The crude simple incidence rate confirmed that a higher CACS category at baseline indicated an exponentially higher incidence of CV events (Supplemental Table S2). A higher CACS category correlated with a higher relative risk of CVD as compared to the reference group (patients without CAC). The minimal group (CACS 1–9) tended to have a higher CVD risk than the group with zero CAC, but these results were not statistically significant especially after further adjustment of confounding factors. And there was little difference in CVD incidence between the minimal and negative groups in Kaplan-Meier event-free survival analysis of 12-year follow-up (Supplemental Fig. S2).
Therefore, the analysis was performed based on four CACS categories with groups with CACS less than 10 as reference. In the Cox proportional hazard analysis, patients with a CACS burden of 10 or higher had an average relative risk of CVD eight times higher (HR, 8.41; 95% CI, 4.30 to 16.46, model 4) than those who did not (Table 2). According to CACS categories, in the mild group (CACS 10–99), the relative risk for CVD was significantly higher than the reference group (CACS <10) (HR, 4.29; 95% CI, 1.95 to 9.39, model 1) with minimal difference even after additional adjustments for confounding factors (HR, 4.09; 95% CI, 1.79 to 9.36, model 4). When the CACS category rises by one level, the relative risk for CVD tends to increase by three times: moderate category (HR, 12.00; 95% CI, 5.61 to 25.69) and extensive category (HR, 38.79; 95% CI, 16.43 to 91.59) in model 4.
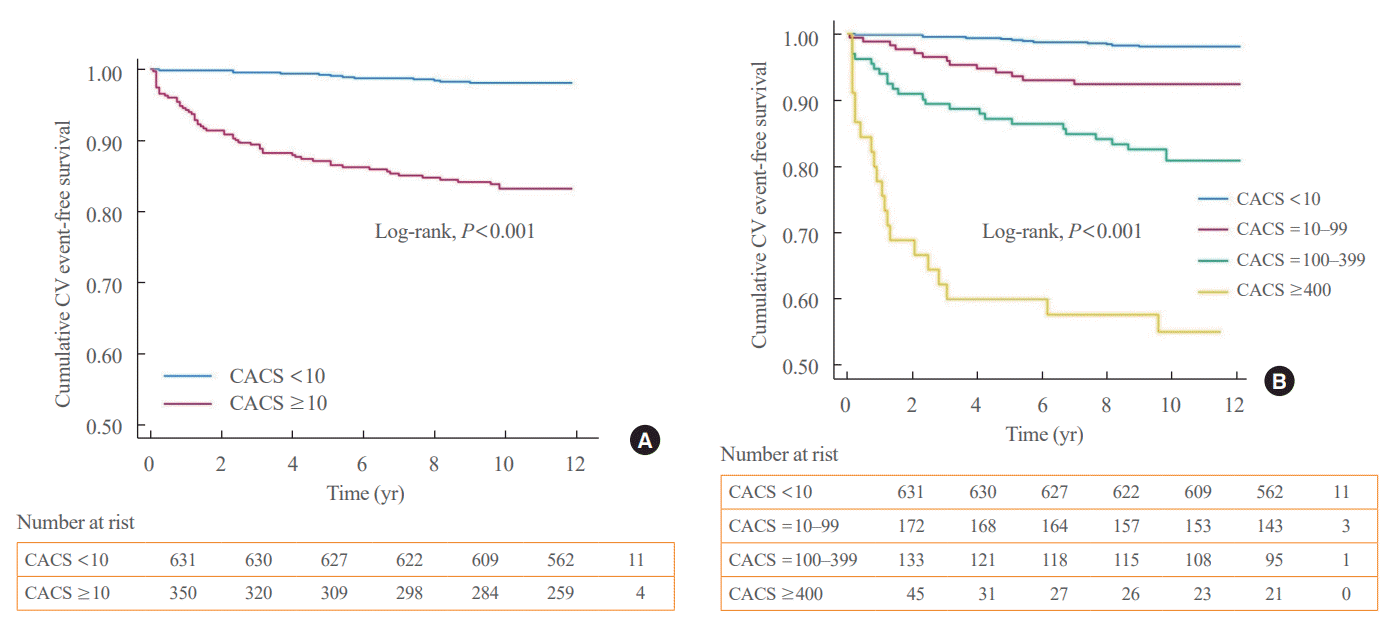
Kaplan-Meier event-free survival analysis (Fig. 1) confirmed that the groups with CACS above 10 at the baseline consistently maintained a higher incidence than the groups with CACS below 10. Whereas patients with CACS below 10 had very low cumulative incidence of CVD for at least 10 years continuously (Fig. 1A). As the CACS category group increased, the difference in the ultimate cumulative incidence more than doubled. The slope of the cumulative incidence of CVD in patients with CACS ≥10 was steep within the first 3 to 6 years of follow-up (Fig. 1B).
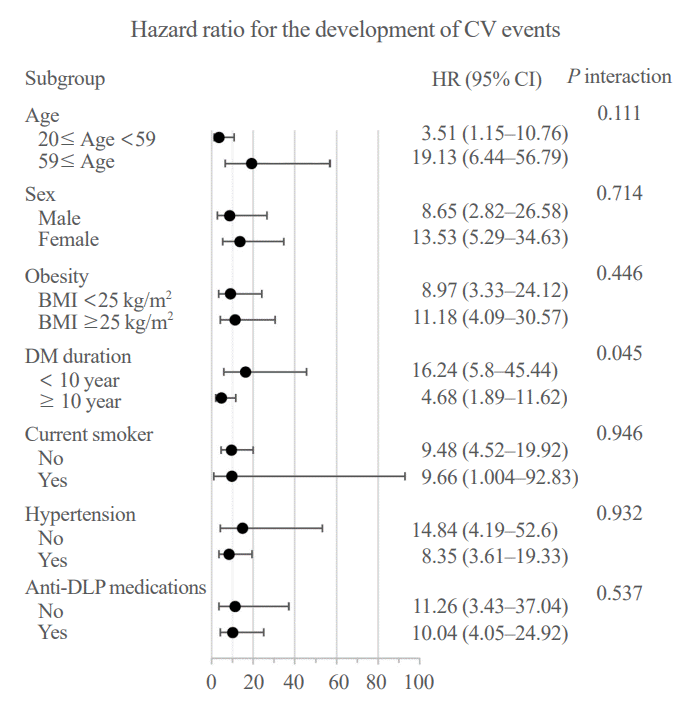
In a predefined subgroup analysis (Fig. 2), patients with CACS ≥10, in all subgroups, had a higher risk for CV events than patients with CACS <10 at the baseline. There was no statistical significance between groups within all subgroups except DM duration. The relative power of CACS as a predictor was stronger in patients with diabetes for less than 10 years than in those with diabetes for more than 10 years. However, it showed a tendency to have relatively higher HR for CVD in relatively older patients (≥59 years) than in younger patients, in females than in males, in obese than in normal-weight patients, and in patients without hypertension than those with hypertension.
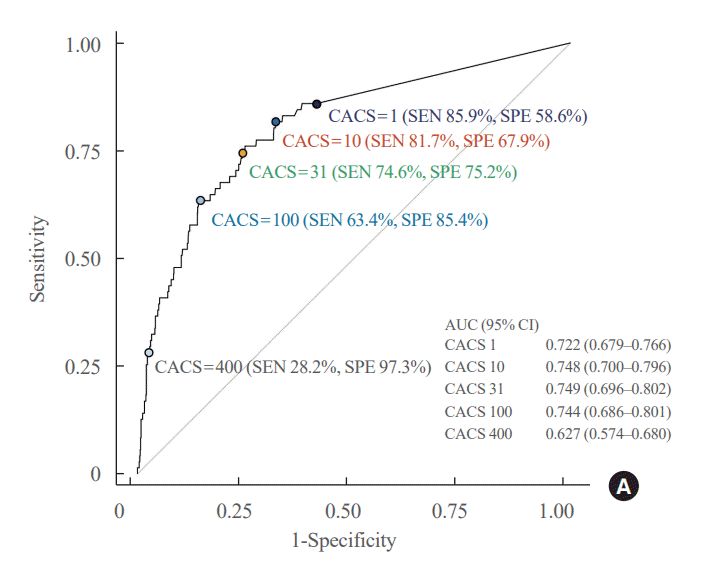
In the receiver operating characteristic (ROC) curve analysis, the optimal CACS cutoff value (31: sensitivity, 74.6%; specificity, 75.2%) is included in the mild category, which is closer to 10, and setting the cutoff to 10 (sensitivity, 81.7% [95% CI, 70.7% to 89.9%]; specificity, 67.9% [95% CI, 64.8% to 70.9%]) shows a better area under the receiver operating characteristic curve (AUC) value than 100 (sensitivity, 63.4% [95% CI, 51.1% to 74.5%]; specificity, 85.4% [95% CI, 82.9% to 87.6%]): AUC, 0.748 (95% CI, 0.700 to 0.796) vs. 0.744 (95% CI, 0.686 to 0.801) (Fig. 3, Supplemental Table S3).

DISCUSSION

In this study, we analyzed the CVD risk by subdividing the CACS categories more specifically. It was confirmed that a CACS score of 10 or higher was associated with an increased future CVD risk in asymptomatic Koreans with T2DM. These results are aligned with the main findings of previous studies and strengthen the evidence for CACS as a useful CV risk assessment tool in asymptomatic patients [7-17] based on long-term follow-up (>10 years). This study also confirmed a good long-term prognosis for CVD risk in patients with CACS below 10 even in diabetic conditions.
The current ACC/AHA guidelines suggest CACS=100 as a cutoff for statin use when it is “intermediate risk” based on the 10-year ASCVD risk in non-diabetic patients [17]. The most recently published MESA study did not suggest a specific cutoff value for diabetic patients at high-risk of CVD. Instead, in the case of diabetic patients, the CACS criteria corresponding to a similar CVD risk was suggested to be one level lower than that of non-diabetic patients [15]. However, the CACS category range is too broad and rough.
A previous meta-study (mean follow-up of 5 years) suggested a CACS value of 10 for the prediction of CVD risk in T2DM patients, the same as our study [16]. The findings of our study are of clinical significance that, unlike non-diabetic patients, lower CACS cutoff values (10) for CVD risk prediction and statin use should be applied even in East Asian (Korean) diabetes patients with relatively lower CACS burden through a longer follow-up period. We further increased the statistical significance by adjustments of drugs that may affect the outcomes as well as the duration of diabetes [23].
Confirmation of the presence of CAC has diagnostic value as an additional risk assessment tool in the 10-year ASCVD risk formula, which is applied as a criterion for statin use in the current ACC/AHA guidelines [17]. In a large-scale cohort study, CACS severity increased the predictive value of all-cause mortality in addition to the conventional 10-year ASCVD risk formula [24]. Furthermore, as the 10-year ASCVD risk category increased, the proportion of patients with zero CACS in that category decreased, whereas the proportion of patients with CACS of >100 increased. However, the proportion of patients with CACS between 1 and 100 was unassociated with the 10-year ASCVD risk category [18]. The incidence of CHD and ASCVD ascertained by the 10-year ASCVD risk category differed according to the degree of the CACS burden in that category; moreover, a higher CACS burden correlated with higher incidences of CHD and ASCVD [18]; especially, patients with CACS >100 showed the highest incidence rate within each 10-year ASCVD risk category [18]. In terms of cost effectiveness, the additional application of CAC assessment was not disadvantageous for the evaluation of CV risk in asymptomatic patients [25].
The prevalence of positive CACS and a higher CACS burden (≥100) in our cohort based on an East Asian (Korean) population was lower compared to other studies conducted mainly based on Western populations [26,27]. In diabetic patients, the prevalence of positive CACS and above 100 CACS was more than twice as high as non-diabetic patients, with more than 60% and about 40% respectively [7,8]. Especially, among T2DM patients, the prevalence of CACS above 10 was at least 70% (vs. 35.7% in our cohort), and the prevalence of CACS above 100 had exceeded 50% (vs. 18.1% in our cohort) [9].
Nevertheless, it is noteworthy that a statistically significant increase in the risk of CVD was shown from CACS of 10 indicating the need for more strong medical interventions to reduce CV risk as well as more aggressive evaluations for early diagnosis of imminent fatal CV events. These findings implied that in patients with T2DM, a lower CACS cutoff (10) should be applied for enabling high-intensity statins, regardless of the 10-year ASCVD risk, age, or race, instead of the cutoff 100 for primary prevention in the general population that is based on the 10-year ASCVD risk [17]. In our ROC curve analysis, setting a CACS cutoff of 10 for stratification of elevated CVD risk among predefined CACS categories shows a slightly better AUC than 100. Although this setting has a slightly lower specificity, it can be a better clinical choice considering the sensitivity aspect. In a previous meta-analysis study (mean follow-up 5.18 years), CACS of 10 in T2DM patients was used as a prognostic indicator with high sensitivity (94%; 95% CI, 89% to 96%) and low specificity (34%; 95% CI, 24% to 44%) for mortality and CV events, and even under high-risk conditions, good prognosis for CVD was shown in patients with CACS less than 10 [16]. On the other hand, in our study, the sensitivity was slightly lower at 81.7%, but the specificity was twice as high at 67.9%. We also found that even in patients with T2DM, long-term prognosis for CVD was very good when the CACS burden was less than minimal (<10). Especially, our study strengthened the clinical significance based on long-term follow-up (median, 10.1 years) and sophisticated adjustments for various confounding factors.
It is necessary to look closely at the results presented in our study. In the “minimal” category (0< CACS <10), the relative risk for CVD was higher than that of the reference group with zero CACS, but without statistical significance. However, a statistically significant increase in CVD risk was observed in all models when the CACS was ≥10. Even after adjustment for confounding factors, the significance was maintained and there was a slight decrease in HR; however, no significant changes. And in Kaplan-Meier analysis, there was no significant difference between the absent group and the minimal group for more than 10 years of follow-up. A significant difference in cumulative CVD incidence was found only in patients with CACS ≥ 10. CVD incidence increased steeply during the first 3 to 6 years of follow-up, and higher CACS burdens correlated with shorter time to the first CVD event. These results strongly suggest that early medical intervention is required before the CAC burden increases. The duration of diabetes did not significantly affect the results (model 4). Lifestyle related factors and medications also were found to have no significant effects although these factors have some influence. These results imply that CACS burden itself is a more important prognosis factor for future CVD in patients with T2DM. Above the “mild” CACS category, as the category increases, the HR for CVD increases approximately three times. It is particularly noteworthy that, above the “moderate” category, the incidence of CVD is overwhelmingly high under any condition, indicating a very poor CV prognosis in the future. At this stage, CACS may be one of the most important prognostic factors for future CV events in asymptomatic T2DM patients. Consistency of results was still maintained in the subgroup analysis.
In terms of the pathophysiology of CAC and atherosclerosis, CAC is typically detected in advanced atherosclerotic lesions with intimal calcification as well as in arteries with medial calcification, which are non-atherosclerotic lesions [28,29]. Arterial calcification in T2DM patients predominantly comprises medial calcification, and is highly associated with the risk of lower extremity amputation [29]. Nevertheless, the CAC area evaluated by electron beam computed tomography (EBCT) and the sum of the histologically evaluated atherosclerotic plaque area highly correlated not only in the whole heart but also in individual coronary arteries, and the actual plaque burden was approximately five-fold greater than the calcium burden assessed by EBCT [30].
This study has several limitations. First, considerable effort has been invested from the research design stage onward to exclude various biases; however, the limitations inherent in an observational cohort study remain. Second, the single-center cohort study design confers the possibility of selection biases. Third, data on lifestyles and medication compliance of patients only consist of self-reported information without objective verification, and there is the lack of information on socio-economic status of the subjects. Last, it is true that changes in medications taken by participants may have some effect on the results of the study. We tried to include the medications the participants were taking at the beginning of the study as adjustment factors, but we were unable to include in the analysis the careful changes in the factors throughout the follow-up period. Nevertheless, this study provides elaborately analyzed results based on accurate medical data and diagnosis during a long-term follow-up (>10 years). In addition, along with other confounding factors, the duration of diabetes and the effects of medications at baseline were carefully considered, and most participants underwent regular medical management without interim loss during the follow-up period.
In conclusion, this study demonstrated the significance of CACS as an additional CVD risk assessment tool in asymptomatic patients with T2DM even in an East Asian (Korean) population with relatively low CACS severity. Clinical significance of increased risk of CVD was confirmed under conditions above mild CACS (≥10), which may require high-intensity statins. However, if the CACS is less than 10, good prognosis for CVD for more than 10 years was guaranteed even in patients with T2DM. Moderate CACS (≥100) warns of an overwhelming increase in future CVD incidence, which requires more aggressive management and invasive evaluation protocols for early diagnosis of impending CV events. To further increase the clinical value of these results and to ensure reliability, a larger prospective study that compares the significance of CACS in patients with T2DM and those without diabetes is needed.

Supplementary Material

Supplemental Table S1.

Baseline Characteristics of Participants with and without Incident CVD during Follow-up
enm-2023-1770-Supplemental-Table-S1.pdf

Supplemental Table S2.

Risk for Future Cardiovascular Events according to Baseline CACS Categories
enm-2023-1770-Supplemental-Table-S2.pdf

Supplemental Table S3.

AUROC Analysis of the Optimal CACS Cutoff for Future Cardiovascular Disease Risk
enm-2023-1770-Supplemental-Table-S3.pdf

Supplemental Fig. S1.

Diagram for study subjects. Coronary artery calcium score (CACS) categories: absent, 0; minimal, 0< CACS <10; mild, 10≤ CACS <100; moderate, 100≤ CACS <400; and extensive, CACS ≥400. CVD, cardiovascular disease.
enm-2023-1770-Supplemental-Fig-S1.pdf

Supplemental Fig. S2.

Cumulative cardiovascular event-free survival according to the baseline coronary artery calcium score (CACS) categories. CVD, cardiovascular disease.
enm-2023-1770-Supplemental-Fig-S2.pdf

Notes

CONFLICTS OF INTEREST

No potential conflict of interest relevant to this article was reported.

AUTHOR CONTRIBUTIONS

Conception or design: D.J.K., E.J.R. Acquisition, analysis, or interpretation of data: D.J.K., M.Y.L., S.J.M., H.K., S.M.L., S.E.P., C.Y.P., W.Y.L., K.W.O., S.R.C., Y.H.J., E.J.R. Drafting the work or revising: D.J.K., Y.H.J., E.J.R. Final approval of the manuscript: D.J.K., E.J.R.

ACKNOWLEDGMENTS

The authors acknowledge the efforts of the Department of R&D Management at Kangbuk Samsung Hospital, Republic of Korea, in editing the figures and tables in this article.

REFERENCES

1. Haffner SM, Lehto S, Ronnemaa T, Pyorala K, Laakso M. Mortality from coronary heart disease in subjects with type 2 diabetes and in nondiabetic subjects with and without prior myocardial infarction. N Engl J Med. 1998; 339:229–34.
crossref
2. Schramm TK, Gislason GH, Kober L, Rasmussen S, Rasmussen JN, Abildstrom SZ, et al. Diabetes patients requiring glucose-lowering therapy and nondiabetics with a prior myocardial infarction carry the same cardiovascular risk: a population study of 3.3 million people. Circulation. 2008; 117:1945–54.
crossref
3. StatPearls. Treasure Island: StatPearls Publishing;2023. Chapter, Cardiovascular disease [cited 2023 Aug 29]. Available from: https://www.ncbi.nlm.nih.gov/books/NBK535419.
4. Benjamin EJ, Virani SS, Callaway CW, Chamberlain AM, Chang AR, Cheng S, et al. Heart disease and stroke statistics-2018 update: a report from the American Heart Association. Circulation. 2018; 137:e67–492.
5. Jung CH, Mok JO. Recent updates on vascular complications in patients with type 2 diabetes mellitus. Endocrinol Metab (Seoul). 2020; 35:260–71.
crossref
6. Shaw LJ, Raggi P, Schisterman E, Berman DS, Callister TQ. Prognostic value of cardiac risk factors and coronary artery calcium screening for all-cause mortality. Radiology. 2003; 228:826–33.
crossref
7. Raggi P, Shaw LJ, Berman DS, Callister TQ. Prognostic value of coronary artery calcium screening in subjects with and without diabetes. J Am Coll Cardiol. 2004; 43:1663–9.
crossref
8. Valenti V, Hartaigh BO, Cho I, Schulman-Marcus J, Gransar H, Heo R, et al. Absence of coronary artery calcium identifies asymptomatic diabetic individuals at low near-term but not long-term risk of mortality: a 15-year follow-up study of 9715 patients. Circ Cardiovasc Imaging. 2016; 9:e003528.
crossref
9. Elkeles RS, Godsland IF, Feher MD, Rubens MB, Roughton M, Nugara F, et al. Coronary calcium measurement improves prediction of cardiovascular events in asymptomatic patients with type 2 diabetes: the PREDICT study. Eur Heart J. 2008; 29:2244–51.
crossref
10. Cosentino F, Grant PJ, Aboyans V, Bailey CJ, Ceriello A, Delgado V, et al. 2019 ESC guidelines on diabetes, pre-diabetes, and cardiovascular diseases developed in collaboration with the EASD. Eur Heart J. 2020; 41:255–323.
11. LaMonte MJ, FitzGerald SJ, Church TS, Barlow CE, Radford NB, Levine BD, et al. Coronary artery calcium score and coronary heart disease events in a large cohort of asymptomatic men and women. Am J Epidemiol. 2005; 162:421–9.
crossref
12. Greenland P, Bonow RO, Brundage BH, Budoff MJ, Eisenberg MJ, Grundy SM, et al. ACCF/AHA 2007 clinical expert consensus document on coronary artery calcium scoring by computed tomography in global cardiovascular risk assessment and in evaluation of patients with chest pain: a report of the American College of Cardiology Foundation Clinical Expert Consensus Task Force (ACCF/AHA Writing Committee to Update the 2000 Expert Consensus Document on Electron Beam Computed Tomography) developed in collaboration with the Society of Atherosclerosis Imaging and Prevention and the Society of Cardiovascular Computed Tomography. J Am Coll Cardiol. 2007; 49:378–402.
13. Detrano R, Guerci AD, Carr JJ, Bild DE, Burke G, Folsom AR, et al. Coronary calcium as a predictor of coronary events in four racial or ethnic groups. N Engl J Med. 2008; 358:1336–45.
crossref
14. Erbel R, Mohlenkamp S, Moebus S, Schmermund A, Lehmann N, Stang A, et al. Coronary risk stratification, discrimination, and reclassification improvement based on quantification of subclinical coronary atherosclerosis: the Heinz Nixdorf Recall study. J Am Coll Cardiol. 2010; 56:1397–406.
15. Ferket BS, Hunink MG, Masharani U, Max W, Yeboah J, Burke GL, et al. Lifetime cardiovascular disease risk by coronary artery calcium score in individuals with and without diabetes: an analysis from the Multi-Ethnic Study of Atherosclerosis. Diabetes Care. 2022; 45:975–82.
crossref
16. Kramer CK, Zinman B, Gross JL, Canani LH, Rodrigues TC, Azevedo MJ, et al. Coronary artery calcium score prediction of all cause mortality and cardiovascular events in people with type 2 diabetes: systematic review and meta-analysis. BMJ. 2013; 346:f1654.
crossref
17. Arnett DK, Blumenthal RS, Albert MA, Buroker AB, Goldberger ZD, Hahn EJ, et al. 2019 ACC/AHA guideline on the primary prevention of cardiovascular disease: a report of the American College of Cardiology/American Heart Association task force on clinical practice guidelines. J Am Coll Cardiol. 2019; 74:e177–232.
18. Nasir K, Cainzos-Achirica M. Role of coronary artery calcium score in the primary prevention of cardiovascular disease. BMJ. 2021; 373:n776.
crossref
19. Youssef G, Kalia N, Darabian S, Budoff MJ. Coronary calcium: new insights, recent data, and clinical role. Curr Cardiol Rep. 2013; 15:325.
crossref
20. Agatston AS, Janowitz WR, Hildner FJ, Zusmer NR, Viamonte M Jr, Detrano R. Quantification of coronary artery calcium using ultrafast computed tomography. J Am Coll Cardiol. 1990; 15:827–32.
crossref
21. Erbel R, Mohlenkamp S, Kerkhoff G, Budde T, Schmermund A. Non-invasive screening for coronary artery disease: calcium scoring. Heart. 2007; 93:1620–9.
crossref
22. Kalinowski A, Humphreys K. Governmental standard drink definitions and low-risk alcohol consumption guidelines in 37 countries. Addiction. 2016; 111:1293–8.
crossref
23. Lee SH, Han K, Kim HS, Cho JH, Yoon KH, Kim MK. Predicting the development of myocardial infarction in middle-aged adults with type 2 diabetes: a risk model generated from a nationwide population-based cohort study in Korea. Endocrinol Metab (Seoul). 2020; 35:636–46.
crossref
24. Han D, O Hartaigh B, Gransar H, Yoon JH, Kim KJ, Kim MK, et al. Incremental benefit of coronary artery calcium score above traditional risk factors for all-cause mortality in asymptomatic Korean adults. Circ J. 2015; 79:2445–51.
crossref
25. Hong JC, Blankstein R, Shaw LJ, Padula WV, Arrieta A, Fialkow JA, et al. Implications of coronary artery calcium testing for treatment decisions among statin candidates according to the ACC/AHA cholesterol management guidelines: a cost-effectiveness analysis. JACC Cardiovasc Imaging. 2017; 10:938–52.
26. Han D, O Hartaigh B, Gransar H, Lee JH, Choi SY, Chun EJ, et al. Prevalence and distribution of coronary artery calcification in asymptomatic United States and Korean adults: cross-sectional propensity-matched analysis. Circ J. 2016; 80:2349–55.
crossref
27. Lee JH, Han D, O Hartaigh B, Rizvi A, Gransar H, Park HB, et al. Warranty period of zero coronary artery calcium score for predicting all-cause mortality according to cardiac risk burden in asymptomatic Korean adults. Circ J. 2016; 80:2356–61.
crossref
28. Ross R. The pathogenesis of atherosclerosis: a perspective for the 1990s. Nature. 1993; 362:801–9.
crossref
29. Thompson B, Towler DA. Arterial calcification and bone physiology: role of the bone-vascular axis. Nat Rev Endocrinol. 2012; 8:529–43.
crossref
30. Rumberger JA, Simons DB, Fitzpatrick LA, Sheedy PF, Schwartz RS. Coronary artery calcium area by electron-beam computed tomography and coronary atherosclerotic plaque area: a histopathologic correlative study. Circulation. 1995; 92:2157–62.
crossref

Fig. 1.
Cumulative cardiovascular (CV) event-free survival by coronary artery calcium score (CACS) cutoff 10 (A) and according to CACS categories at baseline (B).
enm-2023-1770f1.tif
Fig. 2.
Intergroup difference in the risk of cardiovascular (CV) events between participants with coronary artery calcium score (CACS) ≥10 and CACS <10 at baseline. Adjusted for age, sex, body mass index (BMI), glycated hemoglobin, systolic blood pressure, low-density lipoprotein cholesterol, creatinine, smoking status, alcohol consumption, regular exercise, diabetes mellitus (DM) medications, DM duration, and anti-dyslipidemia (DLP) medications. HR, hazard ratio; CI, confidence interval.
enm-2023-1770f2.tif
Fig. 3.
Receiver operating characteristic curve analysis of the optimal coronary artery calcium score (CACS) cutoff for future cardiovascular disease risk. SEN, sensitivity; SPE, specificity; AUC, area under the receiver operating characteristic curve; CI, confidence interval.
enm-2023-1770f3.tif
enm-2023-1770f4.tif
Table 1.
Baseline Characteristics of Participants with and without Coronary Artery Calcium
Characteristic Total CAC
P value
No Yes
No. of participants 981 543 (55.4) 438 (44.7)
Male sex 563 (57.4) 298 (54.9) 265 (60.5) 0.077
Age, yr 58.4±10.0 55.2±9.7 62.2±9.1 <0.001
BMI, kg/m2 25.4±3.3 25.3±3.3 25.5±3.2 0.446
Glycated hemoglobin, % 6.8±1.1 6.8±1.1 6.9±1.1 0.537
DM duration, mo 105.0±73.8 91.9±69.3 121.3±76.0 <0.001
SBP, mm Hg 121.2±13.8 120.0±13.5 122.8±1 0.001
DBP, mm Hg 72.2±9.3 72.4±9.4 71.9±9.2 0.454
Hypertension 617 (62.9) 316 (58.2) 301 (68.7) 0.001
Creatinine, mg/dL 1.3±3.7 1.3±4.9 1.2±1.2 0.376
AST, U/L 27.1±15.0 26.4±12.1 28.0±18.0 0.100
ALT, U/L 29.1±20.6 30.1±22.5 27.9±18.1 0.083
TC, mg/dL 166.0±38.1 166.9±38.6 164.9±37.5 0.423
LDL-C, mg/dL 94.0±49.1 95.1±60.6 92.6±28.9 0.403
HDL-C, mg/dL 50.5±12.1 51.0±12.3 49.8±11.7 0.118
UACR, mg/g 34.8±81.2 28.1±51.4 43.2±106.9 0.005
Alcohol consumptiona, drinks/wk 0.635
 <10 708 (72.8) 388 (71.5) 320 (73.1)
 ≥10 271 (27.6) 154 (28.4) 117 (26.7)
Current smoker 227 (23.1) 134 (24.7) 93 (21.2) 0.405
Regular exerciseb, times/wk 0.237
 <3 680 (69.3) 366 (67.4) 314 (71.7)
 ≥3 298 (30.4) 176 (32.4) 122 (27.9)

Values are expressed as number (%) or mean±standard deviation.

CAC, coronary artery calcium; BMI, body mass index; DM, diabetes mellitus; SBP, systolic blood pressure; DBP, diastolic blood pressure; AST, aspartate aminotransferase; ALT, alanine aminotransferase; TC, total cholesterol; LDL-C, low-density lipoprotein cholesterol; HDL-C, high-density lipoprotein cholesterol; UACR, urinary albumin-to-creatinine ratio.

a Alcohol consumption is defined, regardless of sex, as the consumption of >10 standard drinks (140 g) per week;

b Regular exercise is defined as moderate-intensity exercise lasting more than 1 hour, undertaken three times per week.

Table 2.
Risk for Future Cardiovascular Events by Baseline CACS
CACS No. (%) PY No. of event IR, /1,000 PY HR (95% CI)
Model 1 Model 2 Model 3 Model 4
CACS <10 631 (64.3) 6,733.67 13 1.93 (1.12–3.32) 1 (reference) 1 (reference) 1 (reference) 1 (reference)
CACS ≥10 350 (35.7) 3,285.99 58 17.65 (13.65–22.83) 8.94 (4.75–16.82) 8.92 (4.62–17.25) 8.28 (4.24–16.14) 8.41 (4.30–16.46)
Categories
Mild 10≤ CACS <100 172 (17.5) 1,743.58 13 7.46 (4.33–12.84) 4.29 (1.95–9.39) 4.17 (1.83–9.47) 4.02 (1.76–9.18) 4.09 (1.79–9.36)
Moderate 100≤ CACS <400 133 (13.6) 1,250.83 25 19.99 (13.51–29.58) 13.09 (6.40–26.81) 12.76 (6.08–26.76) 11.78 (5.53–25.11) 12.00 (5.61–25.69)
Extensive ≥400 45 (4.6) 291.58 20 68.59 (44.25–106.32) 45.35 (20.35–101.03) 43.47 (18.69–101.13) 37.99 (16.13–89.5) 38.79 (16.43–91.59)
P for trend <0.001 <0.001 <0.001 <0.001

Model 1: adjusted for age and sex; Model 2: additionally adjusted for body mass index, glycated hemoglobin, hypertension, low-density lipoprotein cholesterol, and creatinine; Model 3: additionally adjusted for smoking status, alcohol consumption, regular exercise, diabetes mellitus (DM) medications, and anti-dyslipidemia medications; Model 4: additionally adjusted for DM duration.

CACS, coronary artery calcium score; PY, person-years; IR, incidence rate; HR, hazard ratio; CI, confidence interval.

TOOLS
Similar articles