INTRODUCTION
METHODS
Retinal preparation
Multielectrode recording system and signal processing
Electrical stimulation
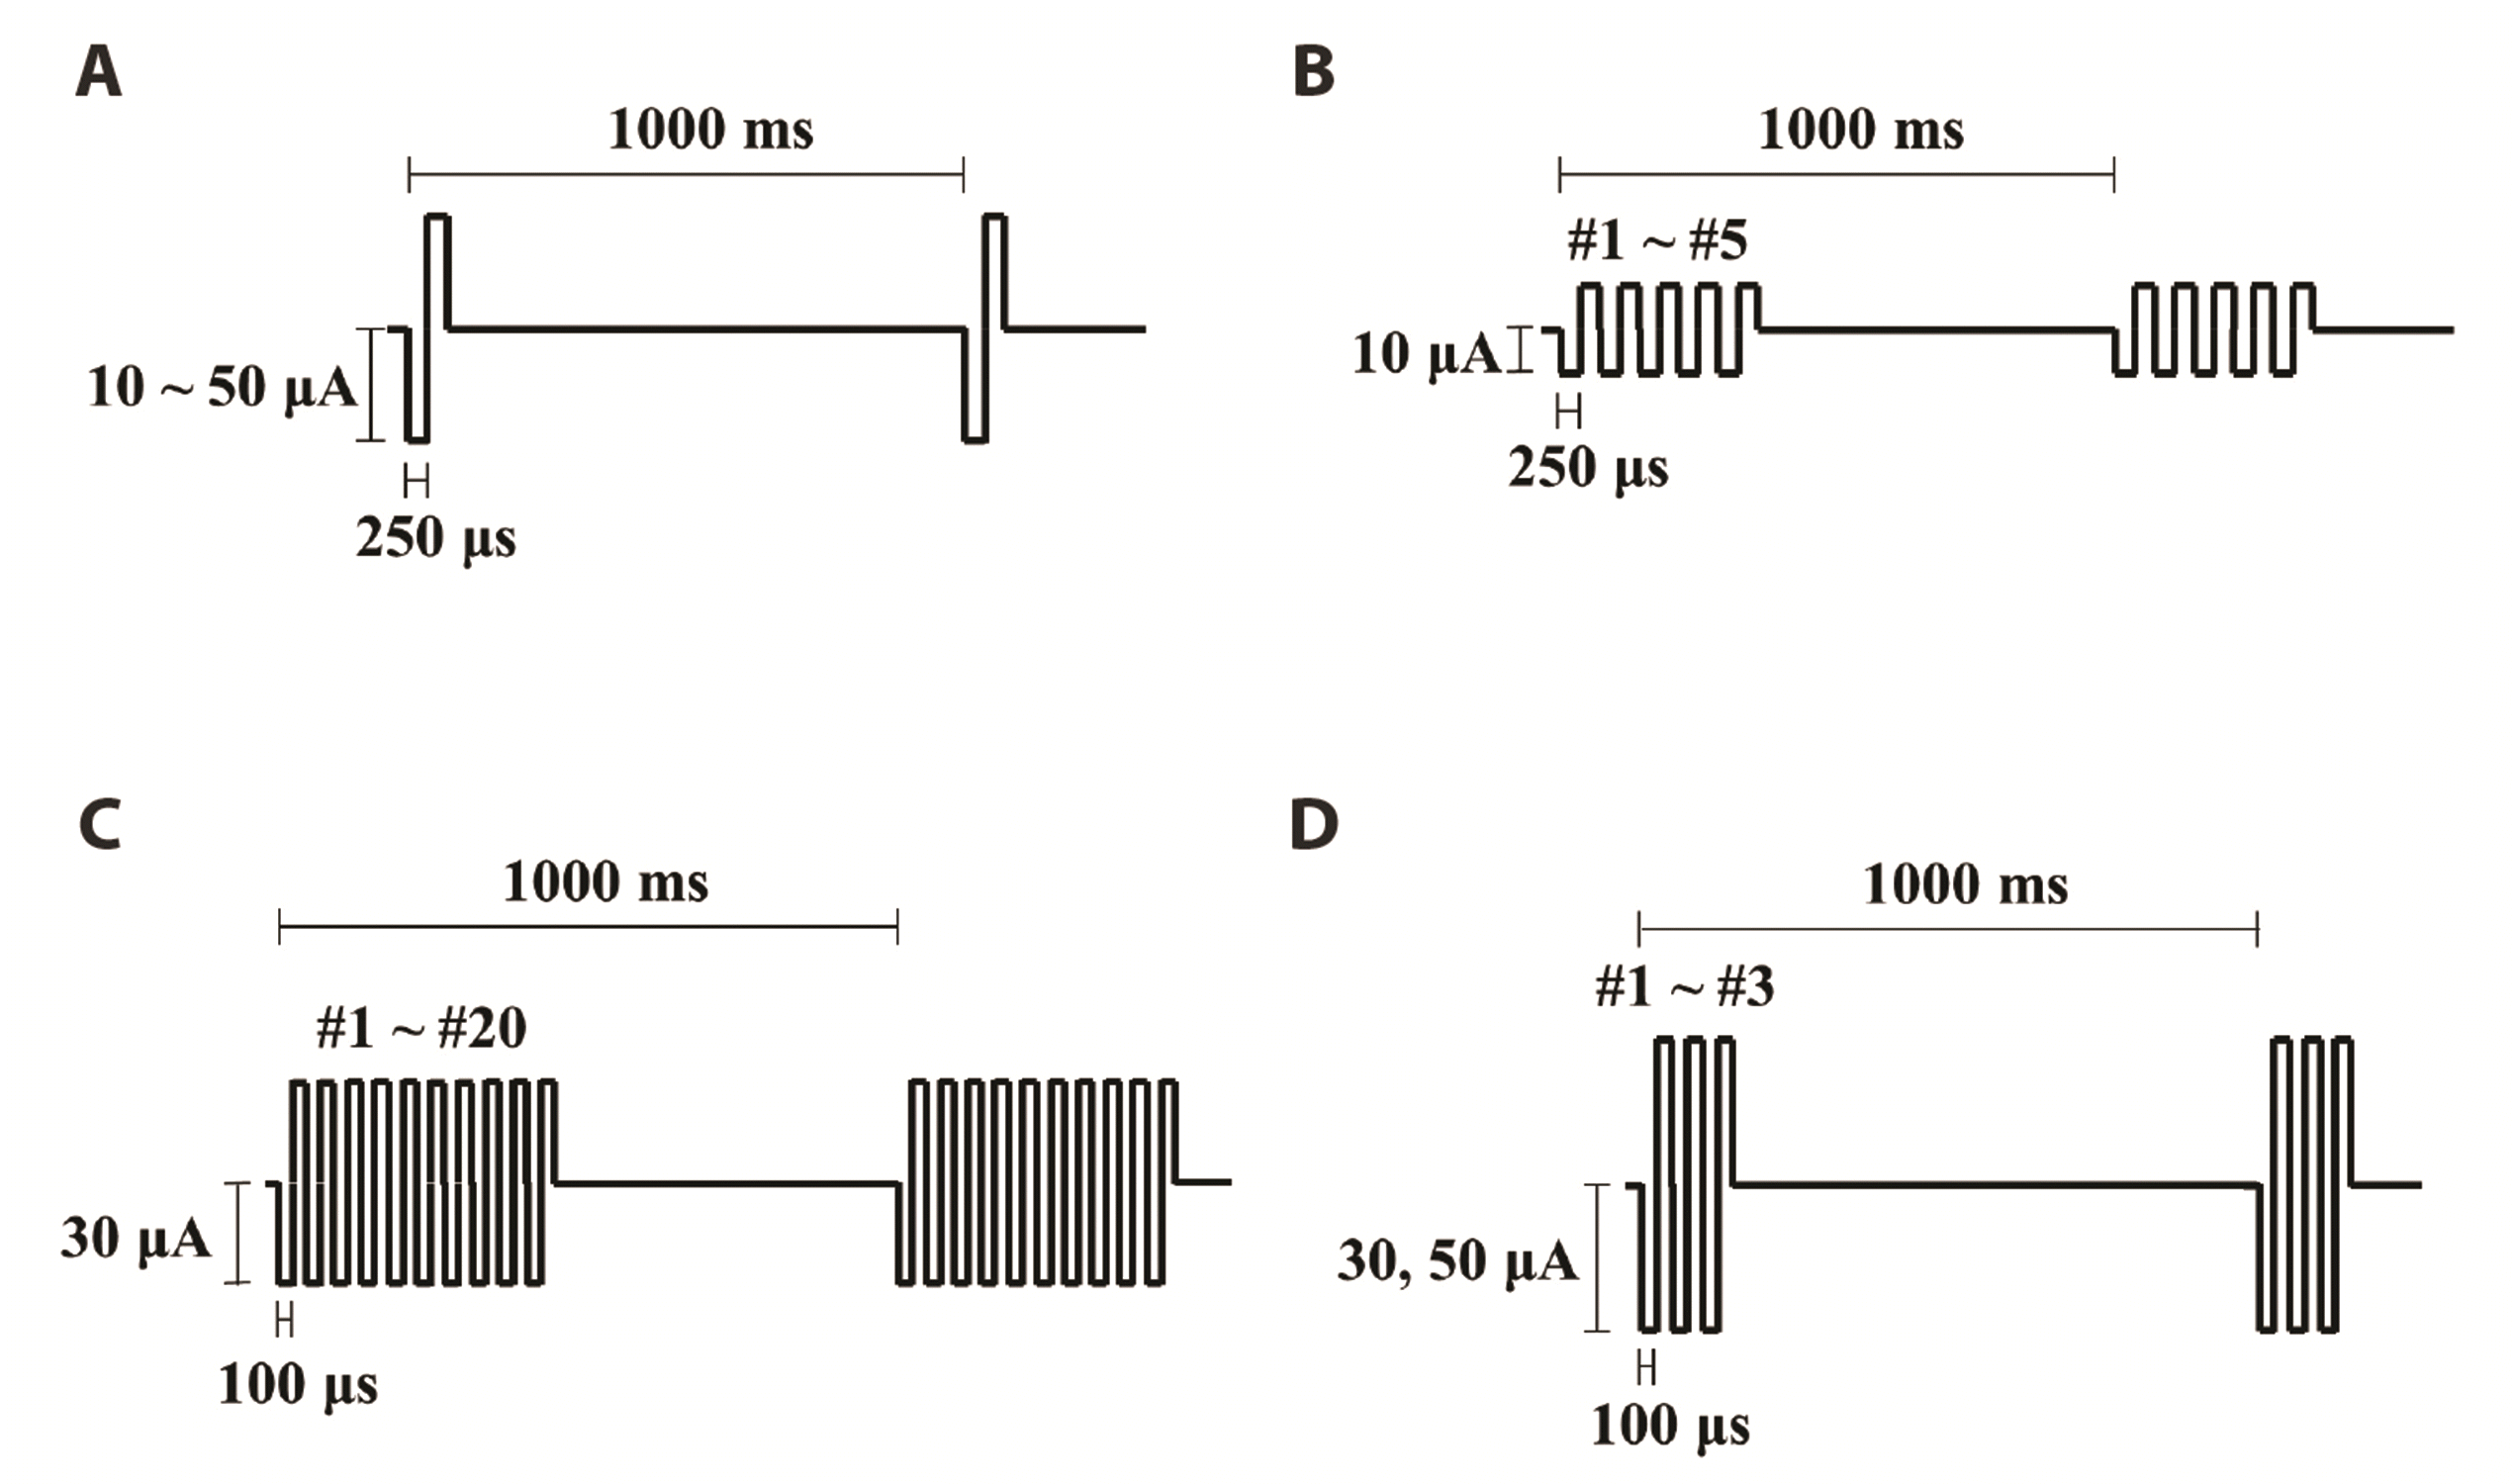 | Fig. 1Stimulus protocols used in the experiment.(A) Single-pulse stimulation. Pulse amplitudes range from 10 to 50 μA with pulse duration fixed at 250 μs are applied once per second. (B) Burst stimulation. The number of pulses per burst ranges from 1 to 5, with pulse duration fixed at 250 μs. (C) Burst stimulation. 1–20 pulses per burst. Pulse amplitude: 30 μA. Pulse duration: 100 μs. (D) Burst stimulation. 1–3 pulses per burst. Pulse amplitudes: 30 or 50 μA. Pulse duration: 100 μs.
|
 | Fig. 2Comparison of electrically-evoked RGC spikes between single-pulse and burst stimulation in the WT retina.(A) Left inset: MEA positions of the stimulation (channel 26, marked with a red dot) and recording (channel 36, marked with a yellow dot) electrodes spaced 200 μm apart. Left panel: Typical responses of the WT RGC to single-pulse stimulation are shown as raster plots. Electrically-evoked RGC spikes are highlighted. The time window for the raster plots is set to ± 0.1 sec, with 0 sec representing the stimulus onset (red dashed line). For each raster plot (10 trials), the pulse amplitude increases from top to bottom (10–50 μA). The pulse duration is fixed at 250 μs/phase. Middle panel: Typical responses of the WT RGC to burst stimulation are shown as raster plots. For each raster plot, the pulse number increases from top to bottom (#1–#5). Right panel: RGC response curves to single-pulse and burst stimulation in WT RGCs located 200 μm away from the stimulation electrode. Error bars represent the standard error of the mean (SEM). Statistical differences in response curves are indicated by asterisks (*p < 0.05). (B) Left and Middle panels: same representative raster plots of WT RGCs located 600 μm away from the stimulation electrode. Right panel: RGC response curves to single-pulse and burst stimulation in WT RGCs located 600 μm away from the stimulation electrode. Statistical differences in the graphs are indicated by asterisks (*p < 0.05, ***p < 0.001). (C) Changes in normalized responses with the distance between stimulation and recording electrodes. Left panel: single-pulse stimulation. The inset (spatial MEA color map) shows the normalized RGC responses in one representative retinal patch upon electrical stimulation with a pulse amplitude of 50 μA. The red dot indicates the location of the stimulation electrode. Right panel: burst stimulation. The inset (spatial MEA color map) shows the normalized RGC responses in one representative retinal patch upon electrical stimulation with five pulses per burst. RGC, retinal ganglion cell; WT, wild-type; MEA, multi-electrode array.
|
 | Fig. 3Comparison of electrically-evoked RGC spikes between single-pulse and burst stimulation in the RD retina.(A) Left inset: MEA positions of the stimulation (channel 52, marked with a red dot) and recording (channel 53, marked with a yellow dot) electrodes spaced 200 μm apart. Left panel: Typical responses of the RD RGC to single-pulse stimulation are shown as raster plots. Electrically-evoked RGC spikes are highlighted. The time window for the raster plots is set to ± 0.1 sec, with 0 sec representing the stimulus onset (red dashed line). For each raster plot (10 trials), the pulse amplitude increases from top to bottom (10–50 μA). The pulse duration is fixed at 250 μs/phase. Middle panel: Typical responses of the RD RGC to burst stimulation are shown as raster plots. For each raster plot, the pulse number increases from top to bottom (#1–#5). Right panel: RGC response curves to single-pulse and burst stimulation in RD RGCs located 200 μm away from the stimulation electrode. Error bars represent the standard error of the mean (SEM). Statistical differences in response curves are indicated by asterisks (*p < 0.05, **p < 0.01). (B) Left and Middle panels: same representative raster plots of RD RGCs located 600 μm away from the stimulation electrode. Right panel: RGC response curves to single-pulse and burst stimulation in RD RGCs located 600 μm away from the stimulation electrode. Statistical differences in the graphs are indicated by asterisks (*p < 0.05, **p < 0.01). (C) Changes in normalized responses with the distance between stimulation and recording electrodes. Left panel: single-pulse stimulation. The inset (spatial MEA color map) shows the normalized RGC responses in one representative retinal patch upon electrical stimulation with a pulse amplitude of 50 μA. The red dot indicates the location of the stimulation electrode. Right panel: burst stimulation. The inset (spatial MEA color map) shows the normalized RGC responses in one representative retinal patch upon electrical stimulation with five pulses per burst. RGC, retinal ganglion cell; RD, retinal degenerate; MEA, multi-electrode array.
|
 | Fig. 4Increasing the number of pulses per burst in the WT retina.(A) Typical responses of the WT RGC to burst stimulation are shown as raster plots. Electrically-evoked RGC spikes are highlighted. The time window of the raster plot is set to ± 0.1 sec, with 0 sec representing the stimulus onset (red dashed line). In each raster plot (10 trials), the pulse number increases from top to bottom (#1–#5, #9–#13, #16–#20). The pulse amplitude and pulse duration are fixed with 30 μA and 100 μs/phase. Only RGCs closest 200 μm to the stimulation electrode were analyzed. (B) RGC response curves as a function of pulse number. Error bars represent the standard error of the mean (SEM). Statistical differences in the graphs are indicated by asterisks (*p < 0.05). RGC, retinal ganglion cell; WT, wild-type.
|
 | Fig. 5Increasing the number of pulses per burst in the RD retina.(A) Typical responses of the RD RGC to burst stimulation are shown as raster plots. Electrically-evoked RGC spikes are highlighted. The time window of the raster plot is set to ± 0.1 sec, with 0 sec representing the stimulus onset (red dashed line). In each raster plot (10 trials), the pulse number increases from top to bottom (#1–#5, #9–#13, #16–#20). The pulse amplitude and pulse duration are fixed with 30 μA and 100 μs/phase. Only RGCs closest 200 μm to the stimulation electrode were analyzed. (B) RGC response curves as a function of pulse number. Error bars represent the standard error of the mean (SEM). Statistical differences in the graphs are indicated by asterisks (*p < 0.05). RGC, retinal ganglion cell; RD, retinal degenerate.
|
Pharmacological treatment
Data analysis
(1) Directly-evoked RGC responses in which RGCs are directly activated by electrical stimulation, showing short-latency spikes within 10 ms
(2) Bipolar cell-mediated RGC responses with median-latency spikes within 50 ms via synaptic relay after bipolar cell activation
(3) Photoreceptor-mediated RGC responses with long-latency spikes within 100 ms via synaptic relay after photoreceptor activation
RESULTS
Burst stimulation preserves the spatial resolution of the RGC population and elicits more RGC spikes
Doublet or triplet pulse stimulation is sufficient to induce RGC spikes
RD RGCs fire similarly to WT RGCs with burst stimulation
Burst stimulation activates RGCs by enhancing calcium-mediated synaptic transmission compared to single-pulse stimulation
 | Fig. 7Calcium-mediated RGC responses to burst stimulation in the RD retina.(A) Representative 1-second raw traces of RGCs in the RD retina without and with thapsigargin (Th) or Hi-Di solution. (B) Spontaneous firing rates of RGCs for RD, RD + Th, and RD + Hi-Di. Statistical differences in the graphs are indicated by asterisks (***p < 0.001). (C) Typical responses of RD RGCs to burst stimulation are shown as raster plots. Electrically-evoked RGC spikes are highlighted. The time window of the raster plot is set to ± 0.1 sec, with 0 sec representing the stimulus onset (red dashed line). In each raster plot (10 trials), the pulse number increases from top to bottom (#1–#5). The pulse amplitude and pulse duration are fixed with 30 μA and 100 μs/phase. Only RGCs 200 μm closest to the stimulation electrode are analyzed. (D) Normalized RGC response curves to burst stimulation. Error bars represent the standard error of the mean (SEM). Statistical differences in the response curves are indicated by asterisks (*p < 0.05, **p < 0.01, ***p < 0.001). RGC, retinal ganglion cell; RD, retinal degenerate; Hi-Di, high-divalent.
|
DISCUSSION
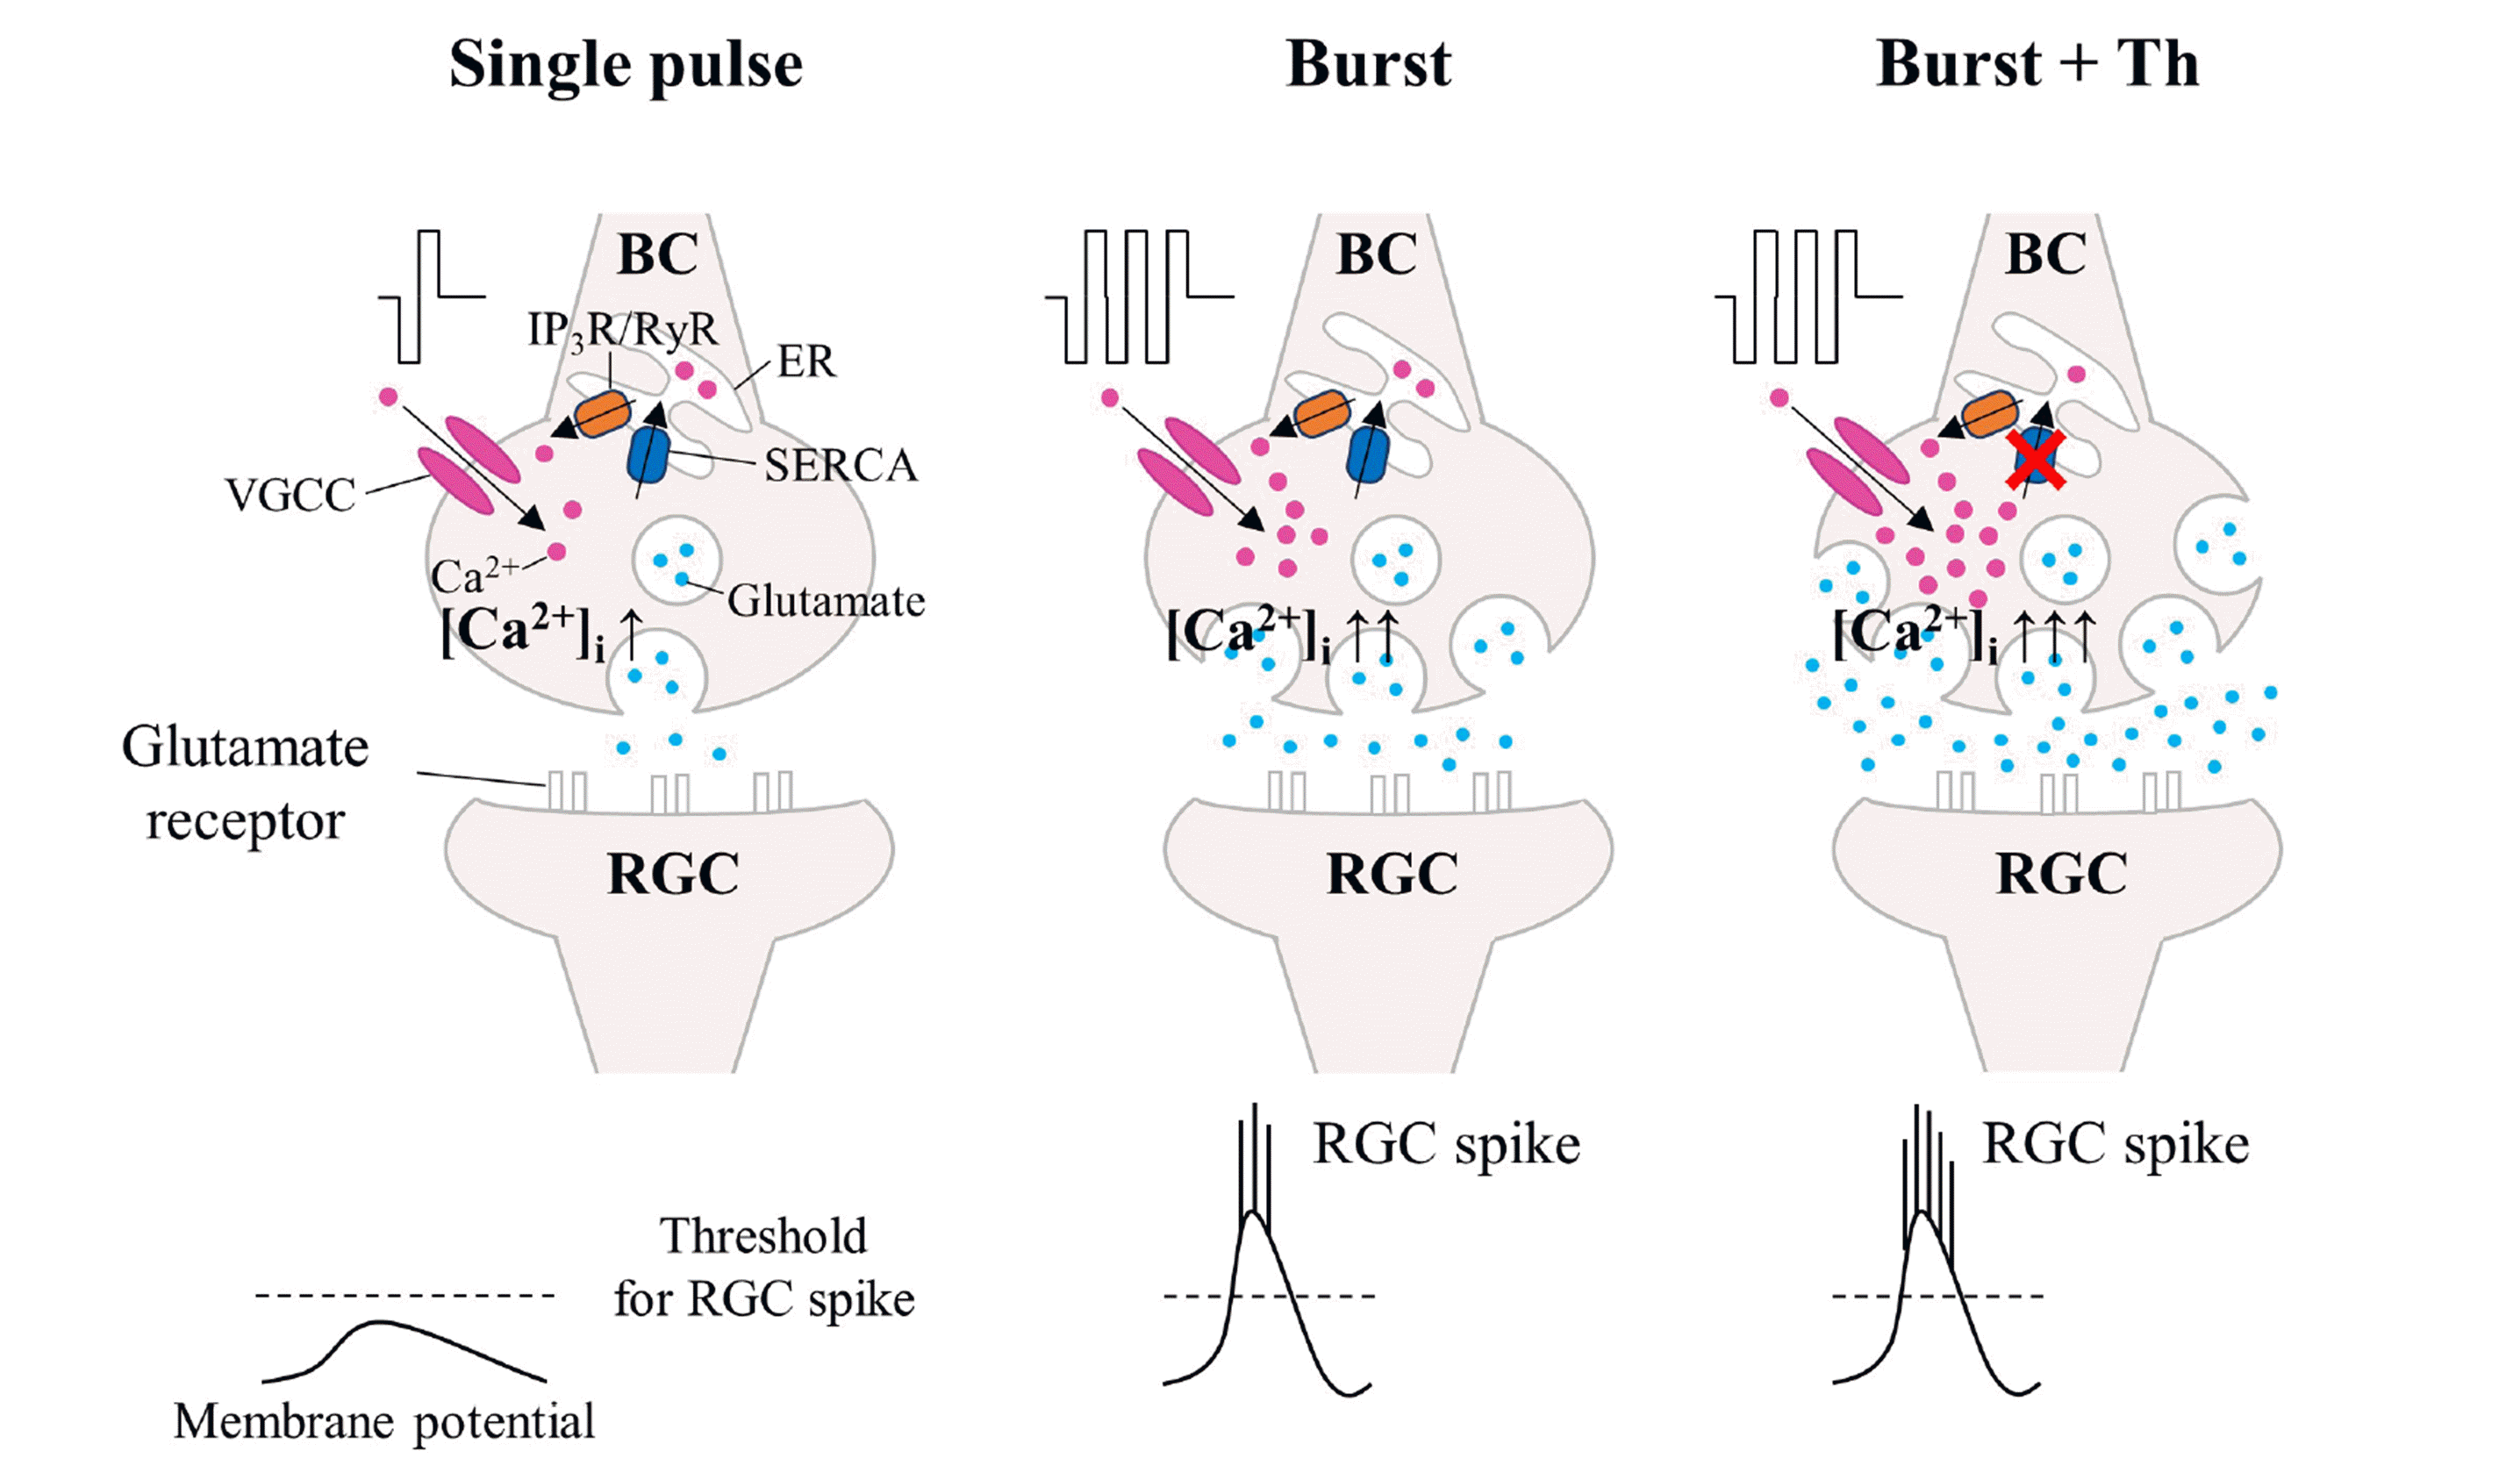 | Fig. 8Schematic diagram of calcium-mediated RGC firing to the burst stimulation.The burst stimulation strategy depends on an increase of intracellular calcium concentration, regulated by voltage-gated calcium channels (VGCCs) for calcium influx and sarco/endoplasmic reticulum Ca2+–ATPase (SERCA) for calcium reuptake. Burst stimulation activates VGCCs at bipolar cell (BC) synapses, boosting calcium influx and then glutamate release from the BC, therefore increasing RGC firing. Thapsigargin (Th) inhibits SERCA, preventing calcium reuptake, raising intracellular calcium concentration ([Ca2+]i), and then releasing glutamate from the bipolar cell, thus enhancing RGC firing. RGC, retinal ganglion cell; IP3R/RyR, inositol–1,4,5–triphosphate receptors/ryanodine receptors; ER, endoplasmic reticulum.
|


 PDF
PDF Citation
 Print
Print


 XML Download