

 PDF
PDF Citation
 Print
Print


INTRODUCTION
Gastric cancer (GC) is the fifth most common cancer and the fourth most common cause of cancer-related deaths worldwide [1], highlighting the need for a better understanding of its molecular characteristics. Advances in molecular analysis have enabled the identification of patient subsets with differing genomic alterations despite the same histologic diagnosis in GC [2]. In 2014, The Cancer Genome Atlas (TCGA) suggested four subtypes of GC and gastroesophageal junction cancers: Epstein–Barr virus, microsatellite instability (MSI), chromosomal instability, and genomically stable [3]. The molecular and clinical characteristics of these subtypes differ, emphasizing the importance of molecular profiling in patients with GC. Kim, et al. [4] classified the molecular subtypes of GC in Korean patients according to TCGA system and suggested that comprehensive analysis of genomic alterations may aid in the design of more appropriate clinical trials.
According to Surveillance, Epidemiology, and End Results Program (SEER) data from the National Cancer Institute spanning 2011–2020, 33.9% of patients with GC are diagnosed in stage IV [5]. Data from the National Cancer Information Center spanning 2016–2020 indicated that 11.0% of patients are diagnosed in a late stage [6]. The National Comprehensive Cancer Network recommends the use of a validated comprehensive next-generation sequencing (NGS)-based cell-free DNA (cfDNA) genomic profiling assay for patients with advanced or metastatic GC who may be unable to undergo a tissue biopsy for disease progression monitoring [7]. cfDNA analysis has gained attention for its capability of sufficiently identifying the molecular profile of cancer, facilitating the development of appropriate trials for molecularly targeted therapies [8]. The Food and Drug Administration (FDA) recently approved PIK3CA and EGFR mutation testing of cfDNA in breast cancer and non-small cell lung cancer, respectively, highlighting the clinical utility of cfDNA analysis [9, 10].
Genetic analysis in patients with GC has revealed several biomarkers for targeted therapy in GC. For example, the identification of ERBB2 amplification led to the first targeted treatment approach for GC [11]. The VIKTORY (targeted agent eValuation In gastric cancer basket KORea) trial in 2019 was the first and largest platform study in GC, showing the feasibility of tumor profiling and its clinical utility [12]. Recently, the fibroblast growth factor receptor (FGFR) pathway has been reported as a promising treatment target, and clinical trials on FGFR pathway inhibition are being implemented [13, 14]. As suggested by several studies [4, 12, 15], GC molecular profiling aids not only in patient disease monitoring and treatment selection but also in the identification of candidate biomarkers for targeted therapies.
We aimed to identify well-defined targets or biological pathways that could potentially be used for molecular targeted therapy in patients with GC by analyzing cfDNA data obtained using the Ion Torrent S5 XL (Thermo Fisher Scientific, Waltham, MA, USA) and Illumina NextSeq-550 (Illumina, San Diego, CA, USA) platforms. In addition, we demonstrated the advantages of cfDNA analysis in patients with GC.
MATERIALS AND METHODS
Study population
We conducted cfDNA analysis of 149 patients with solid cancer between September 2019 and February 2022. Among these patients, 81 were diagnosed as having advanced or metastatic GC by oncologists. In this retrospective study, cfDNA data and the medical records of these patients were reviewed. Forty of the patients were treatment-naïve, whereas 41 had previously undergone chemotherapy but had experienced recurrence or progression of GC. For the cfDNA analysis, all patients provided written informed consent for sample collection and genetic analysis. The study was approved by the Institutional Review Board of Gangnam Severance Hospital, Seoul, Korea (IRB No. 3-2022-0136).
Nucleic acid extraction from plasma
Peripheral blood samples were collected into EDTA blood collection tubes (Vacutainer K2EDTA; BD Biosciences, Franklin Lakes, NJ, USA). Plasma was isolated by centrifugation at 2,000×g for 10 mins followed by high-spin centrifugation at 16,000×g, 4°C for 10 mins. Plasma aliquots were stored at –80°C [16]. cfDNA was extracted using the MagMAX Cell-Free Total Nucleic Acid Kit (Thermo Fisher Scientific) according to the manufacturer’s instructions. The cfDNA concentration and size distribution were assessed using a Qubit 3.0 Fluorometer (Thermo Fisher Scientific) for samples tested using Ion Torrent and a 2200 TapeStation Instrument (Agilent Technologies, Santa Clara, CA, USA) with the Agilent High Sensitivity D1000 ScreenTape System or Genomic DNA ScreenTape System for samples tested using Illumina. For assays A and B, approximately 30 μg of fragmented DNA from each plasma sample (4 mL) was used.
Cell-free DNA NGS assays
Genomic alterations that may serve as cancer biomarkers were analyzed using two NGS panels and sequencing platforms. The Oncomine Pan-Cancer Cell-Free Assay (Thermo Fisher Scientific) using Ion Torrent semi-conductor sequencing technology and the AlphaLiquid 100 kit (IMBDx, Seoul, Korea) using sequencing-by-synthesis technology were used. The respective target genes are listed in Table 1. In this paper, the Oncomine Pan-Cancer Cell-Free Assay is referred to as “assay A” and the AlphaLiquid 100 assay as “assay B”. For assay A, BRCA1, BRCA2, and MYCN were additionally tested using the Ion AmpliSeq HD Custom Panel (Thermo Fisher Scientific).
Table 1
Target genes evaluated by the two assays used for cfDNA analysis in this study
| Mutation type | Genes | |
|---|---|---|
| Oncomine Pan-Cancer Cell-Free Assay | AlphaLiquid 100 kit | |
| SNVs, small indels | AKT1, ALK, APC, AR, ARAF, BRAF, BRCA1*, BRCA2*, CHEK2, CTNNB1, DDR2, EGFR, ERBB2, ERBB3, ESR1, FBXW7, FGFR1, FGFR2, FGFR3, FGFR4, FLT3, GNA11, GNAQ, GNAS, HRAS, IDH1, IDH2, KIT, KRAS, MAP2K1, MAP2K2, MET, MTOR, NRAS, NTRK1, NTRK3, PDGFRA, PIK3CA, PTEN, RAF1, RET, ROS1, SF3B1, SMAD4, SMO, TP53 | ABL1, AKT1, AKT2, ALK, APC, AR, ARAF, ARID1A, ATM, BRAF, BRCA1, BRCA2, BTK, CBL, CCND1, CCND2, CCNE1, CD274, CDH1, CDK4, CDK6, CDKN2A, CEBPA, CSF1R, CTNNB1, DDR2, DPYD, EGFR, ERBB2, ERBB3, ESR1, FBXW7, FGFR1, FGFR2, FGFR3, FLT3, GATA3, GNA11, GNAQ, GNAS, HRAS, IDH1, IDH2, IGF1R, JAK2, JAK3, KDM6A, KDR, KEAP1, KIT, KRAS, MAP2K1, MAP2K2, MAPK1, MAPK3, MDM2, MET, MLH1, MPL, MSH2, MSH6, MTOR, MYC, MYCN, NF1, NF2, NFE2L2, NOTCH1, NPM1, NRAS, NTRK1, NTRK2, NTRK3, PDCD1LG2, PDGFRA, PDGFRB, PIK3CA, PIK3R1, PMS2, PPP2R1A, PTEN, PTPN11, RAF1, RB1, RET, RHEB, RHOA, RIT1, RNF43, ROS1, RUNX1, SETD2, SMAD4, SMO, STAG2, STK11, TCF7L2, TERT, TOP2A, TP53, TSC1, TSC2, U2AF1, UGT1A1, VHL |
| CNVs | CCND1, CCND2, CCND3, CDK4, CDK6, EGFR, ERBB2, FGFR1, FGFR2, FGFR3, MET, MYC, MYCN* | ABL1, AKT1, AKT2, ALK, APC, AR, ARAF, ARID1A, ATM, BRAF, BRCA1, BRCA2, BTK, CBL, CCND1, CCND2, CCNE1, CD274, CDH1, CDK4, CDK6, CDKN2A, CEBPA, CSF1R, CTNNB1, DDR2, DPYD, EGFR, ERBB2, ERBB3, ESR1, FBXW7, FGFR1, FGFR2, FGFR3, FLT3, GATA3, GNA11, GNAQ, GNAS, HRAS, IDH1, IDH2, IGF1R, JAK2, JAK3, KDM6A, KDR, KEAP1, KIT, KRAS, MAP2K1, MAP2K2, MAPK1, MAPK3, MDM2, MET, MLH1, MPL, MSH2, MSH6, MTOR, MYC, MYCN, NF1, NF2, NFE2L2, NOTCH1, NPM1, NRAS, NTRK1, NTRK2, NTRK3, PDCD1LG2, PDGFRA, PDGFRB, PIK3CA, PIK3R1, PMS2, PPP2R1A, PTEN, PTPN11, RAF1, RB1, RET, RHEB, RHOA, RIT1, RNF43, ROS1, RUNX1, SETD2, SMAD4, SMO, STAG2, STK11, TCF7L2, TERT, TOP2A, TP53, TSC1, TSC2, U2AF1, UGT1A1, VHL |
| Fusions | ALK, BRAF, ERG, ETV1, FGFR1, FGFR2, FGFR3, MET, NTRK1, NTRK3, RET, ROS1 | ALK, BCR, BRAF, EGFR, FGFR2, FGFR3, NTRK1, NTRK2, RET, ROS1 |
| Exon skipping | MET exon 14 skipping | MET exon 14 skipping |
![]()
Assay A
A DNA library of 49 samples was prepared. Templating and sequencing were performed using the Ion 540 Kit on the Ion Chef and on Ion Torrent. Alignment to the hg19 human reference genome and variant calling were performed using the Torrent Suite software v.5.12 and Ion Reporter v.5.14 (Thermo Fisher Scientific), respectively. The Torrent Suite software was used to assess molecular coverage depth and read coverage depth at the target base.
Assay B
A DNA library of 32 samples was prepared. Hybrid capture-selected libraries were sequenced on an Illumina in the 150-bp paired-end mode. All sequencing reads were demultiplexed and converted into unmapped bam files, which store extracted unique molecular identifier (UMI) sequences. The unmapped bam files were aligned to the reference genome (GRCh38) using the Burrows–Wheeler Aligner MEM algorithm (0.7.17-r1188) [17]. GeneFuse [18] and SViCT [19] were used for gene fusion detection. Sequencing data were analyzed using AlphaLiquid Analysis Browser IMBER v.1.2 (IMBDx). Assay B can detect MSI in cfDNA. MSI was analyzed according to the manufacturer’s protocol.
Data interpretation and reporting
Both assays allow analyzing single-nucleotide variants (SNVs), insertions/deletions (indels), copy number variations (CNVs), and fusions. According to the manufacturers’ specifications, the limits of detection (LODs) for SNVs and indels were set at an allele frequency (AF) of 0.1%. For LOD validation, we conducted tests using Seracare circulating tumor DNA (ctDNA) complete samples with AFs of 0.5% and 2.5%, and Seracare ctDNA Mutation V2 samples with an AF of 0.5%. We were unable to confirm variants with an AF <0.5%. Deveson, et al. [20] suggested that variants with an AF >0.5% can be detected with high sensitivity, precision, and reproducibility. Considering these findings, candidate variants were considered valid only if they met two criteria: (1) a minimum coverage of >5 molecular counts (assay A) or >5 fragment counts (assay B), and (2) an AF of ≥0.5% of total reads covering a given base in a single sample. All genomic variants were manually checked using Integrative Genomics Viewer.
For CNVs and fusions, we adapted the manufacturers’ specifications. For CNV reporting, assay A instructions recommend the sample-level QC criteria of the median absolute pairwise difference to be <0.4. The CNV ratio call thresholds had been empirically derived by the manufacturer using plasma samples from healthy donors with a normal CNV status [21]. To pass the bioinformatic QC threshold for CNVs, the CNV ratio for a copy number gain must be >1.15, and called copy number gains were visually reviewed from a copy number plot generated by Ion Reporter [22]. Assay A does not report copy number loss. For CNV reporting in assay B, at least ≥2.6 copies were considered. For fusion reporting, ≥2 reads with mapping quality ≥10 should be satisfied.
For interpretation and reporting, tiers I–III of both fusions and CNVs were reported according to the guidelines of the Association for Molecular Pathology, American Society of Clinical Oncology, and College of American Pathologists [23]. To exclude germline variants, we conducted Sanger sequencing on patients’ peripheral blood mononuclear cells (PBMCs) for variants classified as tier I or tier II with AFs of 40%–60%.
RESULTS
Quality metrics
Sample-level QCs of assays A and B are summarized in Supplemental Data Tables S1 and S2, respectively. Sample DNA concentrations are presented in Supplemental Data Fig. S1. The median DNA concentrations measured using the Qubit 3.0 Fluorometer and 2200 TapeStation were 3.2 ng/µL and 2.8 ng/µL, respectively. The median cfDNA inputs in assays A and B were 32.0 ng and 30.9 ng, respectively.
For assay A, the median percentage on-target reads was 97%, median uniformity of base coverage was 99%, median overall mapped reads was 19,995,625, median read coverage was 60,380, and median molecular coverage was 6,201. For assay B, the median mapped reads in the high- and mid-output flow cells were 84,960,287 and 128,087,414, respectively. The median on-target read ratios were 64.5 for the high-output flow cell and 73.5 for the mid-output flow cell. The median on-target mean depths in the high- and mid-output flow cells were 13,021 and 20,875, respectively. Fragment uniformity was 97% for both flow cells.
Genomic alterations in GC
Among the 81 patients with GC, 48 were male and 33 were female, and the median age was 58 yrs (range, 25–82 yrs). At the time of diagnosis, three patients were in TNM stage IIb, one in IIIa, three in IIIb, two in IIIc, and 72 in stage IV. All patients were diagnosed as having advanced or metastatic GC by an oncologist. Patient characteristics and cfDNA analysis results are provided in Supplemental Data Table S3. Among the 81 patients, 40 patients were treatment-naïve. Tier I or II alterations were detected in 80% (32/40) of treatment-naïve patients and in 48.8% (20/41) of patients who were not treatment-naïve.
Among 32 samples tested with assay B, 30 samples showed microsatellite stability (MSS), one MSI-high, and one MSI-low. Six of the 32 patients were also tested for MSI in tissue; the results were all MSS, which agreed with the results for cfDNA. Tier I or II alterations were detected in 52 of 81 patients (64.2%). Assays A and B detected tier I or II variants in 28/49 patients (57.1%) and 24/32 patients (75.0%), respectively. Four CNVs were reported as tier I. Seventy-four SNVs, 21 indels, 23 CNVs, and one fusion were reported as tier II; 163 SNVs, 12 indels, and seven CNVs were reported as tier III. Patient No. 29 reportedly had an EGFR–SEPT14 fusion, which is considered a noteworthy fusion in GC (Supplemental Data Table S3) [24]. The tier I and II mutations detected in the 81 patients are shown in Fig. 1.
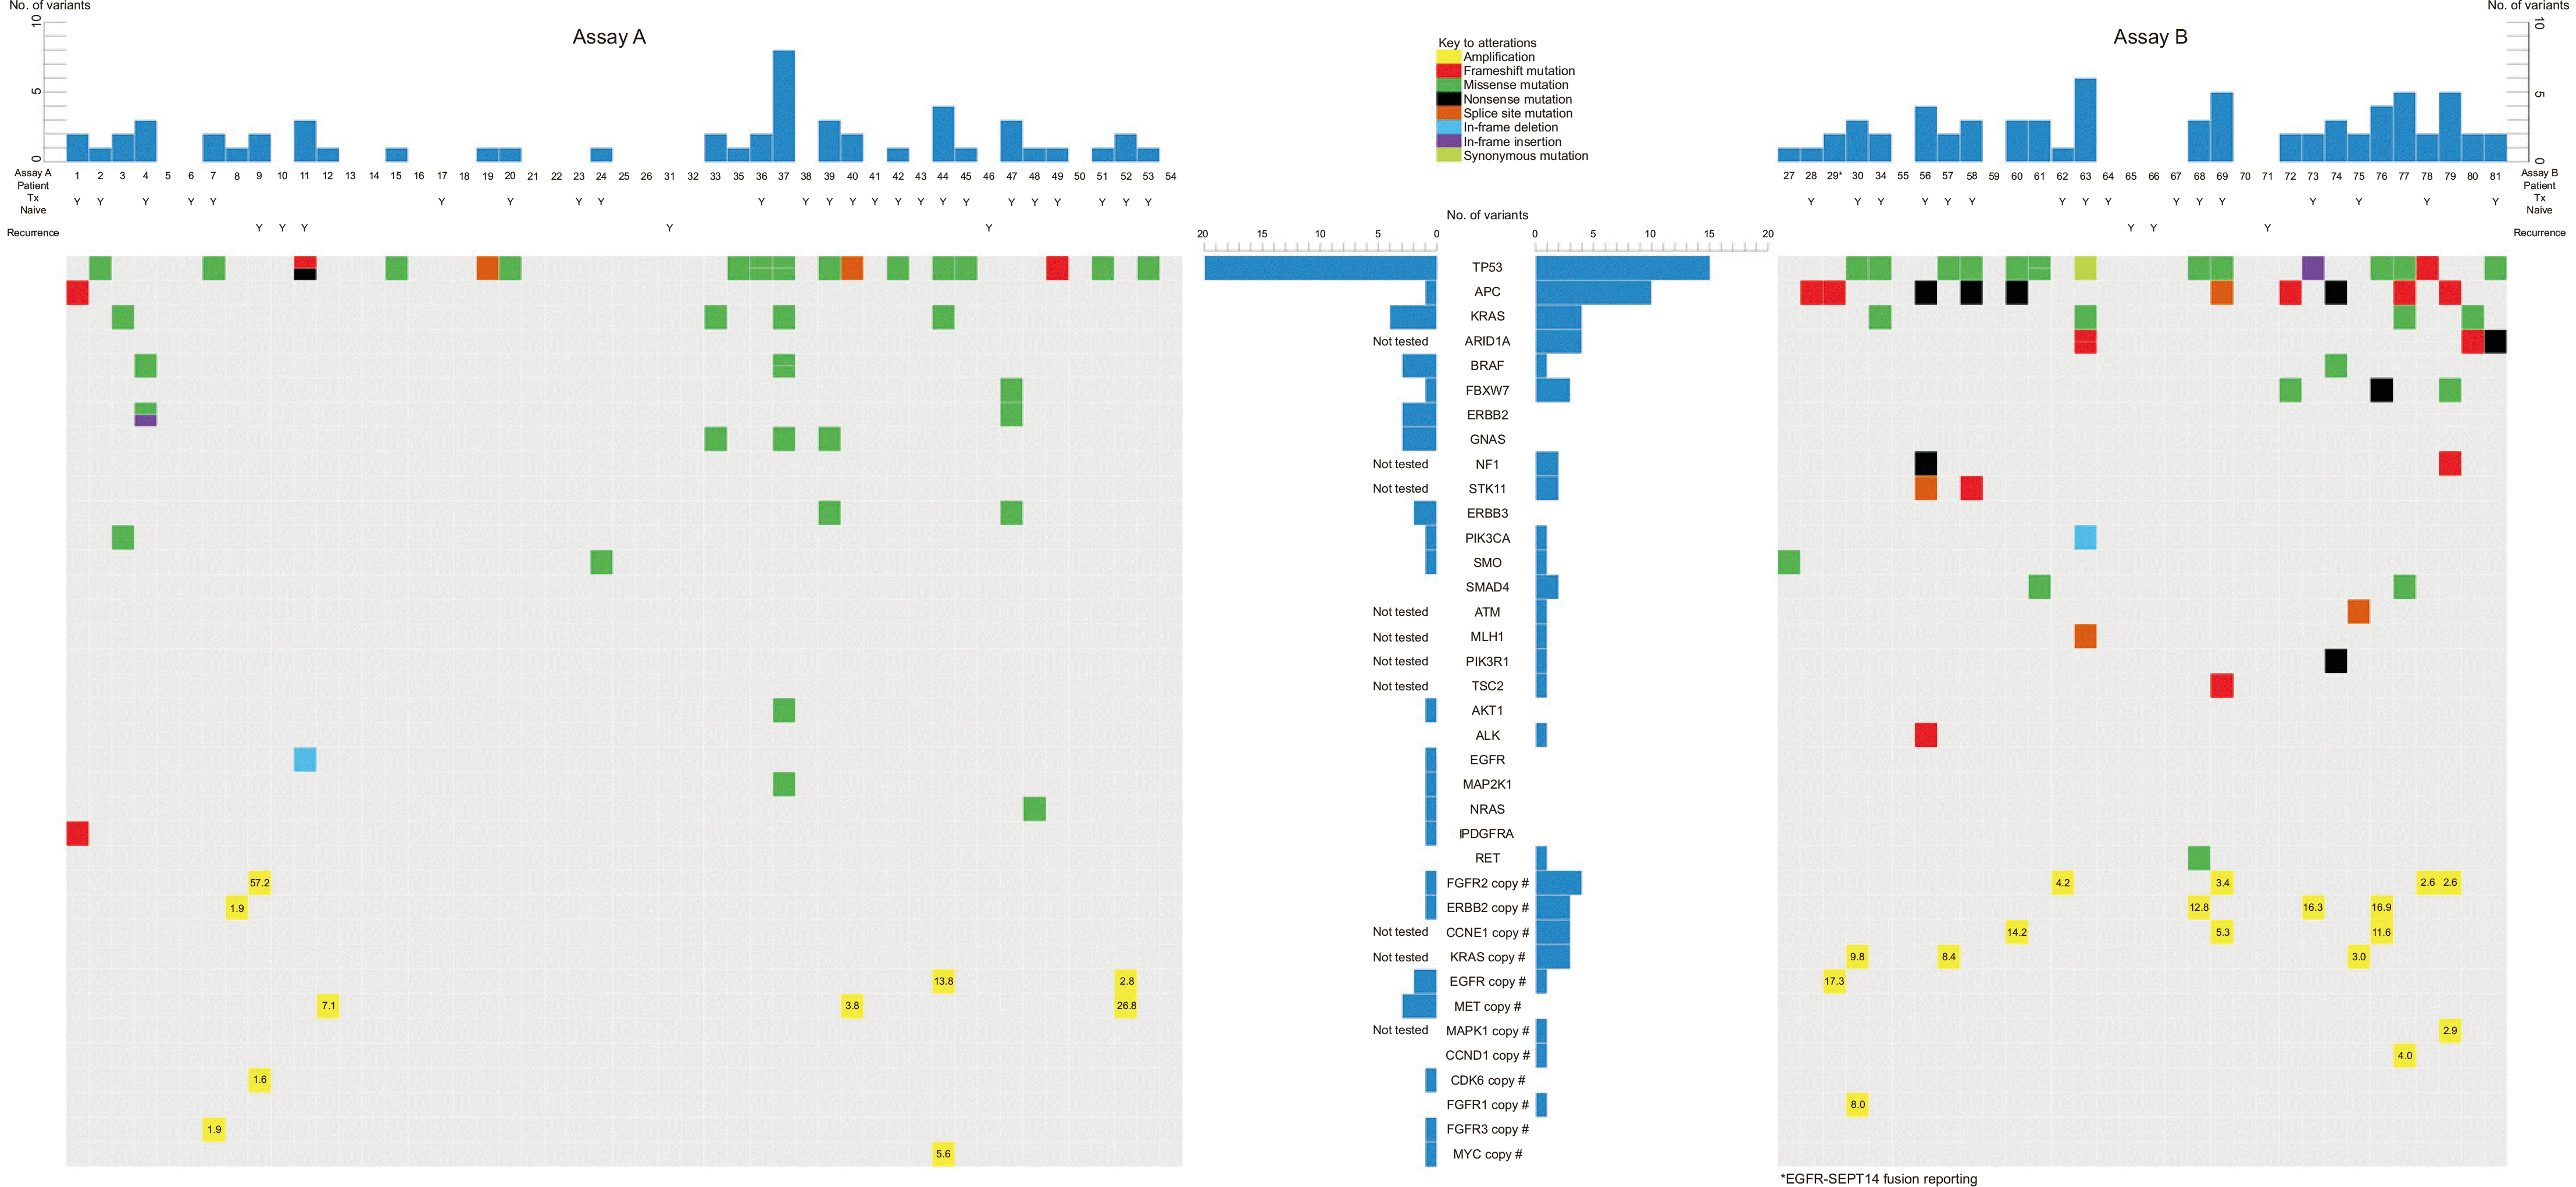
The most commonly detected mutations were TP53 mutations, which accounted for 38.3% (31/81 patients). Other frequently detected mutations included APC (13.6%, 11/81 patients), KRAS (9.9%, 8/81 patients), ARID1A (9.4%, 3/32 patients), FBXW7 (4.9%, 4/81 patients), and BRAF (3.7%, 3/81 patients) mutations. CNVs were most frequently detected in FGFR2, accounting for 6.2% (5/81 patients), followed by ERBB2 (4.9%, 4/81 patients), CCNE1 (9.4%, 3/32 patients), KRAS (9.4%, 3/32 patients), EGFR (3.7%, 3/81 patients), and MET (3.7%, 3/81 patients) (Table 2).
Table 2
Commonly detected mutations in our study
| Gene | Frequency | N by mutation type |
|---|---|---|
| TP53 | 38.3% (31/81) | 31 SNVs and 4 indels |
| APC | 13.6% (11/81) | 5 SNVs and 6 indels |
| KRAS | 9.9% (8/81) | 8 SNVs |
| ARID1A | 9.4% (3/32) | 1 SNV and 3 indels |
| FBXW7 | 4.9% (4/81) | 4 SNVs |
| BRAF | 3.7% (3/81) | 4 SNVs |
| FGFR2* | 6.2% (5/81) | 5 amplifications |
| ERBB2* | 4.9% (4/81) | 4 amplifications |
| CCNE1* | 9.4% (3/32) | 3 amplifications |
| KRAS* | 9.4% (3/32) | 3 amplifications |
| EGFR* | 3.7% (3/81) | 3 amplifications |
| MET* | 3.7% (3/81) | 3 amplifications |
![]()
Molecular characterization for targeted therapy in clinical trials
The patients were categorized based on specific biomarkers for targeted therapy and markers undergoing clinical trials. Eleven biomarkers were selected from Nakamura, et al. [15] and Lee, et al. [12] (Table 3). Among these, ERBB2 amplification is actionable and can be treated with a combination of trastuzumab and chemotherapy, as approved by the FDA for patients with GC [7, 15]. In our cfDNA data, ERBB2 amplification was detected in four of 81 patients (4.9%). One of 49 patients (2.0%) showed ERBB2 amplification in assay A and three of 32 patients (9.4%) in assay B.
Table 3
Patient subgroup according to established and potential biomarkers of targeted therapies in gastric cancer
| Biomarker* | Established/in clinical trials‡ | N | Specifications |
|---|---|---|---|
| ERBB2 amplification |
First line: trastuzumab+chemotherapy Third line: trastuzumab, deruxtecan NCT05190445, NCT05152147, NCT02465060, NCT04143711 |
4 (4/81, 4.9%) |
Assay A: 1/49, 2.0% Assay B: 3/32, 9.4% |
| FGFR2 amplification | NCT05019794, NCT04189445 | 5 (5/81, 6.2%) |
Assay A: 1/49, 2.0% Assay B: 4/32, 12.5% |
| FGFR1 amplification | NCT05019794, NCT04189445 | 1 (1/81, 1.2%) |
Assay A: 0/49, 0.0% Assay B: 1/32, 3.1% |
| EGFR amplification | NCT04077255, NCT04739202 | 3 (3/81, 3.7%) |
Assay A: 2/49, 4.1% Assay B: 1/32, 3.1% |
| CCNE1 amplification† | NCT05252416 | 3 (3/32, 9.4%) | - |
| RAS mutation or amplification† | NCT02465060 | 12 (9/81, 11.1%; 3/32, 9.4%) |
Assay A: 5/49, 10.2% Assay B: 4/32, 12.5% 9 mutations (8 KRAS, 1 NRAS) 3 KRAS amplifications |
| TP53 mutation | NCT03641313 | 31 (31/81, 38.3%) |
Assay A: 17/49, 34.7% Assay B: 14/32, 43.8% 35 mutations in 31 patients |
| PIK3CA mutation or amplification† | NCT04526470, NCT04739202, NCT02465060 | 2 (2/81, 2.5%) |
Assay A: 1/49, 2.0% Assay B: 1/32, 3.1% 2 mutations No amplification |
| ARID1A mutation† | NCT05379972 | 3 (3/32, 9.4%) | 4 mutations from 3 patients |
| MET amplification | NCT04923932, NCT05620628, NCT05439993, NCT03993873, NCT02465060 | 3 (3/81, 3.7%) |
Assay A: 3/49, 6.1% Assay B: 0/32, 0.0% |
| TSC2 null† | NCT02465060 | 1 (1/32, 3.1%) | p.Phe471LeufsTer14 from #69 patient |
![]()
The remaining 10 biomarkers are not currently actionable but show potential for possible targeted therapy, with clinical trials underway. Details on these 10 biomarkers in phase II or III clinical trials that are “active, not recruiting” or “recruiting” are listed in Table 3. Among the 52 patients with significant tier I or II variants, 45 patients (45/52, 86.5%; 45/81, 55.6%) had noteworthy biomarkers that could be detected using liquid biopsy.
DISCUSSION
We report on our experience with using two different NGS platforms for cfDNA analysis and demonstrated the effectiveness of liquid biopsy for molecular profiling of patients with GC. Using assays A and B, tier I or II variants were identified in 28/49 (57.1%) and 24/32 (75.0%) patients, respectively. Overall, tier I or II variants were detected in 64.2% (52/81) of patients with GC.
To increase the detection of true-positive mutations from highly fragmented and low quantities of circulating tumor DNA, UMIs were applied in both assays A and B. In assay B, the UniqSeq protocol and a series of IMBdx in-house filtering steps were used to eliminate false calls, and a machine learning model was used to distinguish true variants from false calls [25]. Both assays were able to detect significant variants in more than half of the patients, with assay B being developed later and containing more target genes than assay A.
Based on our routine laboratory practice, both NGS assays have their pros and cons. Assay A is developed for Ion Torrent, a PCR-based enrichment method. It has a two-day sample-to-report workflow [26], and cfDNA concentrations as low as 5 ng may be sufficient for evaluation [27]. However, because of the characteristics of the amplicon-based method, it may be difficult to detect unexpected fusions, and the fact that MSI information is not provided can be a disadvantage. Assay B is developed for Illumina, a hybrid capture-based method. This method takes longer than the PCR-based enrichment method but is effective for targeting large genomic regions [28]. Furthermore, assay B provides MSI information and can detect unexpected fusions such as EGFR–SEPT14 [24].
We selected actionable potential biomarkers from Nakamura, et al. [15] and Lee, et al. [12], who reported biomarkers currently in clinical trials for solid cancers, including GC. These biomarkers are not only associated with major signaling pathways in various cancer types but also hold therapeutic relevance. They are associated with the phosphoinositide 3-kinase/Akt [29] and epidermal growth factor receptor (EGFR) [30] signaling pathways as therapeutic targets in human cancers. As targets for oncogenic mutations, biomarkers associated with the RAS/RAF/MEK/ERK (MAPK) signaling pathway were included [31]. Preclinical studies have highlighted the potential therapeutic value of targeting cyclin E1 (CCNE1), AT-rich interactive domain-containing protein 1A (ARID1A), and TP53 [32-35].
Both our data and GENIE v11.0-public data in the cBioPortal database (http://cbioportal.org) indicate that TP53 mutations are the most frequent mutations in patients with GC. We detected 11 tier II and five tier III variants in APC, which is more frequently mutated in intestinal-type GC [36]. Of the 14 patients with APC mutations, six patients had no information regarding the histologic type according to the Lauren classification, one patient had a diffuse type, and the remaining seven patients had an intestinal type of GC. This finding may be attributed to the high seroprevalence of Helicobacter pylori in Korea, which is closely related to the incidence of GC in Asia [37]. According to Rahman, et al. [38], the incidence of H. pylori infection is higher in intestinal GC than in diffuse GC.
FGFR2 amplification was the most frequently detected CNV in our study, followed by ERBB2 amplification. FGFR2 amplification can be attributed to specific characteristics of our patient cohort. All of our patients were diagnosed as having advanced or metastatic GC. According to Kim, et al. [39], patients harboring FGFR2 amplification have significantly worse survival. All five patients with FGFR2 amplification in our study were diagnosed as having metastatic GC, emphasizing the association between FGFR2 amplification and advanced disease. Among them, patient No. 9 exhibited the highest FGFR2 copy number (57.2) and had a history of recurrent GC. These findings suggest a potential association between FGFR2 amplification and poor survival outcomes in patients with GC.
This study had several limitations. First, we only used cfDNA data from patients with advanced or metastatic GC, and data from patients with early-stage GC were not included. Moreover, not all cfDNA data could be directly compared with tissue biopsy data. As obtaining tissue biopsies from patients with advanced or metastatic GC is challenging, not all patients could undergo tissue biopsy. Nevertheless, although limited by the retrospective nature of this study, we included data from patients who underwent tissue biopsy in Supplemental Data Table S3 to provide additional insights. Second, we detected significant mutations in 55.6% of patients; however, the data were obtained using two different NGS assays with different gene panels. Direct comparison of the same patients using both assays was not feasible because our laboratory initially used assay A and later transitioned to assay B. Nonetheless, it is worthwhile to share our experience with using two different commercial assays for cfDNA testing considering that each assay uses a different NGS platform. Furthermore, MSI detection is limited to assay B; therefore, MSI status could only be evaluated in the 32 samples tested with assay B. Finally, we could not distinguish between somatic variants and clonal hematopoiesis of indeterminate potential based on our data; however, tier I or II variants with an AF of 40%–60% were subjected to Sanger sequencing to assess whether they were germline or somatic in origin. As shown in Supplemental Data Table S4 and Supplemental Data Fig. S2, we conducted Sanger sequencing on four variants using patients’ PBMCs, which confirmed that they were somatic.
Despite these limitations, our study highlighted the advantages of liquid biopsy. Obtaining tissue samples, especially from patients with advanced or metastatic GC, can be challenging. Even when tissue is obtained, there is a risk of missing certain mutations because of tissue heterogeneity. In our study, notable biomarkers were found in 45 of 81 patients (55.6%), demonstrating the effectiveness of cfDNA analysis. Compared with other genome profiling studies in Korean patients [12], our cfDNA analysis demonstrated the advantage of liquid biopsy. While the VIKTORY trial relied on results from 715 tissue samples, we solely used cfDNA extracted from plasma (Supplemental Data Table S5). The prevalence of TP53 mutation, RAS or PIK3CA mutation/amplification, and MET, FGFR2, EGFR, FGFR1, or CCNE1 amplifications in our study was comparable to that reported by Lee, et al. [12]. Moreover, among the 42 patients who underwent tissue biopsy in our study, 16.7% (7/42) exhibited HER2-positivity (Supplemental Data Table S3). As ctDNA exists at a very low level in cfDNA, there may be some discrepancies between tissue and cfDNA results; however, patient Nos. 8 and 73 showed HER2-positivity in both their tissues and cfDNA samples (Supplemental Data Table S3). Patient Nos. 68 and 76 were unable to undergo tissue biopsy, but their cfDNA analysis revealed ERBB2 amplification (Supplemental Data Table S3), demonstrating the benefits of cfDNA analysis in such cases.
Our study suggests that the genetic profiling of GC can be useful for finding not only novel molecular pathways but also biomarkers that may be targeted by existing therapies effective in other cancer types. We detected an EGFR–SEPT14 fusion that has been reported in glioblastoma, non-small cell lung cancer, and colorectal cancer [24, 40]. This fusion can be a novel target for patients with GC that may be treatable with EGFR tyrosine kinase inhibitors, which is effective in other cancer types [24].
Our study provided insights into the strengths and weaknesses of two cfDNA assays using different NGS platforms for use in patients with GC. Our research can help clinicians and researchers make better-informed decisions about which method may be best suited for their particular needs and goals. Furthermore, our research demonstrated the effectiveness of cfDNA analysis in providing oncologists with tumor genetic information to better understand the disease progression and select suitable treatment options for patients with GC.
In conclusion, our findings suggest that cfDNA analysis holds great promise as an alternative for tissue biopsy as a diagnostic tool. Molecular profiles obtained through cfDNA analysis can be translated into therapeutic targets and predictive biomarkers, which may allow for personalized treatment in the future. Our study highlights the immense potential of cfDNA analysis in improving the management of patients with GC.
SUPPLEMENTARY MATERIALS
Supplementary materials can be found via https://doi.org/10.3343/alm.2023.0187
 XML Download