

 PDF
PDF Citation
 Print
Print


INTRODUCTION
Atrial fibrillation (AF) is the most common type of cardiac arrhythmia, and the prevalence and incidence of AF have increased yearly.1) The prevalence of AF was 2.1% in Korean adults ≥65 years.2) AF causes strokes and heart failure and increases the mortality risk. Moreover, a retrospective cohort study using the National Health Insurance Service-National Sample Cohort showed that patients with AF had a 3.7-fold increased risk of all-cause death in the Korean general population.3) Meanwhile, male sex, aging, hypertension, obesity, alcohol, smoking, and physical inactivity are risk factors for AF.4)
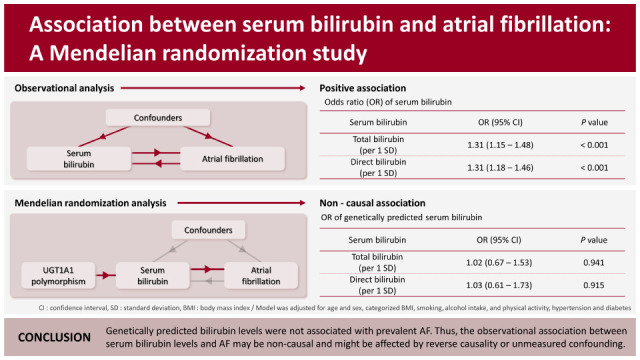
Bilirubin is a bile pigment that is a well-known metabolite of heme catabolism. Bilirubin has antioxidant and anti-inflammatory effects and is inversely associated with the risk for cardiovascular diseases, such as coronary artery disease and stroke.5)6) However, observational studies of the association between bilirubin and AF have shown contradictory results: three studies found an increased risk for AF with high bilirubin levels,7)8)9) whereas a case–control study reported that AF patients have lower bilirubin levels.10) As it is hard to exclude reverse causation and unmeasured confounding in observational studies, the causality between exposure and outcome is difficult to evaluate with an observational study design. Mendelian randomization (MR) analysis, in which a genetic variant is used as an exposure proxy, can overcome the limitations and evaluate the causal association between the exposure and the outcome. As the genotype is randomly allocated at conception and represents lifelong exposure, the results of MR analysis are relatively free from reverse causation and confounding.11) The UDP-glucuronosyltransferase family one member A1 (UGT1A1) is a primary determinant of serum bilirubin levels. In particular, among UGT1A1 variants, rs11891311 and rs4148323 are the single nucleotide polymorphisms (SNPs) that have been most significantly associated with bilirubin levels in previous genome-wide association study (GWAS) in Koreans, and this GWAS study suggested that rs11891311 and rs4148323 accounted for 10.47% of the variation in Koreans.12) Our study evaluated the causal association between serum bilirubin levels and AF using MR analysis.
METHODS
Ethical statement
This study was approved by the Institutional Review Board (IRB) of Chonnam National University Hospital (IRB No. I-2008-05-056). Informed consent was obtained from each participant.
Subjects
The participants of this study were recruited from the Dong-gu Study, which comprises residents of the Dong District, Gwangju, Republic of Korea. Among 9,260 participants aged 50 years or over who participated in the baseline survey conducted from May 2007 to July 2010,13) we excluded 283 participants for the following reasons: 27 individuals without UGT1A1 polymorphisms, 4 with total bilirubin level ≥3.0 mg/dL, 45 without AF measurements, and 207 without information on other covariates. Finally, 8,977 participants were included in the analysis.
Covariates
Smoking and drinking status were divided into three categories: never, former, and current. Alcohol consumption in current drinkers was estimated by using the number of days of drinking alcohol per week and the number of standard glasses of alcohol consumed per day of drinking alcohol. The body mass index (BMI) was calculated using the measured weight and height. It was classified according to the World Health Organization BMI classification into four categories: underweight (<18.5 kg/m2), normal (18.5–24.9 kg/m2), overweight (25.0–29.9 kg/m2), and obese (>30.0 kg/m2).14) We defined physical activity as walking at least five times a week and for >30 minutes each time. Hypertension was defined as systolic blood pressure ≥140 mmHg or diastolic blood pressure ≥90 mmHg or taking antihypertensive medication. Diabetes was defined as fasting glucose ≥126 mg/dL, current use of antidiabetic medication, a previous history of diabetes, or glycosylated hemoglobin ≥6.5%. An automatic analyzer determined Bilirubin levels by enzymatic assay (Hitachi-7600; Hitachi, Tokyo, Japan).
Genotyping
Genomic DNA was extracted from peripheral blood using a QIAamp DNA Blood Mini Kit (Qiagen, Valencia, CA, USA) according to the manufacturer-specified protocol. Genotyping was performed by high-resolution melting (HRM) analysis using a Rotor-Gene 6000™ (Corbett Research, Sydney, Australia). Primers of the polymerase chain reaction (PCR) included: for rs11891311, 5′-GTCAGGATTTGGGGTCTGGT-3′ (forward primer), and 5′-GCAAAGTAATGGTTGCATCTCA-3′ (reverse primer); for rs4148323, 5′-CAGCAGAGGGGACATGAAAT-3′ (forward primer) and 5′-TTGAAGACGTACCCTGTGCC-3′ (reverse primer). The reaction mixture for HRM included 200 nM PCR primer, 1 μM SYTO 9 fluorescent dye (Invitrogen, Carlsbad, CA, USA), 0.5 U prime-Taq polymerase (Genet Bio, Nonsan, Korea), and 40 ng genomic DNA in a 10-μL reaction volume. The PCR process included a 5-minute hold at 95°C, followed by 40 cycles at 95°C for 5 seconds, 60°C for 30 seconds, and 72°C for 10 seconds, with an increase from 70°C to 90°C of 0.1°C per second for melting.
Outcome measures
At the baseline survey, 12-lead electrocardiography using HP-PageWriter 200 M1771A (Hewlett Packard, Andover, MA, USA) was conducted. The recorded electrocardiograms were preliminary analyzed with the Philips 12-lead algorithm; after that, two cardiologists identified potential cases of AF. In addition, participants taking medication for AF or diagnosed with AF through electrocardiography were classified as patients with prevalent AF.
Statistical analyses
The baseline characteristics of participants according to quartiles of serum total bilirubin were presented as mean ± SD or number (%), and these were compared by analysis of variance or the chi-square test. In an observational study, multivariate logistic regression analysis was performed to evaluate the association between serum bilirubin levels and AF after adjusting potential confounders in three models fitted sequentially. In the multivariate analysis, we adjusted for all covariates included in the study characteristics. We then sequentially added demographic variables in the first model, lifestyle factors and BMI categories in the second model, and comorbidities in the final model to further account for potential confounding. The first model adjusted for age and sex, the second model additionally adjusted for smoking, drinking status, current alcohol consumption, and physical activity, and the final model further adjusted for hypertension and diabetes. MR analysis was conducted in two steps. First, a linear regression model was fitted to predict serum bilirubin levels using genotypes rs11891311 and rs4148323 as independent variables.
Each participant’s genetic prediction of serum bilirubin levels was calculated based on their genotypes at rs11891311 and rs4148323. Second, the association between genetically predicted serum bilirubin levels and AF was estimated with a multivariate logistic regression model adjusted for age, sex, categorized BMI, smoking, alcohol intake, physical activity, hypertension, and diabetes. To investigate the effect of liver diseases on the estimated association, sensitivity analysis was performed in participants without hepatitis, liver cancer, and liver cirrhosis. Statistical analyses were performed using STATA version 16.0 (StataCorp, College Station, TX, USA). Statistical significance was defined as p values less than 0.05.
RESULTS
Table 1 presents the characteristics of the participants according to the quartiles of the serum total bilirubin level. The group with the high total bilirubin levels comprised higher proportions of men, former smokers, and current drinkers, as well as those with high physical activity and normal BMI but with a lower prevalence of hypertension and diabetes. Both rs11891311 and rs4148323 satisfied the Hardy–Weinberg equilibrium (p=0.16 and 0.36, respectively) and had minor allele frequencies (MAFs) of 0.13 and 0.19, respectively. The inter-SNP physical distance was approximately 29 kb, and the linkage disequilibrium between them was low (adjusted R2=0.04). The two SNPs accounted for 14.3% and 9.2% of the variation in the total and direct bilirubin levels, respectively. The MAFs of rs11891311 and rs4148323 were 12.5% and 19.0% each, consistent with the previous GWAS study.12)
Table 1
Baseline characteristics of the study population stratified according to quartiles of serum total bilirubin
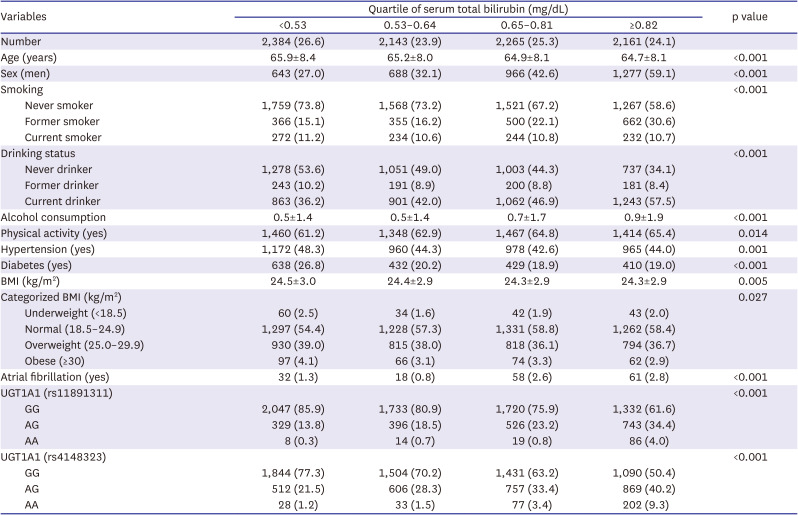
Table 2 presents the association between serum bilirubin levels and AF in the observational analysis by using logistic regression models. After adjusting for age and sex, both total bilirubin (odds ratio [OR], 1.31; 95% confidence interval [CI], 1.16–1.48) and direct bilirubin (OR, 1.32; 95% CI, 1.19–1.47) were associated with the risk for AF, and the association was not attenuated after further adjustment for potential confounders.
Table 2
Association between serum bilirubin and atrial fibrillation in the observational analysis
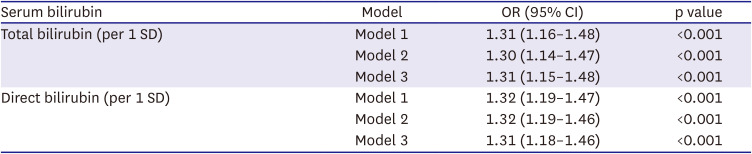
Model 1 was adjusted for age and sex; Model 2 was further adjusted for categorized BMI, smoking, drinking status, alcohol consumption in the current drinker, and physical activity; Model 3 was further adjusted for hypertension and diabetes.
BMI = body mass index, CI = confidence interval, OR = odds ratio, SD = standard deviation.
Table 3 shows the results of the MR analysis. The F-statistics and adjusted R-square of the MR model were 749.97 and 0.14 for total bilirubin and 452.19 and 0.09 for direct bilirubin, respectively. The genetically predicted bilirubin level was not significantly associated with AF in MR analysis (total bilirubin: OR, 1.02; 95% CI, 0.67–1.53; direct bilirubin: OR, 1.03; 95% CI, 0.61–1.73).
Table 3
Association between genetically predicted serum bilirubin and atrial fibrillation
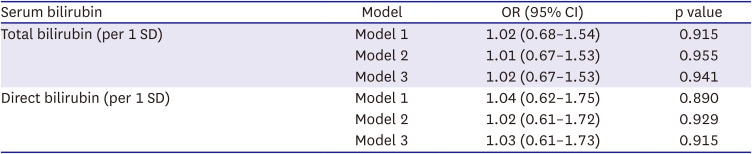
Total bilirubin: F statistics=749.97, adjusted R2=0.143, p<0.001; Direct bilirubin: F statistics=452.19, adjusted R2=0.092, p<0.001.
Model 1 was adjusted for age and sex; Model 2 was further adjusted for categorized body mass index, smoking, drinking status, alcohol consumption in the current drinker, and physical activity; Model 3 was further adjusted for hypertension and diabetes.
CI = confidence interval, OR = odds ratio, SD = standard deviation.
The sensitivity analysis in participants without liver diseases yielded similar results to those in the primary observational and MR analyses.
DISCUSSION
In the present cross-sectional population-based study, we performed observational and MR analysis to evaluate the causal association between bilirubin and AF. In the observational analysis, the serum bilirubin levels were significantly associated with prevalent AF. However, in the MR analysis, genetically predicted bilirubin levels were not significantly associated with AF.
An inverse association between bilirubin and cardiovascular diseases has been previously identified, and the antioxidative and anti-inflammatory effects of bilirubin elucidated the mechanism underlying the association.5)6)15) However, in our observational analysis, high bilirubin levels were positively associated with AF, consistent with several previous studies’ results. In a cross-sectional study of 90,143 Japanese participants who underwent annual regular health check-ups, the AF group showed higher total bilirubin levels than the non-AF group.9) A case–control study revealed higher bilirubin levels in the paroxysmal AF group compared with the non-AF group,7) whereas a study of 437 thyrotoxic patients who were receiving radioactive iodine therapy showed that the AF group had higher bilirubin levels than the non-AF group,8) Moreover, a study of patients with 212 paroxysmal AF after catheter ablation showed that high bilirubin levels are associated with relapse of AF.16) However, in a case–control study, Demir et al.10) presented lower total and direct bilirubin levels in AF patients compared to those in healthy people. The effect of bilirubin levels on AF remains inconclusive in conventional observational studies because the results have been contradictory, and no prospective studies have investigated this association.
Our MR analysis found no significant association between genetically predicted bilirubin levels and AF. The discrepancies between the observational and MR analyses suggest that the association between bilirubin and AF may be non-causal. The observational association between bilirubin levels and AF may be attributable to reverse causality due to AF-induced venous congestion. AF contributes to several adverse hemodynamics, including venous congestion, and may predispose to heart failure.17) Elevated central venous pressure can induce congestive hepatopathy associated with mild hyperbilirubinemia.18) Liver stiffness is associated with AF, and this association could be explained by reverse causality due to AF-induced venous congestion.19)
In MR analysis, three assumptions must be met to use variables as genetic instruments. The first assumption is that the genetic variant is associated with the factor (relevance assumption). If this assumption is not satisfied, a “weak instrument problem,” such as weak statistical power and increased bias due to pleiotropic effects, occurs. The second assumption is that no unknown confounder exists between the genetic variants and the outcome (independence assumption). The third assumption is that genetic variants affect the outcome only through risk factors (exclusion restriction). The first assumption is tested by checking whether the F-statistic exceeds 10, and the F-statistics of the MR regression model for total and direct bilirubin were 749.97 and 452.19, respectively, which indicates no violation of the relevance assumption. The traits associated with the instruments (rs11891311 and rs4148323) were checked at a threshold p<1e-5 in the Phenoscanner V2 to evaluate the independence assumption and exclusion restriction, which is a database with publicly available results from large-scale GWAS.20) Serum bilirubin levels were the only trait significantly associated with genetic instruments. According to the previous study, two SNPs accounted for 10.47% of the variation in Koreans, and the MAFs of those SNPs were about 12.2% and 18.9% each.12) In our study, two SNPs accounted for 14.3% of the variation in the total bilirubin levels, and the MAFs of the two SNPs were 12.5% and 19.0% each. Therefore, the UGT1A1 polymorphisms may be suitable instrumental variables (IV) on bilirubin levels in the present study.
Some limitations of this study need to be acknowledged. Firstly, the study population consists of only Korean participants; therefore, the results of MR analysis may be ethnic-specific, making it difficult to generalize to other people. Secondly, although the IV of our MR analysis is relatively strong, the low prevalence of AF may limit the power of the analysis. According to a previously described method,21) the power of our MR analysis was 32%. Thirdly, we were unable to replicate our findings due to the lack of a validation cohort. However, two SNPs we used showed significant association with bilirubin levels in the general Korean population GWAS, and MAFs observed in our study were consistent with those previously mentioned GWAS.12) Fourthly, since AF was diagnosed based on self-report or by ECG during the baseline survey, some AF cases, including paroxysmal AF, may have been underdiagnosed. Finally, the present study only used two known SNPs. However, analyzing more SNPs associated with bilirubin levels may yield greater explanatory power. Therefore, a more extensive study of the association between all AF cases and bilirubin is needed.
Genetically predicted bilirubin levels based on the rs11891311 and rs4148323 polymorphisms are not associated with prevalent AF. This suggests that the observational association between serum bilirubin levels and AF may be non-causal and is potentially affected by reverse causality or unmeasured confounding.
 XML Download