

 PDF
PDF Citation
 Print
Print


INTRODUCTION
Semantic variant primary progressive aphasia (svPPA)1 is a rare dementing illness in older adults.2 SvPPA presents with progressive loss of conceptual knowledge with relatively preserved episodic memory,3 whereas Alzheimer’s disease (AD) presents with episodic memory deficits followed by progressive impairment in global cognition.4
Although the typical clinical presentations of svPPA and AD differ, differentiating svPPA from AD is not easy, particularly in the early stage, using only the clinical presentations.5 In structural brain imaging, svPPA typically shows asymmetric atrophic changes in the left temporal pole,678 entorhinal cortex (ERC),9 or perirhinal cortex.10 Although AD usually presents with atrophic changes in bilateral medial temporal lobes,11 it is more likely to show asymmetrical atrophy in the early stage.1213 Furthermore, both svPPA and AD show atrophic changes in the amygdala (AMG), hippocampus (HPC), ERC, parahippocampal gyrus (PHG), inferior temporal cortex (ITC), and middle temporal cortex (MTC).79 This indicates that svPPA may not be well differentiated from AD using only volumetric measures.
Texture analysis, which allows quantification of the complex interrelationship between contrasts at the individual voxel level, can capture subtle changes in the gray matter more sensitively than volumetric analysis. We previously demonstrated that, in AD, texture changes preceded volume changes in brain magnetic resonance imaging (MRI).14 Therefore, texture analysis may better classify svPPA, AD, and the controls with normal cognition (NC) than volumetric analysis, particularly in the early stage when the neuronal loss is not prominent. In addition, by simultaneously comparing textural and volumetric changes, we may better understand the differences in the early neurodegenerative changes between svPPA and AD than by comparing volume changes alone.
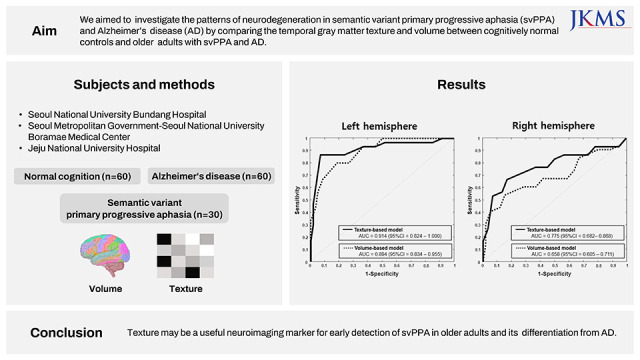
In this study, we compared the textures and volumes of key regions of interest (ROIs) in the temporal lobes between early svPPA, early AD, and NC, and developed models for classifying them.
METHODS
Participants
We enrolled 30 patients with svPPA who visited the dementia clinics of three university hospitals (Seoul National University Bundang Hospital [SNUBH], Seoul Metropolitan Government–Seoul National University Boramae Medical Center [BMC], and Jeju National University Hospital [JNUH]). We enrolled 60 patients with AD from among the visitors to the dementia clinics of SNUBH whose age, sex, education level, and clinical dementia rating (CDR)15 were matched to those of the 30 patients with svPPA. We enrolled 60 controls with NC whose age, sex, and education level were matched to those of the 30 patients with svPPA from the Korean Longitudinal Study on Cognitive Aging and Dementia (KLOSCAD). The KLOSCAD is a nationwide population-based prospective cohort study of older Koreans. In the KLOSCAD, 6,818 community-dwelling Koreans aged ≥ 60 years were randomly sampled from 30 villages and towns across South Korea using residential rosters. The baseline evaluation was conducted in 2010–2012, and follow-up evaluations were conducted every 2 years until 2020.16
Diagnostic evaluation
Geriatric neuropsychiatrists administered standardized diagnostic interviews, including medical histories and physical and neurological examinations, according to the Korean version of the Consortium to Establish a Registry for Alzheimer’s Disease Assessment Packet Clinical Assessment Battery (CERAD-K)17 and the Korean version of the Mini International Neuropsychiatric Interview.18 They also conducted a brain MRI and 18F-Florbetaben positron emission tomography (PET). Research neuropsychologists or trained nurses performed the CERAD-K Neuropsychological Assessment Battery,19 Frontal Assessment Battery,20 Digit Span Test,21 and Geriatric Depression Scale (GDS).22 The CERAD-K Neuropsychological Assessment Battery consists of the verbal fluency test, Boston naming test, Mini-Mental State Examination (MMSE), word list memory test, word list recall test, word list recognition test, constructional praxis test, constructional recall test, and Trail Making Test A/B. We made a payment to SNUPRESS for the CERAD-K Neuropsychological Assessment Battery to clear the copyright.
Subsequently, a panel of geriatric neuropsychiatrists determined the diagnosis and CDR of the participants. They diagnosed svPPA and AD according to the consensus clinical diagnostic criteria for semantic aphasia and associative agnosia proposed by Neary et al.3 and the National Institute of Neurological and Communicative Disorders and Stroke and the Alzheimer’s Disease and Related Disorders Association diagnostic criteria for probable AD, respectively.23 All patients with AD were amyloid-β-positive on 18F-Florbetaben PET. Among the 30 patients with svPPA, 18 were amyloid-β-negative on 18F-Florbetaben PET and the rest did not undergo the procedure. The severity of svPPA and AD in all patients was mild (CDR = 0.5 or 1) and matched. All controls with NC were living independently in the community with a CDR of 0 and amyloid-β-negative on 18F-Florbetaben PET.
MR image acquisition and preprocessing
We obtained three-dimensional (3D) structural T1-weighted spoiled gradient echo MR images of the participants within 2 years of their clinical assessments using a 3.0 T Achieva Scanner (Philips Medical Systems; Eindhoven, Netherlands) at the three national university hospitals. The images were acquired using the following parameters: voxel size of 1.0 × 0.5 × 0.5 mm3, 1.0 mm sagittal slice thickness with no inter-slice gap, echo time of 4.6 ms, repetition time of 8.1 ms, flip angle of 8° and a matrix size of 175 × 240 × 240 in the x, y, and z dimensions in SNUBH; voxel size of 1.0 × 1.0 × 1.0 mm3, 1.0 mm sagittal slice thickness with no inter-slice gap, echo time of 4.6 ms, repetition time of 9.9 ms, flip angle of 8° and a matrix size of 180 × 220 × 200 in the x, y, and z dimensions in BMC; voxel size of 1.0 × 1.0 × 1.0 mm3, 1.0 mm sagittal slice thickness with no inter-slice gap, echo time of 3.7 ms, repetition time of 8.2 ms, flip angle of 8° and a matrix size of 190 × 256 × 256 in the x, y, and z dimensions in JNUH.
We used the original Digital Imaging and Communications in Medicine format images and converted them to the Neuroimaging Informatics Technology Initiative format for analysis using MRIcron software. T1 images were bias-corrected to remove intensity inhomogeneity artifacts using the Statistical Parametric Mapping software (version 8, SPM8; Wellcome Trust Centre for Neuroimaging, London, UK; http://www.fil.ion.ucl.ac.uk/spm). We subsequently resliced the bias-corrected T1 images into isotropic voxels (1.0 × 1.0 × 1.0 mm3). Next, we automatically segmented whole brain structures by recon-all streams of FreeSurfer version 6.0 (http://surfer.nmr.mgh.harvard.edu).24 This is a reconstruction process consisting of three steps. In the first stage, motion correction, non-uniform intensity normalization, and skull stripping are conducted. In the second stage, full-scale volumetric labeling is performed with automatic topology fixing. In the final stage, spherical mapping and cortical parcellation are completed. After the recon-all process, we obtained parcellated individual brain masks of nine ROIs, including the AMG, fusiform gyrus (FFG), HPC, PHG, ERC, temporal polar cortex (TPC), ITC, MTC, and superior temporal cortex (STC), where abnormal proteins commonly accumulate in AD and svPPA.6792526 We also obtained paracentral lobule (PaCL), precentral lobule (PrCL), frontal polar cortex (FPC), orbito frontal cortex (OFC), middle frontal cortex (MFC) and superior frontal cortex (SFC) brain masks, which included to the frontal lobe according to the Desikan-Killiany-Tourville atlas in FreeSurfer.27
Analysis of regional volume and texture
We estimated the regional volume of all ROIs using FreeSurfer software.28 We further preprocessed each ROI image prior to texture analysis as follows: We first conducted histogram normalization by removing any outlier voxels with intensity values beyond the range, μ − 3σ, μ + 3σ (where μ is the mean signal intensity of the gray levels and σ is its standard deviation), to guard against partial volume effects.29 We normalized each gray matter voxel with respect to the participant’s mean cerebrospinal fluid signal intensity in the lateral ventricle regions to correct for any interindividual variations in scaling factors. Finally, we performed quantization in each ROI image, rescaling all signal intensity values to a uniform range of 32 to reduce discrete values, thereby avoiding statistical problems related to sparse matrices during the calculation of texture features.30
We subsequently conducted 3D gray-level co-occurrence matrix (GLCM) analysis to extract texture features (from each preprocessed ROI image using MATLAB R2020a [MathWorks, Natick, MA, USA]). The GLCM is an N × N matrix, where N is the total number of gray levels in the image. Each element (i,j) of the matrix reports the frequency of specific pairs of gray-level values, including the reference voxel i and the neighboring voxel j, which occur at distance d and direction θ. We looked at voxel pairs within a distance of d = 1 of each other (directly adjacent voxels) in 13 different directions, resulting in 13 GLCMs per ROI. Each GLCM is normalized so that the frequency of each voxel pair is divided by the total number of voxels in the ROI. Haralick texture features, which are mathematical equations that utilize the average GLCM as input, are subsequently calculated.313233 We compared the autocorrelation in the allo/periallocortical ROIs (HPC, PHG and ERC) and the contrast in neocortical ROIs (ITC, MTC, STC, FFG and TPC) and AMG between the diagnostic groups, according to our previous work.34
Statistical analysis
Continuous variables were compared using one-way analysis of variance (ANOVA) and categorical variables using chi-square tests between the diagnostic groups. In each ROI, we compared the volume and texture features (autocorrelation or contrast) between the diagnostic groups using ANOVA with Bonferroni posthoc comparisons. Furthermore, we calculated regional z-scores for the AD and svPPA groups. The z-score map indicates the magnitude of volume and texture differences in each clinical group compared with the control group.
We developed texture-based and volume-based models for classifying NC, AD and svPPA using logistic regression with a forward selection of variables. A five-fold cross-validation was used to train and validate the models. We estimated the classification performance of the models using receiver operator characteristic (ROC) curve analysis and compared the area under the ROC curve (AUC) between the models according to Hanley and McNeil.35
A two-tailed P value < 0.05 was considered statistically significant in all analyses. All statistical analyses were performed using the Statistical Package for the Social Sciences (SPSS) version 25.0 (IBM Corporation, Armonk, NY, USA) on Windows and MedCalc for Windows version 18.11.3 (MedCalc Software, Mariakerke, Belgium).
RESULTS
The MMSE and GDS scores of the AD and svPPA groups were comparable but higher than those of the NC group. The estimated total intracranial volumes were comparable among the three diagnostic groups (Table 1).
Table 1
Participant characteristics
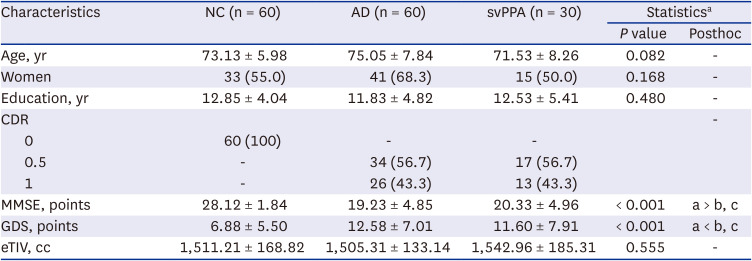
Values are presented as mean ± standard deviation or number (%).
NC = normal cognition, AD = Alzheimer’s disease, svPPA = semantic variant primary progressive aphasia, CDR = Clinical Dementia Rating, MMSE = Mini Mental State Examination, GDS = Geriatric Depression Scale, eTIV = estimated total intracranial volume.
aOne-way analysis of variance for continuous variables and chi-square test for categorical variables with Bonferroni posthoc comparisons.
The volumes and textures of all ROIs differed among the three diagnostic groups (Table 2). Compared with the NC group, both the svPPA and AD groups showed smaller volumes and higher texture values in all ROIs in both hemispheres. The differences in volume and texture values between the svPPA and AD groups were more prominent in the left hemisphere. Compared to the AD group, the svPPA group showed a smaller volume in the bilateral TPC and in three ROIs (ITC, MTC, and STC) in the left hemisphere, and a higher texture value in two ROIs (TPC and ITC) bilaterally and three ROIs (ERC, MTC, and STC) of the left hemisphere. There were significant svPPA-AD differences in the texture values of the left ERC and right ITC where the volumes were comparable between the svPPA and AD groups.
Table 2
Comparison of the regional volumes and textures between controls with NC and patients with AD and svPPA
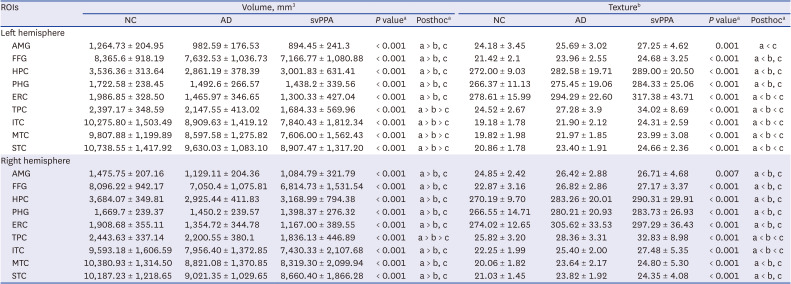
Values are presented as mean ± standard deviation.
ROI = regions of interest, NC = normal cognition, AD = Alzheimer’s disease, svPPA = semantic variant primary progressive aphasia, AMG = amygdala, FFG = fusiform gyrus, HPC = hippocampus, PHG = parahippocampal gyrus, ERC = entorhinal cortex, TPC = temporal polar cortex, ITC = inferior temporal cortex, MTC = middle temporal cortex, STC = superior temporal cortex.
aOne-way analysis of variance with Bonferroni post hoc comparisons.
bAutocorrelation for the hippocampus, parahippocampal gyrus, and entorhinal cortex and contrast for other regions of interest.
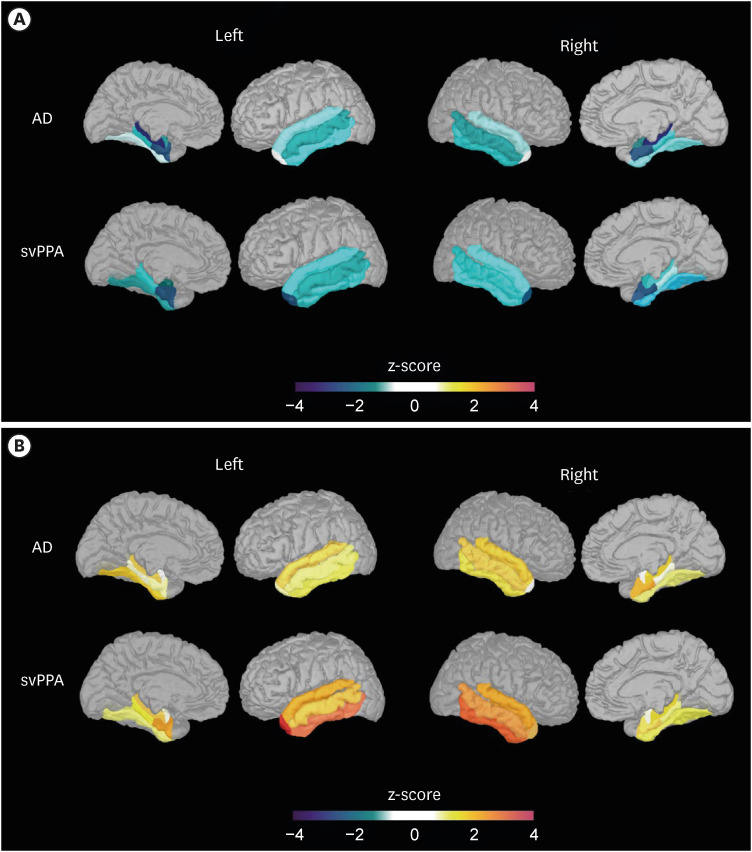
SvPPA and AD showed different patterns of neurodegenerative changes (Fig. 1). In AD, the atrophy was prominent in HPC and ERC, and texture changes were prominent in bilateral STC, in addition to HPC and ERC, indicating that the progression of neurodegeneration in AD may be medial-to-lateral. However, in svPPA, the atrophy was prominent in TPC and ERC, and texture changes were prominent in bilateral ITC, in addition to TPC and ITC, indicating that the progression of neurodegeneration in svPPA may be anterior-to-posterior.
Fig. 1
Z-score map of regional volume and texture changes in the AD and svPPA groups. (A) Regional volume changes in each clinical group compared to the control group. (B) Regional texture changes in each clinical group compared to the control group.
AD = Alzheimer’s disease, svPPA = semantic variant primary progressive aphasia.
As shown in Table 3, the volumes of the left ERC and MTC were most frequently selected in the volume-based model, whereas the texture values of the left ITC, left ERC, and right HPC were most frequently selected in the texture-based model, for classifying svPPA and NC. The mean AUCs of the texture- and volume-based models for classifying svPPA and NC were comparable (mean = 0.914, standard error of the mean [SEM] = 0.046 for the texture-based model; mean = 0.894, SEM = 0.031 for the volume-based model; P = 0.718) (Fig. 2A).
Table 3
Models for differentiating patients with semantic variant primary progressive aphasia patients from controls with NC and patients with AD
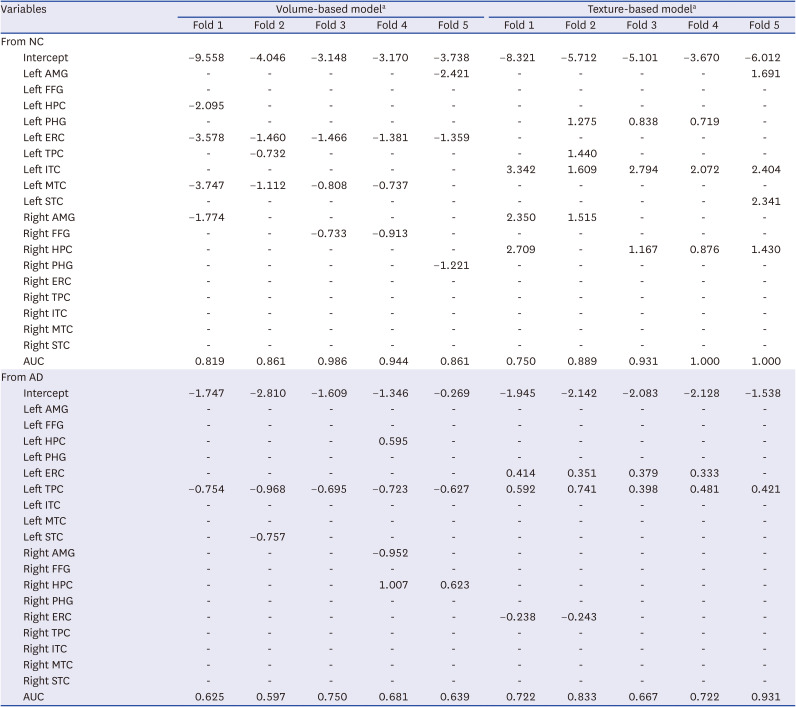
NC = normal cognition, AD = Alzheimer’s disease, AMG = amygdala, FFG = fusiform gyrus, HPC = hippocampus, PHG = parahippocampal gyrus, ERC = entorhinal cortex, TPC = temporal polar cortex, ITC = inferior temporal cortex, MTC = middle temporal cortex, STC = superior temporal cortex, AUC = area under the receiver operating characteristic curve.
aForward selection in logistic regression analysis with five-fold cross-validation.
Fig. 2
Comparison of the performance of the texture- and volume-based models for differentiating patients with semantic variant primary progressive aphasia from cognitively normal controls and patients with AD. (A) Models for differentiating patients with semantic variant primary progressive aphasia from cognitively normal controls. (B) Models for differentiating patients with semantic variant primary progressive aphasia from those with AD.
AUC = area under the receiver operating characteristic curve, CI = confidence interval, AD = Alzheimer’s disease.
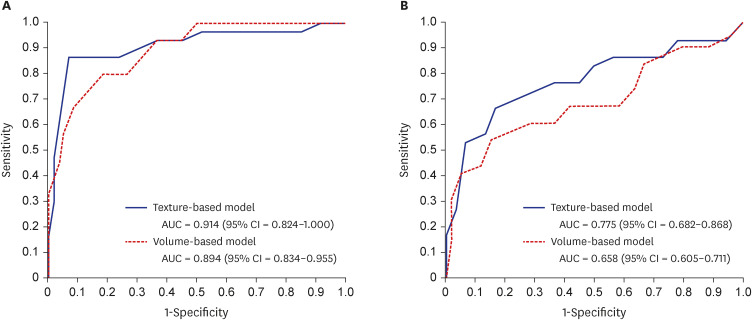
In classifying svPPA and AD, the volume of the left TPC was consistently selected in the volume-based model, whereas the texture values of the left TPC and ERC were most frequently selected in the texture-based model. The mean AUCs of the texture-based model was higher than that of the volume-based model for classifying svPPA and AD (mean = 0.775, SEM = 0.047 for texture-based model; mean = 0.658, SEM = 0.027 for volume-based model; P = 0.031) (Fig. 2B).
Both the AD and svPPA groups showed smaller volumes and higher texture values in several frontal ROIs (FPC, OFC, MFC and SFC) compared with the NC group. However, volumes and texture values were comparable in all frontal ROIs between svPPA and AD (Supplementary Table 1).
DISCUSSION
This study demonstrated that the texture features of the temporal lobe could classify svPPA and NC as accurately as the volume features of the temporal lobe, and svPPA and AD far more accurately than the volume features. To the best of our knowledge, this is the first study to simultaneously compare the volume and texture of the temporal and frontal lobes between NC and patients with AD, and svPPA.
In most previous ROI-based and voxel-based neuroimaging studies on svPPA, atrophy was prominent in or confined to temporal lobes.3637383940 In the current study, both the svPPA and AD groups showed smaller volumes of all ROIs in both hemispheres than NC. This indicates that atrophic changes, although not as prominent as in the ROIs in the left hemisphere, may also be present in those in the right hemisphere in the early stage of svPPA. A previous voxel-based morphometric study also showed that patients with svPPA had smaller AMG, anterior HPC, TPC, anterior FFG, MTC, and posterior insula in both hemispheres than NC.41 In another ROI-based study, patients with svPPA showed a smaller TPC in both hemispheres and smaller AMG, FFG, and ITC in the left hemisphere.7
Although svPPA and AD have degenerative changes in the temporal lobes in common, svPPA shows a different pattern of temporal neurodegeneration from that in AD. As demonstrated in Fig. 1, neurodegenerative changes may progress medio-laterally from the HPC in AD and antero-posteriorly from the TPC in svPPA. These results are consistent with those of the previous studies. In AD, atrophy starts in the HPC before the onset of symptoms and progresses slowly to other temporal structures with disease progression. In contrast, in svPPA, cortical atrophy is most prominent in temporal poles, where atrophy does not usually occur in normal aging, and progresses along the neural pathways connected to temporal poles and progresses faster in the left hemisphere.424344 In a previous study that directly compared the volumes of temporal ROIs between patients with svPPA and AD, patients with svPPA showed smaller AMG, FFG, ITC, and MTC in the left hemisphere and smaller TPC in both hemispheres than in patients with AD.7 Although these results were also in line with those of the current study, the volumes of the left AMG and FFG, which were smaller in svPPA than in AD in the previous study, were comparable between the two groups in the current study. This discrepancy between the findings of the current and previous studies may be attributed to the differences in the participants’ severity of dementia between the studies. The mean CDR of the participants in the previous study was 0.9 ± 0.6, whereas in the current study it was 0.7 ± 0.3, indicating that the severity was milder in the current study than in the previous study. The volumes of the left AMG and FFG were more likely to differ between the svPPA and AD groups with advancing dementia severity. Although temporal atrophy occurs in both hemispheres in svPPA, the interhemispheric asymmetry of temporal atrophy may decrease with advancing severity of svPPA until temporal atrophy in the right hemisphere becomes as severe as that in the left.
In our previous studies, we showed that the textures of the HPC, precuneus, and posterior cingulate cortex predicted the conversion from mild cognitive impairment to AD earlier and with higher accuracy than hippocampal volume,14 and that the textures of T1-weighted MRI reflect microstructural changes associated with regional tau burden.34 A higher contrast indicates a heterogeneous image, which means that neighboring voxels have very different intensities, and a higher autocorrelation reflects the overall brightening of regional signal intensities. Microstructural changes associated with neurofibrillary tangles may selectively increase the signal intensities of voxels in specific layers, possibly because signal intensity may become brighter with the increase in white matter-like tissue that replaces normal gray matter tissue. Therefore, the texture of brain MRI may change in regions where microstructural changes occur because of the accumulation of tau or TDP type C proteins.39454647 In the current study, we clearly demonstrated that patients with svPPA showed higher texture values than NC in all ROIs in both hemispheres, where they showed reduced volumes than NC. In addition, we showed that patients with svPPA had higher texture values than patients with AD in some ROIs, such as the left ERC and right ITC, where regional volumes were comparable. These results suggest that neurodegeneration in these ROIs may begin earlier and/or progress faster in svPPA than in AD.
The accuracy of the logistic regression model for differentiating svPPA from NC using temporal textures was as excellent as that using temporal volumes, indicating that temporal textures may differentiate svPPA from NC as accurately as temporal volumes (Fig. 2A). However, in differentiating svPPA from AD, only the model using temporal textures showed a good accuracy (AUC = 0.775, Fig. 2B). Therefore, NC, AD and svPPA can be better differentiated if the texture features of the temporal lobe are used rather than the volume features.
This study has some limitations. First, this study did not include data on neuropathology. Therefore, this study could not directly show whether the texture differences between the diagnostic groups were attributable to the neuropathologies of svPPA or AD. Second, this study employed a cross-sectional design, and thus could not show whether the texture differences preceded volume differences. Third, the sample size was limited; thus, our classification models need to be validated in future studies.
 XML Download