Journal List > Korean J Anesthesiol > v.76(5) > 1516084244

Oh, Jo, and Song: Propofol-based intravenous anesthesia is associated with improved survival outcomes after major cancer surgery: a nationwide cohort study in South Korea

Abstract

Background

The optimal anesthetic technique for cancer surgery remains a controversial issue. This study aimed to examine whether propofol-based total intravenous anesthesia (TIVA) was associated with survival outcomes after major cancer surgery in South Korea and compare its effectiveness with that of inhalation anesthesia.

Methods

This nationwide population-based cohort study included adult patients who were admitted to the hospital and underwent major cancer surgery between January 1, 2016, and December 31, 2020. The major cancers included lung, gastric, colorectal, esophageal, small bowel, liver, pancreatic, and bile duct or gallbladder cancers.

Results

A total of 253,003 patients who underwent major cancer surgery were included in the analysis. After propensity score (PS) matching, 115,370 patients (57,685 in each group) were included in the final analysis. In the PS-matched cohort, the TIVA group showed 9% (hazard ratio [HR]: 0.91, 95% CI [0.85, 0.98], P = 0.018) and 7% (HR: 0.93, 95% CI [0.89, 0.96], P < 0.001) lower 90-day and one-year mortality rates, respectively, than the inhalation group. In subgroup analyses, the TIVA group showed lower 90-day mortality than the inhalation group in the gastric (HR: 0.86, 95% CI [0.72, 0.97], P = 0.033), colorectal (HR: 0.64, 95% CI [0.56, 0.73], P < 0.001), and pancreatic (HR: 0.76, 95% CI [0.57, 0.94], P = 0.038) cancer surgery groups.

Conclusions

Propofol-based TIVA is associated with better survival outcomes after major cancer surgeries. Moreover, propofol-based TIVA was beneficial in patients who underwent gastric, colorectal, and pancreatic cancer surgeries.

Introduction

Cancer is one of the major causes of death worldwide, and the global burden of cancer is projected to continue to increase in the future [13]. The most common cancer treatment has for a long time been surgery with curative intent [4]. In 2015, 15.2 million new cases of cancer were reported worldwide, over 80% of which required surgery [5]. Thus, the delivery of safe, affordable, and timely cancer surgery is an important health issue for global and national cancer control.
The potential influence of anesthetic technique on oncologic outcomes for patients undergoing cancer surgery has been an ongoing debate [6]. One of the most controversial issues is the effectiveness of propofol-based total intravenous anesthesia (TIVA) compared with that of inhalation anesthesia [7]. The antitumor property of propofol may have protective effects against cancer cell dissemination and the development of metastasis [8,9]. Moreover, propofol is known to attenuate perioperative immunosuppression by preserving the function of natural killer and cytotoxic T cells. However, mixed results have been reported regarding the association of propofol-based TIVA with oncologic outcomes after cancer surgery [1013]. Recently, Yoon et al. [14] reported no association between propofol-based TIVA and long-term survival outcomes in patients who underwent cancer surgeries in a South Korean nationwide setting. Nevertheless, they analyzed data from January 2007 to December 2016 [14]; both surgical and anesthetic techniques have improved since then. Hence, more studies are needed to determine the impact of propofol-based TIVA on oncological outcomes after cancer surgery using recent data.
Therefore, this study aimed to examine whether propofol-based TIVA was associated with survival outcomes after major cancer surgery in South Korea and to compare its effectiveness with that of inhalation anesthesia using data from 2016–2020. We hypothesized that propofol-based TIVA results in lower mortality rates after cancer surgery.

Materials and Methods

Study design and ethical statements

This study included human participants and all procedures were conducted according to the guidelines of the relevant ethics boards. The Institutional Review Board of Seoul National University Bundang Hospital approved the study protocol (No. X-2105-686-904). The National Health Insurance Service (NHIS) provided the relevant data after approval of the study protocol (NHIS-2022-1-336). The requirement for informed consent was waived because this study retrospectively analyzed data from anonymized forms in the South Korean NHIS database. This study was conducted in accordance with the ethical principles of the Helsinki Declaration 2013.

Data source

The data were derived from the South Korean NHIS database. As a single public health insurance system in South Korea, the NHIS database includes data on all disease diagnoses and prescriptions for procedures and drugs. The information on disease diagnoses is to be registered using the International Classification of Diseases 10th Revision (ICD-10) codes for patients to receive financial support from the government. Additionally, the NHIS database contains demographic and socioeconomic status-related information regarding all patients in South Korea.

Inclusion of patients

We initially screened all adult patients who underwent major cancer surgery under general anesthesia between January 1, 2016, and December 31, 2020. The major cancers included lung, gastric, colorectal, esophageal, small bowel, liver, pancreatic, and bile duct or gallbladder cancers. The specific types of major cancer surgeries with procedural codes in South Korea are listed in Supplementary Table 1. There were three exclusion criteria: 1) multiple cases of major cancer surgeries in a patient were excluded to include only the first episode of major cancer surgery; 2) patients who were diagnosed with metastatic cancer (C77-C80 by ICD-10 codes); and 3) pediatric patients (those under 18 years old).

TIVA or inhalation anesthesia

Patients were divided into two groups based on whether TIVA or inhalation anesthesia was used as the anesthetic technique for major cancer surgery. The TIVA group was defined as those who were continuously infused with propofol for anesthesia, while the inhalation group was defined as those who were administered inhalational anesthetics such as sevoflurane, desflurane, or isoflurane. If propofol was injected only once for general anesthesia induction and general anesthesia was maintained using inhalational anesthetics, the patient was considered to belong to the inhalation group. All prescription information of propofol during surgery should be registered in the NHIS database accurately by law because it is designated as an antipsychotic drug. Moreover, the prescription data of sevoflurane, desflurane, and isoflurane should also be registered to receive financial coverage of anesthetic costs from the NHIS database.

Endpoints

The primary endpoint was 90-day mortality that was defined as any death within 90 days of surgery. The secondary endpoint was one-year all-cause mortality that was defined as death due to any cause within one year of cancer surgery. Additionally, we classified the 90-day and one-year mortality as cancer and non-cancer mortality using the database from Statistics Korea. Statistics Korea records the primary causes of all deaths in South Korea classified using ICD-10 codes. If the primary cause of death was cancer (progression, recurrence, metastasis, and/or complications), it is considered cancer mortality by Statistics Korea. This study considered all causes as non-cancer mortality. The exact dates of death were extracted until April 22, 2022.

Covariates

For demographic information, data on sex and age were collected, and for socio-economic status-related information, data regarding employment status, residence, and national household income were collected. The NHIS acquires data on all patients’ household income levels to determine the insurance premiums for the year. Most patients receive approximately 67% of all medical expenses from the government as part of the public insurance program [15]. However, patients who are too poor to pay insurance premiums due to very low household income are enrolled in the Medical Aid Program. The government covers nearly all medical expenses to minimize the financial burden of treatment for patients in the Medical Aid Program. The patients were classified into five groups based on quartile ratios such as Q1–Q4 groups and the Medical Aid Program group. Among places of residence at the time of cancer surgery, Seoul and other metropolitan cities were considered urban areas while all other areas were considered rural areas. To adjust for the capacity of the hospitals where each cancer surgery had been performed, in the statistical analysis, we extracted data on the types of hospitals and annual case volumes of major cancer surgeries. The hospitals were classified as tertiary general hospitals or general hospitals. The annual case volume in each hospital was calculated using the following formula: total cases of major cancer surgeries during 2016–2020 in 5 years. The patients were divided into four groups using quartile ratios based on annual case volumes (Q1 group, < 361 surgeries; Q2 group, 362–758 surgeries, Q3 group, 759–2,718 surgeries, and Q4 group, > 2,718 surgeries). For minimally invasive surgical techniques, data were collected regarding cases in which video-assisted thoracic surgery (VATS) and laparoscopy were utilized. As there was no information on open conversion after surgery using laparoscopy or VATS, open conversion cases after laparoscopic surgery or VATS were classified as laparoscopic surgery or VATS group in this study. Information on intraoperative remifentanil administration and packed red blood cell transfusion as covariates was collected. In addition, information regarding the receipt of neoadjuvant chemotherapy, adjuvant chemotherapy, and adjuvant radiotherapy was collected to reflect the advanced stages of each cancer indirectly. The comorbidity of patients was determined using the Charlson comorbidity index (CCI), calculated based on the ICD-10 codes, as shown in Supplementary Table 2. All individuals with disabilities must be registered in the NHIS database to benefit from South Korea’s social welfare system. In the database, patients with disabilities are divided into six groups according to the severity of the disability. We divided the patients into two severity groups: severe disability (grades 1–3) and mild-to-moderate disability (grades 4–6).

Statistical analysis

The clinicopathological characteristics between the TIVA and inhalation groups are presented as numbers with percentages for categorical variables and mean values with standard deviations for continuous variables. First, 1 : 1 propensity score (PS) matching between the TIVA and inhalation groups was performed to avoid bias in the observational study [16]. The nearest neighbor method without replacement, with a caliper of 0.25, was used for PS matching. The PS model included all covariates, and logistic regression analysis was performed to calculate the PSs. The absolute value of the standardized mean difference (ASD) was used to determine a sufficient balance between the two groups before and after PS matching; subsequently, the ASD was set at < 0.1 to confirm adequate balance between the groups. In the PS-matched cohort, Cox regression analysis was performed to examine the HR with a 95% CI for 90-day and one-year mortality. Second, as a sensitivity analysis, we constructed a multivariable Cox regression model for 90-day and one-year mortality among the entire cohort to examine whether the results in the PS-matched cohort were generalizable in the entire cohort. All covariates were included in the model except for CCI to avoid multicollinearity with individual comorbidities used to calculate the CCI scores. Log-log plots were used to confirm that the central assumption of the Cox proportional hazards model was satisfied. We performed subgroup analyses for 90-day mortality according to the type of cancer surgery to identify whether the association of TIVA was significant for each cancer surgery. Lastly, as the proportion of the TIVA group was dramatically high in 2016, at 39.2%, compared to the rest in the five years, we performed a sensitivity analysis after excluding the 2016 cohort to examine whether there was over-detection in the TIVA group in 2016. All statistical analyses were performed using R software (version 4.0.3, R packages, R Project for Statistical Computing, Austria). P < 0.05 was considered statistically significant.

Results

Study population

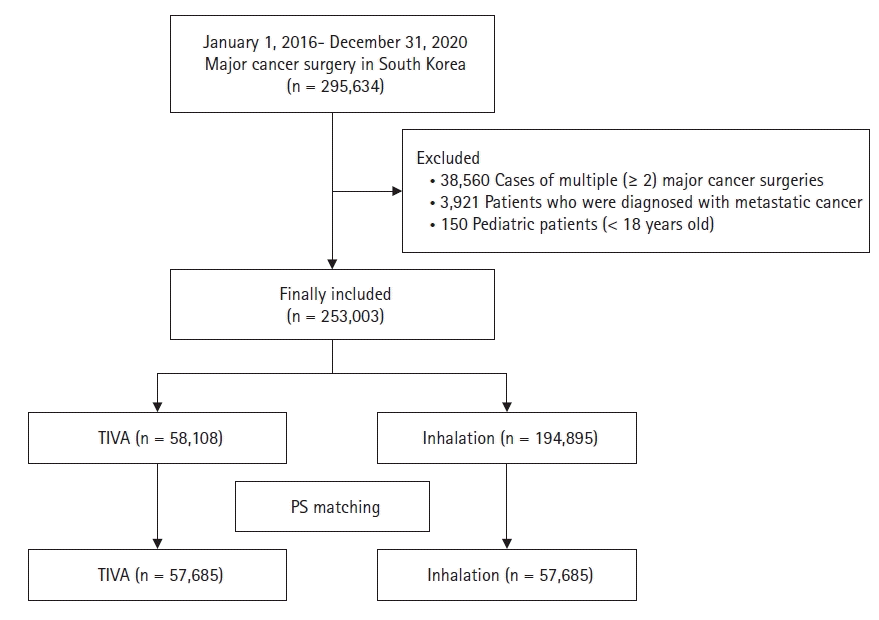
Fig. 1 shows a flowchart depicting the patient selection process. Between January 1, 2016, and December 31, 2020, 295,634 patients underwent major cancer surgery in South Korea. We excluded 38,560 cases of multiple (≥ 2) major cancer surgeries in a patient to focus on the first episode of major cancer surgery, and also excluded 3,921 patients who were diagnosed with metastatic cancer who underwent major cancer surgery. Moreover, 150 pediatric patients (< 18 years old) were excluded from the analysis. Finally, a total of 253,003 patients who underwent major cancer surgery were included in the analysis. Among them, 58,108 (30.0%) were in the TIVA group, while 194,895 (70.0%) were in the inhalation group. No patients were exposed to both TIVA and inhalation anesthesia per the prescription data from the NHIS. After PS matching, 115,370 patients (57,685 in each group) were included in the final analysis. Table 1 shows the results of the comparison of clinicopathological characteristics between the TIVA and inhalation groups before and after PS matching. After PS matching, all ASDs were below 0.1, suggesting an adequate balance through PS matching. Supplementary Fig. 1 shows that the PS distributions became similar through PS matching.

Survival analyses in the PS-matched cohort

Table 2 (Cox regression) and Supplementary Table 3 (Event) show the results of the survival analyses before and after PS matching. In the PS-matched cohort, the TIVA group showed a 9% (HR: 0.91, 95% CI [0.85, 0.98], P = 0.018) lower 90-day mortality than the inhalation group. The TIVA group also showed 6% (HR: 0.94, 95% CI [0.90, 0.98]; P = 0.048) and 21% (HR: 0.79, 95% CI [0.65, 0.95], P = 0.012) lower 90-day cancer and non-cancer mortality, respectively, than the inhalation group. In addition, the TIVA group showed a 7% (HR: 0.93, 95% CI [0.89, 0.97], P < 0.001) lower one-year all-cause mortality than the inhalation group. The TIVA group also showed a 7% (HR: 0.93, 95% CI [0.89, 0.97], P = 0.001) lower one-year cancer mortality than the inhalation group, while one-year non-cancer mortality was not different between the two groups (P = 0.177).

Sensitivity analysis in the entire cohort

Table 3 shows the results of the multivariable Cox regression model for the entire cohort. The TIVA group showed 12% (HR: 0.88, 95% CI [0.83, 0.94], P < 0.001) and 11% (HR: 0.89, 95% CI [0.86, 0.93], P < 0.001) lower 90-day and one-year all-cause mortality, respectively, than the inhalation group. The HRs with 95% CIs of the other covariates are presented in Supplementary Tables 4 and 5, respectively. Supplementary Table 6 shows the results of the multivariable Cox regression model after excluding the 2016 cohort. The TIVA group showed 14% (HR: 0.86, 95% CI [0.79, 0.93], P < 0.001) and 12% (HR: 0.88, 95% CI [0.85, 0.92], P < 0.001) lower 90-day and one-year all-cause mortality, respectively, than the inhalation group.

Subgroup analyses

Table 4 shows the results of the subgroup analyses for 90-day mortality according to cancer surgery type. The TIVA group showed lower 90-day mortality than the inhalation group in the gastric (HR: 0.86, 95% CI [0.72, 0.97], P = 0.033), colorectal (HR: 0.64, 95% CI [0.56, 0.73], P < 0.001), and pancreatic (HR: 0.76, 95% CI [0.57, 0.94], P = 0.038) cancer surgery groups.

Discussion

This nationwide, population-based cohort study showed that propofol-based TIVA was associated with improvements in both 90-day and one-year survival outcomes after major cancer surgery. This association has been applied to both cancer and non-cancer mortality. Moreover, subgroup analyses showed that propofol-based TIVA was beneficial in patients who underwent gastric, colorectal, and pancreatic cancer surgeries.
Unlike previous literature [1012,14,17,18], we divided mortality according to the cause of death, such as cancer and non-cancer mortality. In this study, propofol-based TIVA was associated with lower cancer and non-cancer mortality rates. As an anesthetic agent, propofol has anti-inflammatory properties that may attenuate the inflammatory response during surgery [19,20]. The perioperative inflammatory response is known to be related to postoperative complications [21] that could elevate the risk of non-cancer mortality after cancer surgery. Thus, the anti-inflammatory response induced by propofol may decrease the risk of non-cancer mortality after cancer surgery. Moreover, propofol has antitumor and protective effects against cancer cell dissemination and the development of metastasis [8,9] that may reduce cancer mortality after cancer surgery.
Our results are different from those of a similar study by Yoon et al. [14] that reported no association between propofol-based TIVA and survival outcomes after cancer surgery in a nationwide setting in South Korea from 2007 to 2016. The results from the present study are important for several reasons. First, the application of propofol-based TIVA has increased recently owing to the advances in target-controlled infusion systems [22]. The proportion of patients in the TIVA group in our study was 30%, whereas that in the previous study was 11.8% [14]. Furthermore, surgical techniques have also advanced in recent years [23]. This could affect the outcomes after major cancer surgery. Moreover, we used many covariates, such as VATS or laparoscopy, type of hospital, or annual case volumes of major cancer surgery, neoadjuvant and adjuvant chemotherapy, and radiotherapy, to examine more robust results after PS modeling. Therefore, our results using recent data, with adjustment for many covariates, might be more reliable than those of the previous study [14]. We performed a sensitivity analysis after excluding the 2016 cohort in Table S6, and the results also showed that TIVA was associated with better survival outcomes after major cancer surgery. This is important because the cohort in the sensitivity analysis (2017–2020) did not overlap with that of the study by Yoon et al. [14] that reported results from a nationwide setting in South Korea from 2007 to 2016. Therefore, it might be possible that the recent advances in surgical skills or anesthetic management might affect the differences in results between ours and those of Yoon et al. [14].
Similarly, Makito et al. [13] reported that there was no significant difference in overall and recurrence-free survival between the inhalation group and the TIVA group in patients who underwent digestive tract surgery in the nationwide Japanese cohort study. This study focused on patients who underwent esophagectomy, gastrectomy, hepatectomy, cholecystectomy, pancreatectomy, colectomy, and rectal cancer surgery from July 1, 2010, to March 31, 2018, and PS matching was also used as a statistical method. As the results might be influenced by the collected covariates, type of endpoint, and type of cancer surgeries, more study is needed in the future to clarify this issue.
The results of the subgroup analyses are important because they suggested a potential indication of propofol-based TIVA among various cancer surgeries. Gastric, colorectal, and pancreatic cancer surgeries were influenced by propofol-based TIVA in this study. Previous single-center retrospective studies reported that propofol-based TIVA was associated with better survival outcomes after gastric [24,25], colorectal [17], and pancreatic cancer surgeries [26]. Moreover, a national Danish registry study showed that propofol-based TIVA is associated with better survival outcomes after colorectal cancer surgery [27]. However, other previous studies reported no association between propofol-based TIVA and mortality after gastric and pancreatic cancer surgery [28,29]. Further studies are needed to confirm these findings.
Currently, several prospective clinical trials, such as NCT04316013 (colorectal cancer), NCT03447691 (lung cancer), NCT04601961 (liver cancer), and NCT04259398 (colorectal cancer) have been planned and are recruiting patients to examine the effects of propofol-based TIVA on outcomes after cancer surgery. In the future, prospective clinical trials should be conducted to determine the optimal choice of anesthesia for cancer surgery.
Our study had some limitations. First, some important variables, such as body mass index, cancer type, and duration of anesthesia or surgery were not included in this study because of the lack of this data in the NHIS database. Second, tumor stages among patients with major cancers that could affect mortality after cancer surgery were not evaluated. Third, there might be some residual confounders in this study that might have affected the results of multivariable modeling. Fourth, as we included only major cancer surgery, other surgeries for the common types of cancer, such as thyroid, breast, and prostate cancer, were not included in this study. Fifth, the generalizability of the results of this study may be limited because the environment or health policies for patients with cancer may differ in each country. Lastly, although we excluded patients who were diagnosed with metastatic cancer who underwent major cancer surgery, we could not guarantee that all patients underwent major cancer surgery with curative intent.
In conclusion, propofol-based TIVA is associated with better survival outcomes after major cancer surgery in South Korea. This association has been applied to both cancer and non-cancer mortality. In addition, propofol-based TIVA was beneficial in patients who underwent gastric, colorectal, and pancreatic cancer surgeries.

Notes

Funding

None.

Conflicts of Interest

No potential conflict of interest relevant to this article was reported.

Data Availability

The data that support the findings of this study are available from National Health Insurance System, but restrictions apply to the availability of these data, which were used under licence for the current study and so are not publicly available. Data are, however, available from the authors upon reasonable request and with permission from the National Health Insurance System (https://nhiss.nhis.or.kr/bd/ab/bdaba000eng.do).

Author Contributions

Tak Kyu Oh (Conceptualization; Formal analysis; Methodology; Writing – original draft)

Hayoung Jo (Data curation; Writing – review & editing)

In-Ae Song (Conceptualization; Formal analysis; Methodology; Writing – review & editing)

Supplementary Materials

Supplementary Table 1.
The specific types of major cancer surgeries with procedural codes.
kja-22747-Supplementary-Table-1.pdf
Supplementary Table 2.
The ICD-10 codes used by comorbidity to compute the Charlson comorbidity index.
kja-22747-Supplementary-Table-2.pdf
Supplementary Table 3.
Survival analysis before and after PS matching.
kja-22747-Supplementary-Table-3.pdf
Supplementary Table 4.
The HRs with 95% CIs of the other covariates regarding 90-day mortality.
kja-22747-Supplementary-Table-4.pdf
Supplementary Table 5.
The HRs with 95% CIs of the other covariates regarding 1-year all-cause mortality.
kja-22747-Supplementary-Table-5.pdf
Supplementary Table 6.
Multivariable Cox regression analysis for 90-day mortality after excluding 2016 cohort.
kja-22747-Supplementary-Table-6.pdf
Supplementary Fig. 1.
Distribution of propensity scores before and after propensity score matching.
kja-22747-Supplementary-Fig-1.pdf

References

1. Bray F, Jemal A, Grey N, Ferlay J, Forman D. Global cancer transitions according to the Human Development Index (2008-2030): a population-based study. Lancet Oncol. 2012; 13:790–801.
crossref
2. Foreman KJ, Marquez N, Dolgert A, Fukutaki K, Fullman N, McGaughey M, et al. Forecasting life expectancy, years of life lost, and all-cause and cause-specific mortality for 250 causes of death: reference and alternative scenarios for 2016-40 for 195 countries and territories. Lancet. 2018; 392:2052–90.
crossref
3. Global Burden of Disease 2019 Cancer Collaboration, Kocarnik JM, Compton K, Dean FE, Fu W, Gaw BL, Harvey JD, et al. Cancer incidence, mortality, years of life lost, years lived with disability, and disability-adjusted life years for 29 cancer groups from 2010 to 2019: a systematic analysis for the global burden of disease study 2019. JAMA Oncol. 2022; 8:420–44.
4. Wyld L, Audisio RA, Poston GJ. The evolution of cancer surgery and future perspectives. Nat Rev Clin Oncol. 2015; 12:115–24.
crossref
5. Sullivan R, Alatise OI, Anderson BO, Audisio R, Autier P, Aggarwal A, et al. Global cancer surgery: delivering safe, affordable, and timely cancer surgery. Lancet Oncol. 2015; 16:1193–224.
crossref
6. Alam A, Rampes S, Patel S, Hana Z, Ma D. Anesthetics or anesthetic techniques and cancer surgical outcomes: a possible link. Korean J Anesthesiol. 2021; 74:191–203.
crossref
7. Sessler DI, Riedel B. Anesthesia and cancer recurrence: context for divergent study outcomes. Anesthesiology. 2019; 130:3–5.
8. Jiang S, Liu Y, Huang L, Zhang F, Kang R. Effects of propofol on cancer development and chemotherapy: potential mechanisms. Eur J Pharmacol. 2018; 831:46–51.
crossref
9. Huang H, Benzonana LL, Zhao H, Watts HR, Perry NJ, Bevan C, et al. Prostate cancer cell malignancy via modulation of HIF-1α pathway with isoflurane and propofol alone and in combination. Br J Cancer. 2014; 111:1338–49.
crossref
10. Oh TK, Kim K, Jheon S, Lee J, Do SH, Hwang JW, et al. Long-term oncologic outcomes for patients undergoing volatile versus intravenous anesthesia for non-small cell lung cancer surgery: a retrospective propensity matching analysis. Cancer Control. 2018; 25:1073274818775360.
11. Yoo S, Lee HB, Han W, Noh DY, Park SK, Kim WH, et al. Total intravenous anesthesia versus inhalation anesthesia for breast cancer surgery: a retrospective cohort study. Anesthesiology. 2019; 130:31–40.
crossref
12. Huang YH, Lee MS, Lou YS, Lai HC, Yu JC, Lu CH, et al. Propofol-based total intravenous anesthesia did not improve survival compared to desflurane anesthesia in breast cancer surgery. PLoS One. 2019; 14:e0224728.
crossref
13. Makito K, Matsui H, Fushimi K, Yasunaga H. Volatile versus total intravenous anesthesia for cancer prognosis in patients having digestive cancer surgery. Anesthesiology. 2020; 133:764–73.
14. Yoon S, Jung SY, Kim MS, Yoon D, Cho Y, Jeon Y. Impact of propofol-based total intravenous anesthesia versus inhalation anesthesia on long-term survival after cancer surgery in a nationwide cohort. Ann Surg 2022. Advance Access published on Jul 15, 2022. doi: 10.1097/SLA.0000000000005568.
crossref
15. Song YJ. The South Korean health care system. JMAJ. 2009; 52:206–9.
16. Rosenbaum PR, Rubin DB. The central role of the propensity score in observational studies for causal effects. Biometrika. 1983; 70:41–55.
crossref
17. Wu ZF, Lee MS, Wong CS, Lu CH, Huang YS, Lin KT, et al. Propofol-based total intravenous anesthesia is associated with better survival than desflurane anesthesia in colon cancer surgery. Anesthesiology. 2018; 129:932–41.
crossref
18. Lai HC, Lee MS, Lin KT, Chan SM, Chen JY, Lin YT, et al. Propofol-based total intravenous anesthesia is associated with better survival than desflurane anesthesia in intrahepatic cholangiocarcinoma surgery. Medicine (Baltimore). 2019; 98:e18472.
crossref
19. Roh GU, Song Y, Park J, Ki YM, Han DW. Effects of propofol on the inflammatory response during robot-assisted laparoscopic radical prostatectomy: a prospective randomized controlled study. Sci Rep. 2019; 9:5242.
crossref
20. Cruz FF, Rocco PR, Pelosi P. Anti-inflammatory properties of anesthetic agents. Crit Care. 2017; 21:67.
crossref
21. McSorley ST, Watt DG, Horgan PG, McMillan DC. Postoperative systemic inflammatory response, complication severity, and survival following surgery for colorectal cancer. Ann Surg Oncol. 2016; 23:2832–40.
crossref
22. Egan TD. Total intravenous anesthesia versus inhalation anesthesia: a drug delivery perspective. J Cardiothorac Vasc Anesth. 2015; 29 Suppl 1:S3–6.
crossref
23. Tan Z. Recent advances in the surgical treatment of advanced gastric cancer: a review. Med Sci Monit. 2019; 25:3537–41.
crossref
24. Wu WW, Zhang WH, Zhang WY, Liu K, Chen XZ, Zhou ZG, et al. The long-term survival outcomes of gastric cancer patients with total intravenous anesthesia or inhalation anesthesia: a single-center retrospective cohort study. BMC Cancer. 2021; 21:1193.
crossref
25. Zheng X, Wang Y, Dong L, Zhao S, Wang L, Chen H, et al. Effects of propofol-based total intravenous anesthesia on gastric cancer: a retrospective study. Onco Targets Ther. 2018; 11:1141–8.
crossref
26. Lai HC, Lee MS, Liu YT, Lin KT, Hung KC, Chen JY, et al. Propofol-based intravenous anesthesia is associated with better survival than desflurane anesthesia in pancreatic cancer surgery. PLoS One. 2020; 15:e0233598.
crossref
27. Hasselager RP, Hallas J, Gogenur I. Inhalation or total intravenous anaesthesia and recurrence after colorectal cancer surgery: a propensity score matched Danish registry-based study. Br J Anaesth. 2021; 126:921–30.
crossref
28. Oh TK, Kim HH, Jeon YT. Retrospective analysis of 1-year mortality after gastric cancer surgery: Total intravenous anesthesia versus volatile anesthesia. Acta Anaesthesiol Scand. 2019; 63:1169–77.
crossref
29. Ren J, Wang J, Chen J, Ma Y, Yang Y, Wei M, et al. The outcome of intravenous and inhalation anesthesia after pancreatic cancer resection: a retrospective study. BMC Anesthesiol. 2022; 22:169.
crossref

Fig. 1.
Flow chart depicting the patient selection process. TIVA: total intravenous anesthesia.
kja-22747f1.tif
Table 1.
Comparison of Clinicopathological Characteristics between the TIVA and Inhalation Groups before and after PS Matching
Variable Total cohort (n = 253,003) ASD PS-matched cohort (n = 115,370) ASD
TIVA (n = 58,108) Inhalation (n = 194,895) TIVA (n = 57,685) Inhalation (n = 57,685)
Age (yr) 65.5 (11.4) 66.1 (11.6) 0.052 65.5 (11.4) 65.6 (11.4) 0.001
Sex (M) 36,593 (63.0) 122,919 (63.1) 0.002 21,382 (37.1) 21,408 (37.1) < 0.001
Having a job at surgery 35,606 (61.3) 120,169 (61.7) 0.086 35,336 (61.3) 35,460 (61.5) 0.004
Residence at surgery
 Urban area 24,517 (42.2) 81,579 (41.9) 24,362 (42.2) 24,185 (41.9)
 Rural area 31,266 (53.8) 108,792 (55.8) 0.040 31,027 (53.8) 31,075 (53.9) 0.002
 Unknown 2,325 (4.0) 4,524 (2.3) 0.086 2,296 (4.0) 2,425 (4.2) 0.011
Household income level
 Medical aid program 2,561 (4.4) 10,231 (5.2) 9,457 (16.4) 9,491 (16.5)
 Q1 9,525 (16.4) 34,049 (17.5) 0.041 9,346 (16.2) 9,320 (16.2) 0.001
 Q2 9,418 (16.2) 33,502 (17.2) 0.027 12,771 (22.1) 12,720 (22.1) 0.002
 Q3 12,874 (16.2) 43,418 (22.3) 0.003 20,467 (35.5) 20,378 (35.3) 0.003
 Q4 20,604 (22.2) 66,358 (34.0) 0.030 2,553 (4.4) 2,527 (4.4) 0.002
 Unknown 3,126 (5.4) 7,337 (3.8) 0.072 3,097 (5.4) 3,249 (5.6) 0.012
Type of cancer surgery
 Lung cancer surgery 17,283 (29.7) 36,813 (18.9) 17,123 (29.7) 17,143 (29.7)
 Gastric cancer surgery 17,390 (29.9) 59,130 (30.3) 0.009 17,215 (29.8) 17,450 (30.3) 0.009
 Colorectal cancer surgery 10,970 (18.9) 36,306 (18.6) 0.006 10,912 (18.9) 11,118 (19.3) 0.009
 Esophageal cancer surgery 1,020 (1.8) 2,991 (1.5) 0.017 997 (1.7) 1,042 (1.8) 0.006
 Small bowel cancer surgery 1,105 (1.9) 6,229 (3.2) 0.095 1,104 (1.9) 1,069 (1.9) 0.004
 Liver cancer surgery 4,331 (7.5) 22,107 (11.3) 0.148 4,329 (7.5) 4,115 (7.1) 0.014
 Pancreatic cancer surgery 2,447 (4.2) 14,151 (7.3) 0.152 2,447 (4.2) 2,288 (4.0) 0.013
 BD or GB cancer surgery 3,562 (6.1) 17,168 (8.8) 0.112 3,558 (6.2) 3,460 (6.0) 0.007
VATS or laparoscopy 36,911 (63.5) 123,243 (63.2) 0.006 36,751 (63.7) 36,961 (64.1) 0.008
Intraoperative remifentanil infusion 48,799 (84.0) 153,068 (78.5) 0.148 48,411 (83.9) 49,076 (85.1) 0.031
Neoadjuvant chemotherapy 2,154 (3.7) 9,355 (4.8) 0.058 2,147 (3.7) 2,219 (3.8) 0.007
Adjuvant chemotherapy 13,160 (22.6) 43,734 (22.4) 0.005 13,069 (22.7) 12,920 (22.4) 0.006
Adjuvant radiotherapy 64 (0.1) 220 (0.1) < 0.001 64 (0.1) 67 (0.1) 0.002
Intraoperative pRBC transfusion 9,375 (16.1) 42,265 (21.7) 0.151 9,361 (16.2) 9,293 (16.1) 0.003
Type of hospital
 Tertiary general hospital 57,087 (98.2) 193,352 (99.2) 56,686 (98.3) 56,894 (98.6)
 General hospital 1,021 (1.8) 1,543 (0.8) 0.074 999 (1.7) 791 (1.4) 0.027
Annual case volumes of major cancer surgery
 Q1 < 361 12,440 (21.4) 50,158 (25.7) 12,396 (21.5) 11,914 (20.7)
 Q2: 362–758 11,390 (19.6) 52,770 (27.1) 0.188 11,380 (19.7) 11,530 (20.0) 0.007
 Q3: 759–2,718 16,495 (28.4) 45,109 (23.1) 0.116 16,358 (28.4) 16,558 (28.7) 0.008
 Q4 > 2,718 17,783 (30.6) 46,858 (24.0) 0.142 17,551 (30.4) 17,683 (30.7) 0.005
Disability at surgery
 Mild to moderate 5,173 (8.9) 18,816 (9.7) 0.026 5,139 (8.9) 5,100 (8.8) 0.002
 Severe 1,442 (2.5) 4,919 (2.5) 0.003 1,432 (2.5) 1,369 (2.4) 0.007
CCI, point 5.0 (2.7) 4.8 (2.6) 0.079 4.8 (2.6) 4.8 (2.6) 0.001
 Myocardial infarction 1,123 (1.9) 4,489 (2.3) 0.027 1,109 (1.9) 1,099 (1.9) 0.001
 Congestive heart failure 5,244 (9.0) 19,308 (9.9) 0.031 5,222 (9.1) 5,129 (8.9) 0.006
 Peripheral vascular disease 6,017 (10.4) 20,418 (10.5) 0.004 5,985 (10.4) 6,035 (10.5) 0.003
 Cerebrovascular disease 4,451 (7.7) 15,355 (7.9) 0.008 4,418 (7.7) 4,450 (7.7) 0.002
 Dementia 1,825 (3.1) 6,920 (3.6) 0.024 1,813 (3.1) 1,829 (3.2) 0.002
 Chronic pulmonary disease 19,729 (34.0) 66,344 (34.0) 0.002 19,586 (34.0) 19,379 (33.6) 0.008
 Rheumatic disease 2,099 (3.6) 7,215 (3.7) 0.005 2,087 (3.6) 2,083 (3.6) < 0.001
 Peptic ulcer disease 23,094 (39.7) 73,839 (37.9) 0.038 22,891 (39.7) 22,685 (39.3) 0.007
 Mild liver disease 18,900 (32.5) 65,569 (33.6) 0.024 18,772 (32.5) 18,487 (32.0) 0.011
 DM without chronic complication 12,812 (22.0) 44,255 (22.7) 0.016 12,716 (22.0) 12,689 (22.0) 0.001
 DM with chronic complication 3,449 (5.9) 13,958 (7.2) 0.052 3,434 (6.0) 3,432 (5.9) < 0.001
 Hemiplegia or paraplegia 383 (0.7) 1,390 (0.7) 0.007 380 (0.7) 401 (0.7) 0.005
 Renal disease 1,399 (2.4) 5,585 (2.9) 0.030 1,396 (2.4) 1,417 (2.5) 0.002
 Moderate or severe liver disease 498 (0.9) 2,477 (1.3) 0.045 495 (0.9) 463 (0.8) 0.006
 AIDS 39 (0.1) 189 (0.1) 0.012 39 (0.1) 32 (0.1) 0.005
Year of surgery
 2016 22,754 (39.2) 27,147 (13.9) 22,332 (38.7) 20,151 (34.9)
 2017 8,902 (15.3) 41,021 (21.0) 0.159 8,901 (15.4) 9,290 (16.1) 0.019
 2018 8,446 (14.5) 41,957 (21.5) 0.198 8,446 (14.6) 8,923 (15.5) 0.024
 2019 9,188 (15.8) 42,735 (21.9) 0.168 9,188 (15.9) 9,663 (16.8) 0.023
 2020 8,818 (15.2) 42,035 (21.6) 0.178 8,818 (15.3) 9,658 (16.7) 0.040

TIVA: total intravenous anesthesia, PS: propensity score, ASD: absolute value of the standardized mean difference, BD: bile duct, GB: gall bladder, VATS: video-assisted thoracic surgery, pRBC: packed red blood cell, CCI: Charlson comorbidity index, DM: diabetes mellitus, AIDS: acquired immunodeficiency syndrome.

Table 2.
Survival Analyses before and after PS Matching
Survival outcomes HR (95% CI) P value
Before PS matching
 90-day mortality
  TIVA (vs. inhalation group) 0.75 (0.70, 0.79) < 0.001
 90-day cancer mortality
  TIVA (vs. inhalation group) 0.77 (0.72, 0.82) < 0.001
 90-day non-cancer mortality
  TIVA (vs. inhalation group) 0.64 (0.55, 0.75) < 0.001
 One-year all-cause mortality
  TIVA (vs. inhalation group) 0.77 (0.75, 0.80) < 0.001
 One-year cancer mortality
  TIVA (vs. inhalation group) 0.80 (0.77, 0.83) < 0.001
 One-year non-cancer mortality
  TIVA (vs. inhalation group) 0.69 (0.64, 0.74) < 0.001
After PS matching
 90-day mortality
  TIVA (vs. inhalation group) 0.91 (0.85, 0.98) 0.018
 90-day cancer mortality
  TIVA (vs. inhalation group) 0.94 (0.90, 0.98) 0.048
 90-day non-cancer mortality
  TIVA (vs. inhalation group) 0.79 (0.65, 0.95) 0.012
 One-year all-cause mortality
  TIVA (vs. inhalation group) 0.93 (0.89, 0.97) < 0.001
 One-year cancer mortality
  TIVA (vs. inhalation group) 0.93 (0.89, 0.97) 0.001
 One-year non-cancer mortality
  TIVA (vs. inhalation group) 0.94 (0.85, 1.03) 0.177

PS: propensity score, HR: hazard ratio, TIVA: total intravenous anesthesia.

Table 3.
Multivariable Cox Regression Analysis among the Entire Cohort
Variable HR (95% CI) P value
90-day mortality
 TIVA (vs. inhalation) 0.88 (0.83, 0.94) < 0.001
90-day cancer mortality
 TIVA (vs. inhalation) 0.90 (0.84, 0.96) 0.003
90-day non-cancer mortality
 TIVA (vs. inhalation) 0.82 (0.69, 0.96) 0.015
One-year all-cause mortality
 TIVA (vs. inhalation) 0.89 (0.86, 0.93) < 0.001
One-year cancer mortality
 TIVA (vs. inhalation) 0.89 (0.85, 0.92) < 0.001
One-year non-cancer mortality
 TIVA (vs. inhalation) 0.92 (0.85, 0.99) 0.033

HR: hazard ratio, TIVA: total intravenous anesthesia.

Table 4.
Subgroup Analysis for 90-day Mortality
Type of cancer surgery HR (95% CI) P value
Lung cancer surgery
 TIVA (vs. inhalation) 1.04 (0.91, 1.20) 0.562
Gastric cancer surgery
 TIVA (vs. inhalation) 0.86 (0.72, 0.97) 0.033
Colorectal cancer surgery
 TIVA (vs. inhalation) 0.64 (0.56, 0.73) < 0.001
Esophageal cancer surgery
 TIVA (vs. inhalation) 1.08 (0.76, 1.54) 0.658
Small bowel cancer surgery
 TIVA (vs. inhalation) 0.97 (0.78, 1.21) 0.779
Liver cancer surgery
 TIVA (vs. inhalation) 0.99 (0.79, 1.27) 0.926
Pancreatic cancer surgery
 TIVA (vs. inhalation) 0.76 (0.57, 0.94) 0.038
BD or GB cancer surgery
 TIVA (vs. inhalation) 1.03 (0.82, 1.28) 0.814

HR: hazard ratio, TIVA: total intravenous anesthesia, BD: bile duct, GB: gall bladder.

TOOLS
Similar articles