Introduction
Methods
Study design, settings, and participants
Study groups, data elements, exposures, and interventions
Outcome measures
Statistical analysis
Results
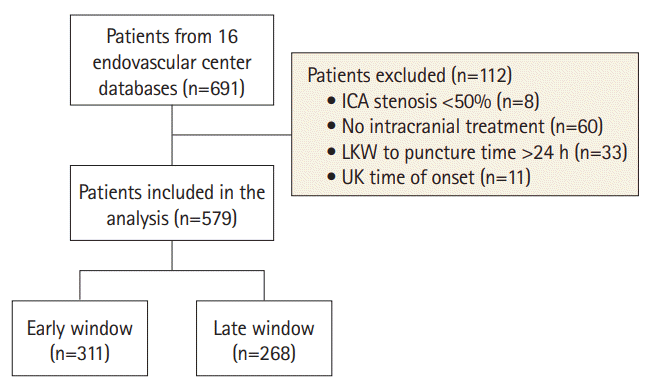
Figure 1.

Table 1.
| Total (n=579) | Early window (n=311) | Late window (n=268) | P | ||
|---|---|---|---|---|---|
| Age, median (IQR) | 68 (59–76) | 68 (59–77) | 68 (60–76) | 0.774 | |
| Female sex | 186 (32.1) | 102 (32.8) | 84 (31.3) | 0.709 | |
| Race/ethnics | 0.504 | ||||
| White | 370 (64.2) | 192 (61.7) | 178 (67.2) | ||
| Hispanic | 107 (18.6) | 64 (20.6) | 43 (16.2) | ||
| Black | 38 (6.6) | 20 (6.4) | 18 (6.8) | ||
| Asian | 16 (2.8) | 10 (3.2) | 6 (2.3) | ||
| Other | 43 (7.5) | 23 (7.4) | 20 (7.5) | ||
| Hypertension | 415 (72.4) | 219 (71.3) | 196 (73.7) | 0.530 | |
| Hyperlipidemia | 258 (45.1) | 136 (44.3) | 122 (46.0) | 0.677 | |
| Diabetes mellitus | 157 (27.4) | 88 (28.8) | 69 (25.9) | 0.451 | |
| Atrial fibrillation | 81 (14.1) | 43 (14.0) | 38 (14.3) | 0.924 | |
| Smoking status | 0.433 | ||||
| Former | 130 (22.8) | 69 (22.6) | 61 (23.1) | ||
| Current | 140 (24.6) | 69 (22.6) | 71 (26.9) | ||
| Coronary artery disease | 102 (17.8) | 56 (18.2) | 46 (17.2) | 0.752 | |
| Previous stroke/TIA | 88 (15.3) | 49 (15.9) | 39 (14.7) | 0.705 | |
| Previous treatment with antiplatelets | 191 (34) | 103 (34.3) | 88 (33.7) | 0.878 | |
| Previous treatment with statins | 160 (28.7) | 86 (28.7) | 74 (28.8) | 0.974 | |
| Glucose at admission, median (IQR) | 125 (107–153) | 124 (106–154) | 125 (108–153) | 0.662 | |
| Initial NIHSS, median (IQR) | 16 (12–20) | 17 (13–21) | 16 (10–20) | 0.013 | |
| IV-tPA treatment | 265 (45.8) | 215 (69.1) | 50 (18.7) | <0.001 | |
| ASPECTS, median (IQR) | 8 (7–9) | 9 (7–10) | 8 (7–9) | <0.001 | |
| Periprocedural antiplatelets regimens | 0.230 | ||||
| No antiplatelets | 123 (21.2) | 69 (22.2) | 54 (20.1) | ||
| Single oral antiplatelets | 123 (21.2) | 60 (19.3) | 63 (23.5) | ||
| Dual oral antiplatelets | 159 (27.5) | 98 (31.5) | 61 (22.8) | ||
| Cangrelor | 17 (2.9) | 9 (2.9) | 8 (3.0) | ||
| GP IIA/IIIB inhibitors | 157 (27.2) | 75 (24.1) | 82 (30.6) | ||
| Cervical ICA stenosis | 0.155 | ||||
| 50%–69% | 25 (5.0) | 16 (6.1) | 9 (3.7) | ||
| 70%–89% | 86 (17.1) | 44 (16.8) | 42 (17.4) | ||
| 90%–99% | 130 (25.8) | 76 (29.0) | 54 (22.4) | ||
| 100% | 262 (52.1) | 126 (48.1) | 136 (56.4) | ||
| Timing of extracranial ICA | 0.085 | ||||
| Anterograde | 256 (46.5) | 128 (43.4) | 128 (50.0) | ||
| Retrograde | 214 (38.8) | 124 (42.0) | 90 (35.2) | ||
| Not initially treated | 81 (14.7) | 43 (14.6) | 38 (14.8) | ||
| Stenting of extracranial ICA | 332 (59.7) | 181 (61.1) | 151 (58.1) | 0.461 | |
| ICA occlusion etiology | 0.292 | ||||
| Atherosclerosis | 451 (78.2) | 235 (75.8) | 216 (80.9) | ||
| Dissection | 58 (10.1) | 36 (11.6) | 22 (8.2) | ||
| Other* | 68 (11.8) | 39 (12.6) | 29 (10.9) | ||
| Occluded intracranial vessel | 0.357 | ||||
| ICA | 96 (27.4) | 45 (24.7) | 51 (30.4) | ||
| MCA-M1 | 205 (58.6) | 108 (59.3) | 97 (57.7) | ||
| MCA-M2 | 49 (14.0) | 29 (15.9) | 20 (11.9) | ||
| IA-tPA treatment | 25 (4.5) | 15 (4.9) | 10 (3.9) | 0.557 | |
| IV heparin | 205 (36.7) | 103 (34.6) | 102 (39.1) | 0.269 | |
| Type of anesthesia | 0.634 | ||||
| MAC | 356 (61.5) | 194 (62.4) | 162 (60.4) | ||
| General | 223 (38.5) | 117 (37.6) | 106 (39.6) | ||
| Perfusion imaging† | 297 (56.7) | 119 (43.0) | 178 (72.1) | <0.001 | |
| Core infarct volume (mL) (CBF<30% or DWI), mean±SD | 24.3±34.3 | 25.3±40.4 | 23.5±28.9 | 0.707 | |
| Time metrics (min), median (IQR) | |||||
| LKW to arterial puncture | 340 (202–614) | 212 (156–278 | 655 (473–896) | <0.001 | |
| Door to arterial puncture | 65 (30–105) | 61 (27–100) | 69 (30–119) | 0.109 | |
| Arterial puncture to reperfusion | 57 (37–83) | 53 (36–80) | 58 (38–87) | 0.174 | |
Data are presented as n (%) unless otherwise indicated.
IQR, interquartile range; TIA, transient ischemic attack; NIHSS, National Institutes of Health Stroke Scale; IV-tPA, intravenous tissue plasminogen activator; ASPECTS, Alberta Stroke Program Early Computed Tomography Score; GP, glycoprotein; ICA, internal carotid artery; MCA-M1, medial cerebral artery–segment 1; MCA-M2, medial cerebral artery–segment 2; IA-tPA, intraarterial tissue plasminogen activator; MAC, monitored anesthesia care; CBF, cerebral blood flow; DWI, diffusion-weighted imaging; SD, standard deviation; LKW, last known well; ESUS, embolic stroke of undetermined source; CEA, carotid endarterectomy.
Clinical outcomes
Figure 2.

Safety outcomes
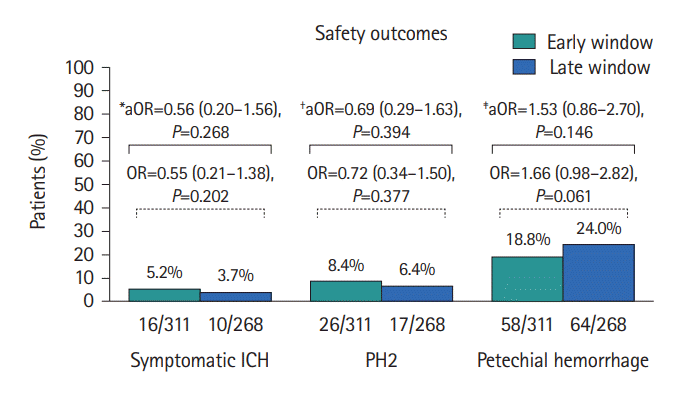
Figure 3.

Secondary outcomes
Table 2.
| Total | Early window | Late window |
Unadjusted analysis |
Adjusted analysis |
||||
|---|---|---|---|---|---|---|---|---|
| OR (95% CI) | P | aOR (95% CI) | P | |||||
| Secondary efficacy outcomes | ||||||||
| Good mTICI (2b-3) | 505 (87.5) | 275 (88.7) | 230 (86.1) | 1.06 (0.46–2.40) | 0.895 | 1.01 (0.36–2.89)* | 0.978 | |
| First pass effect | 331 (59.2) | 184 (60.9) | 147 (57.2) | 0.58 (0.33–1.00) | 0.052 | 0.92 (0.43–1.99)† | 0.834 | |
| Early neurological improvement | 234 (40.8) | 135 (43.7) | 99 (37.4) | 0.72 (0.41–1.26) | 0.244 | 0.77 (0.39–1.54)‡ | 0.460 | |
| Secondary safety outcomes | ||||||||
| In-hospital mortality | 58 (10.3) | 30 (9.9) | 28 (10.7) | 1.69 (0.71–4.04) | 0.239 | 2.65 (0.87–8.04)§ | 0.085 | |
| Mortality at 90 days | 91 (17.5) | 44 (15.7) | 47 (19.5) | 1.66 (0.82–3.37) | 0.160 | 3.06 (0.91–10.32)ǁ | 0.071 | |
Data are presented as n (%) unless otherwise indicated.
OR, odds ratio; aOR, adjusted odds ratio; CI, confidence interval; mTICI, modified Thrombolysis in Cerebral Infarction; NIHSS, National Institutes of Health Stroke Scale; ASPECTS, Alberta Stroke Program Early Computed Tomography Score; sICH, symptomatic intracranial hemorrhage; IV-tPA, intravenous tissue plasminogen activator; ICA, internal carotid artery; CAD, coronary artery disease.
* Age, hypertension, diabetes mellitus, initial NIHSS, direct to angiosuite, ASPECTS, sICH, and first pass effect;
† Age, hypertension, atrial fibrillation, IV-tPA, ICA occlusion etiology, mTICI 2b-3 and ICA treatment timing;


 PDF
PDF Citation
 Print
Print


 XML Download