Abstract
Background
Methods
Results
SUPPLEMENTARY MATERIALS
Supplementary Table 1.
Supplementary Table 2.
Supplementary Table 3.
Supplementary Table 4.
Supplementary Fig. 1.
Supplementary Fig. 2.
Supplementary Fig. 3.
Supplementary Fig. 4.
Supplementary Fig. 5.
Notes
REFERENCES
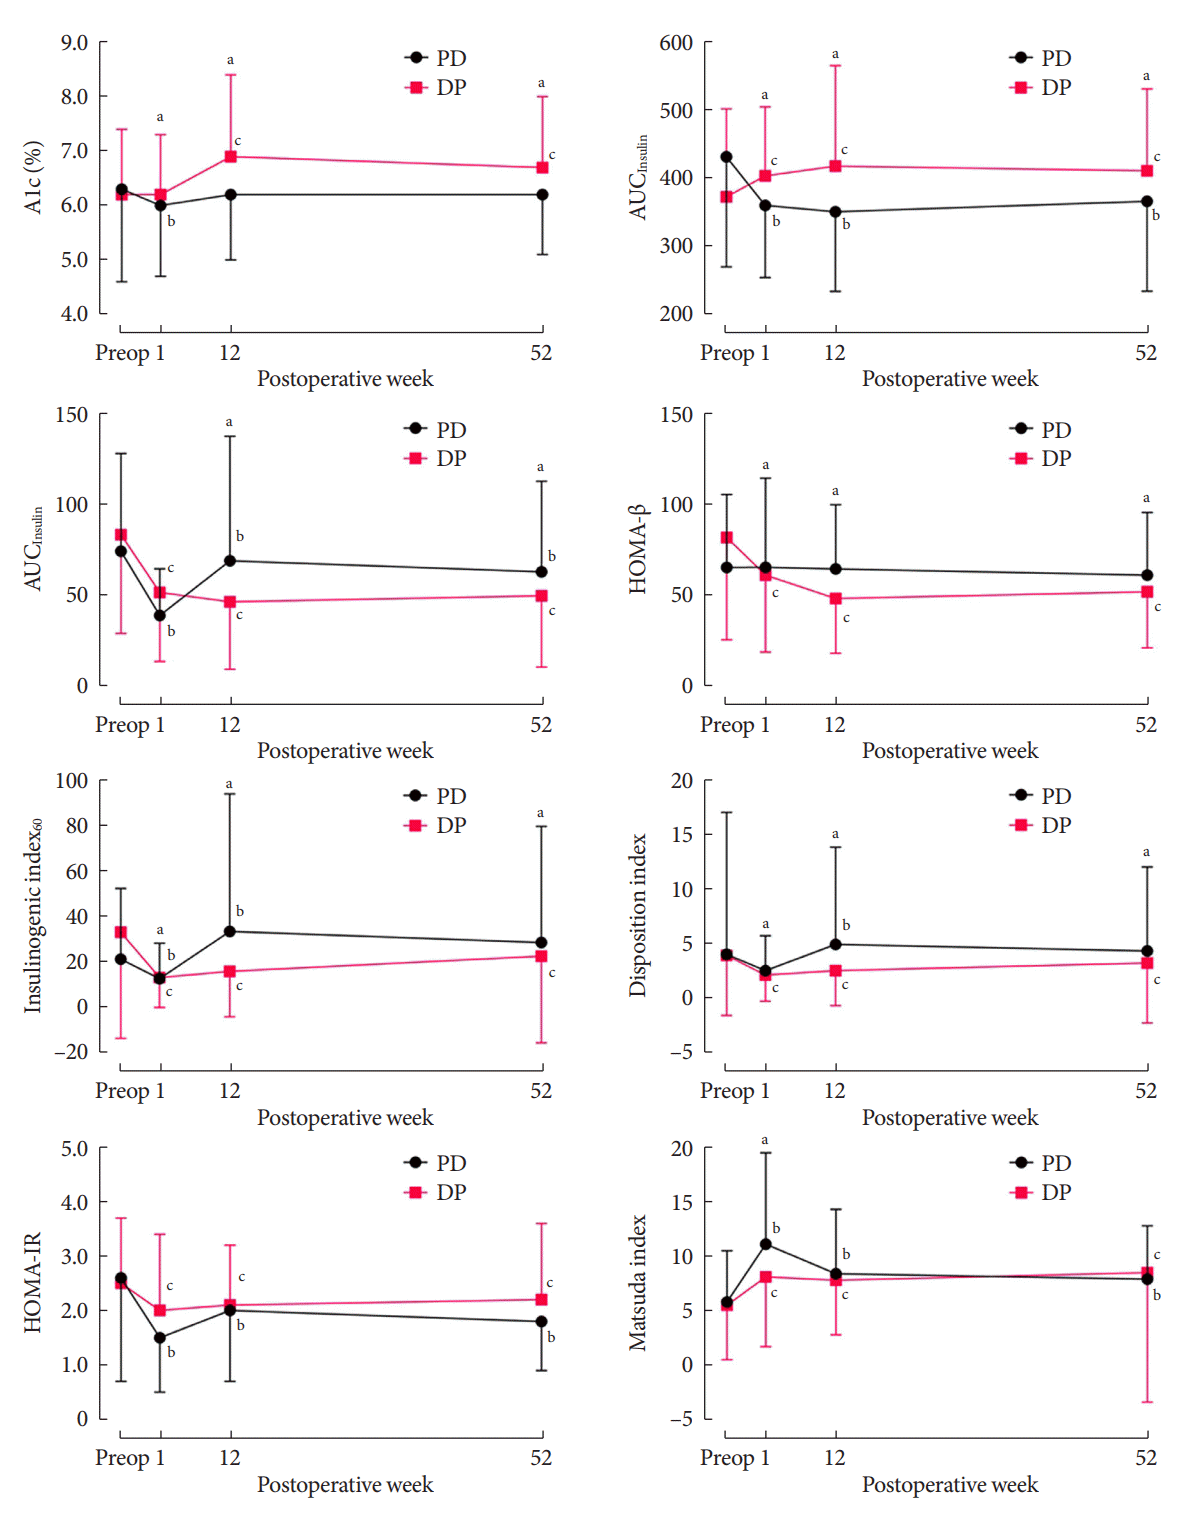
Fig. 1.

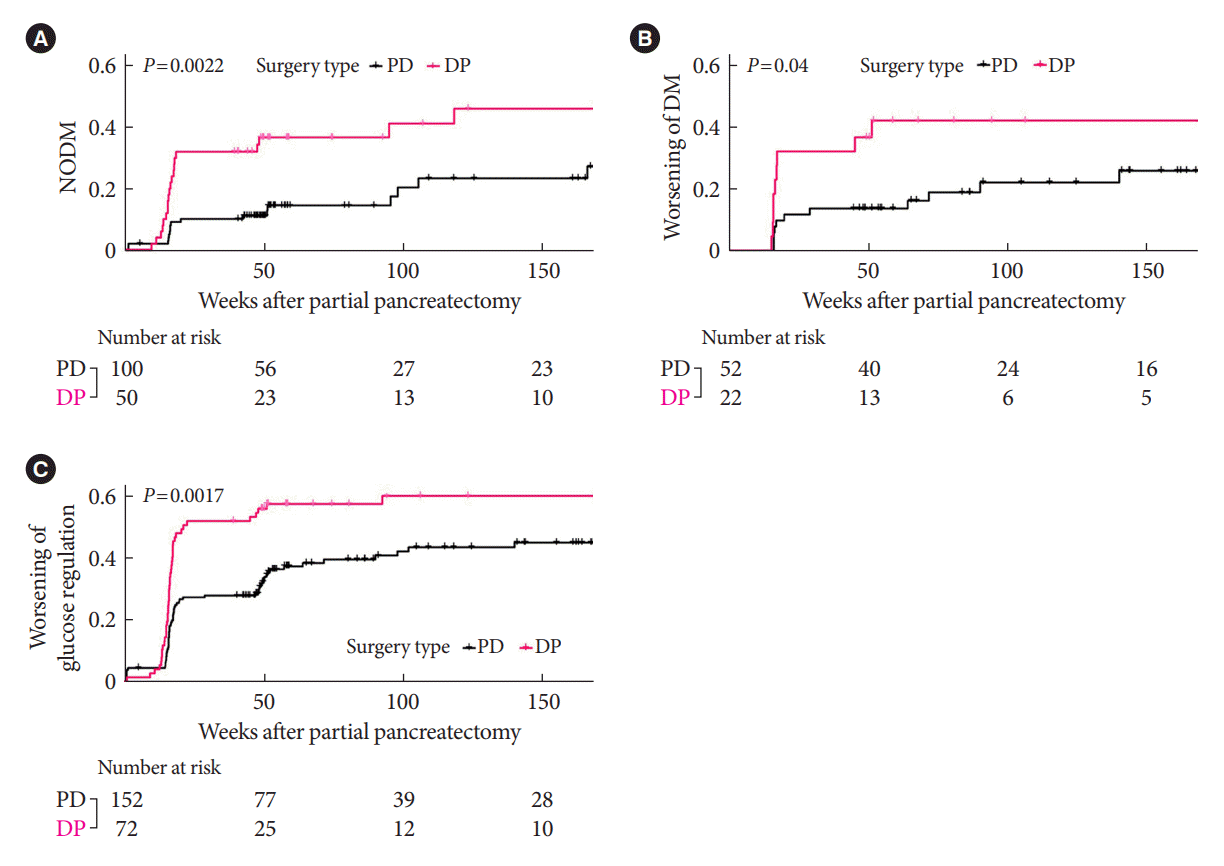
Fig. 2.

Table 1.
| Variable | Pancreaticoduodenectomy (n=152) | Distal pancreatectomy (n=72) | P value | ||
|---|---|---|---|---|---|
| Age, yr | 64.8±10.4 | 59.7±13.5 | 0.002 | ||
| Male sex | 82 (53.9) | 37 (51.4) | 0.830 | ||
| Body mass index, kg/m2 | 23.3±2.8 | 24.2±3.1 | 0.022 | ||
| HbA1c, % | 6.3±1.7 | 6.2±1.2 | 0.748 | ||
| Glucose at 0 min, mg/dL | 126.0±50.3 | 114.3±33.4 | 0.073 | ||
| Glucose at 60 min, mg/dL | 246.3±88.0 | 218.5±74.6 | 0.022 | ||
| Glucose at 120 min, mg/dL | 244.5±113.8 | 194.3±89.1 | 0.001 | ||
| AUCGlucose | 431.5±161.7 | 372.8±129.2 | 0.008 | ||
| Insulin at 0 min, μIU/mL | 8.2±4.0 | 9.1±3.8 | 0.100 | ||
| Insulin at 60 min, μIU/mL | 44.0±39.6 | 51.5±39.3 | 0.185 | ||
| Insulin at 120 min, μIU/mL | 51.5±42.5 | 53.7±44.9 | 0.720 | ||
| AUCInsulin | 73.9±53.8 | 83.0±54.4 | 0.240 | ||
| C-peptide, ng/mL | 3.0±1.9 | 2.4±1.2 | 0.022 | ||
| HOMA-IR | 2.6±1.9 | 2.5±1.2 | 0.761 | ||
| HOMA-β | 65.0±40.2 | 81.5±56.3 | 0.013 | ||
| Matsuda ISI | 5.8±4.7 | 5.5±5.0 | 0.647 | ||
| IGI60 | 21.2±31.2 | 33.1±46.8 | 0.026 | ||
| Disposition index | 4.0±13.0 | 3.9±5.5 | 0.957 | ||
| Total cholesterol, mg/dL | 196.8±75.0 | 179.6±35.0 | 0.069 | ||
| Aspartate aminotransferase, IU/L | 71.9±96.0 | 23.9±10.2 | <0.001 | ||
| Alanine aminotransferase, IU/L | 96.3±123.4 | 22.7±15.5 | <0.001 | ||
| eGFR, mL/min/1.73 m2 | 95.0±15.8 | 95.6±14.2 | 0.814 | ||
| hsCRP, mg/L | 1.02±1.88 | 0.80±3.55 | 0.568 | ||
| Resected pancreas volume, cm3 | 113.5±63.4 | 104.9±80.9 | 0.390 | ||
| Family history of diabetes | 28 (18.4) | 18 (25.0) | 0.255 | ||
| Pathology (etiology of surgery) | <0.001 | ||||
| Malignant lesion | 132 (86.8) | 41 (56.9) | |||
| Pancreatic cancer | 56 (36.8) | 38 (52.8) | |||
| Nonpancreatic cancer | 76 (50.0) | 3 (4.2) | |||
| Premalignant or benign lesion | 20 (13.2) | 31 (43.1) | |||
| ASA PS classification | 0.233 | ||||
| I | 31 (20.4) | 20 (27.8) | |||
| II | 102 (67.1) | 40 (55.6) | |||
| III | 17 (11.2) | 12 (16.7) | |||
| IV | 2 (1.3) | 0 | |||
| Comorbidities | |||||
| Prediabetes | 28 (18.4) | 19 (26.4) | 0.233 | ||
| Diabetes mellitus | 52 (34.2) | 22 (30.6) | 0.696 | ||
| Hypertension | 64 (42.1) | 30 (41.7) | 1.000 | ||
| Dyslipidemia | 57 (37.5) | 26 (36.1) | 0.958 | ||
| Obesity | 34 (22.4) | 26 (36.1) | 0.045 | ||
| Nephropathy | 5 (3.3) | 1 (1.4) | 0.704 | ||
| Preoperative medications | |||||
| Antidiabetic agentsa | 42 (27.6) | 20 (27.8) | 1.000 | ||
| Antihypertensive agents | 61 (40.1) | 30 (41.7) | 0.942 | ||
| Lipid-lowering agents | 36 (23.7) | 23 (31.9) | 0.251 | ||
| Neoadjuvant chemotherapyb | 6 (3.9) | 6 (8.3) | 0.297 | ||
| Postoperative chemotherapyc | 67 (44.1) | 32 (44.4) | 0.999 | ||
Values are presented as mean±standard deviation or number (%).
HbA1c, glycosylated hemoglobin; AUC, area under curve; HOMA-IR, homeostasis model assessment of insulin resistance; HOMA-β, homeostasis model assessment of β-cell function; ISI, insulin sensitivity index; IGI, insulinogenic index; eGFR, estimated glomerular filtration rate; hsCRP, high-sensitivity C-reactive protein; ASA, American Society of Anesthesiologists; PS, performance status.
a Three patients were using insulin: one in the pancreaticoduodenectomy (PD) group and two in the distal pancreatectomy group,
Table 2.
| Variable |
HR (95% CI) for NODM |
HR (95% CI) for worsening of DM |
|||
|---|---|---|---|---|---|
| Crude | Adjusted model | Crude | Adjusted model | ||
| Age, yr | 1.00 (0.98–1.03) | 0.99 (0.93–1.05) | 0.99 (0.96–1.03) | 0.99 (0.96–1.02) | |
| Female vs. male | 0.75 (0.40–1.42) | 0.59 (0.26–1.35) | 1.37 (0.57–3.32) | 0.71 (0.43–1.19) | |
| Baseline body mass index, kg/m2 | 1.08 (0.97–1.21) | 1.04 (0.89–1.22) | 0.93 (0.81–1.08) | 0.90 (0.81–1.00) | |
| Baseline HbA1c, % | 5.13 (2.49–10.6)a | 7.10 (2.49–20.2)a | 0.79 (0.58–1.09) | 1.60 (0.97–2.64) | |
| Baseline total cholesterol, mg/dL | 0.99 (0.99–1.01) | 1.01 (1.00–1.02) | 1.01 (1.00–1.01)a | 1.01 (1.00–1.01)a | |
| Baseline ALT, IU/L | 1.00 (1.00–1.00) | 1.00 (1.00–1.01) | 1.00 (0.99–1.01) | 1.00 (1.00–1.00) | |
| Baseline eGFR, mL/min/1.73 m2 | 0.99 (0.97–1.02) | 0.98 (0.93–1.02) | 0.99 (0.97–1.01) | 0.98 (0.96–1.01) | |
| Baseline hsCRP, g/dL | 0.64 (0.36–1.14) | 0.75 (0.45–1.25) | 0.89 (0.59–1.34) | 0.96 (0.82–1.12) | |
| Delta disposition index(Baseline – Week 1) | 1.03 (1.01–1.05)a | 1.03 (1.01–1.06)a | 1.04 (0.94–1.12) | 1.03 (1.02–1.04)a | |
| DP vs. PD | 2.58 (1.37–4.85)a | 4.29 (1.49–12.3)a | 2.45 (1.01–5.92)a | 2.15 (1.09–4.24)a | |
| Resected pancreas volume, cm3 | 1.00 (0.99–1.01) | 1.00 (1.00–1.01) | 0.99 (0.99–1.01) | 1.00 (1.00–1.00) | |
| Pathology (vs. premalignant or benign lesion) | |||||
| Pancreatic cancer | 2.85 (1.31–6.22)a | 3.21 (0.68–15.1) | 0.93 (0.30–2.93) | 1.12 (0.47–2.69) | |
| Nonpancreatic cancer | 0.55 (0.20–1.49) | 1.15 (0.26–5.16) | 1.18 (0.32–4.39) | 1.30 (0.56–3.03) | |
| Postoperative chemotherapyb | 2.39 (1.27–4.50)a | 2.48 (0.63–9.79) | 0.95 (0.39–2.29) | 1.64 (0.81–3.35) | |
HR, hazard ratio; NODM, new-onset diabetes mellitus; DM, diabetes mellitus; HbA1c, glycosylated hemoglobin; CI, confidence interval; ALT, alanine aminotransferase; eGFR, estimated glomerular filtration rate; hsCRP, high-sensitivity C-reactive protein; DP, distal pancreatectomy; PD, pancreaticoduodenectomy.


 PDF
PDF Citation
 Print
Print


 XML Download