Journal List > Korean J Orthod > v.53(5) > 1516083959

Zheng, Aljawad, Kim, Choi, Kim, Oh, and Cho: Three-dimensional evaluation of the association between tongue position and upper airway morphology in adults: A cross-sectional study

Abstract

Objective

This study aimed to evaluate the association between low tongue position (LTP) and the volume and dimensions of the nasopharyngeal, retropalatal, retroglossal, and hypopharyngeal segments of the upper airway.

Methods

A total of 194 subjects, including 91 males and 103 females were divided into a resting tongue position (RTP) group and a LTP group according to their tongue position. Subjects in the LTP group were divided into four subgroups (Q1, Q2, Q3, and Q4) according to the intraoral space volume. The 3D slicer software was used to measure the volume and minimum and average cross-sectional areas of each group. Airway differences between the RTP and LTP groups were analyzed to explore the association between tongue position and the upper airway.

Results

No significant differences were found in the airway dimensions between the RTP and LTP groups. For both retropalatal and retroglossal segments, the volume and average cross-sectional area were significantly greater in the patients with extremely low tongue position. Regression analysis showed that the retroglossal airway dimensions were positively correlated with the intraoral space volume and negatively correlated with A point-nasion-B point and palatal plane to mandibular plane. Males generally had larger retroglossal and hypopharyngeal airways than females.

Conclusions

Tongue position did not significantly influence upper airway volume or dimensions, except in the extremely LTP subgroup.

INTRODUCTION

The morphology and dimensions of the upper airway are affected by various skeletal and dental factors. The size and position of the maxilla and mandible have been reported to influence the upper airway size.1-5 The skeletal Class II sagittal relationship has been reported to be associated with smaller upper airway segments compared to the other 2 sagittal skeletal patterns.6 Vertical facial patterns have been reported to influence the dimensions of the upper airway.7 Tarkar et al.8 found that in patients with a vertical growth pattern, the width of the upper oropharyngeal airway is narrower and the position of the dorsum of the tongue is higher. Therefore, an upper airway analysis plays an integral role in orthodontic diagnosis and treatment planning.
Various orthodontic appliances and treatment techniques, including mandibular advancement devices, rapid maxillary expansion (RME), and maxillomandibular advancement surgery, have been reported to cause changes in upper airway dimensions.9-14 These devices and techniques change the space available for the tongue within the oral cavity. Mandibular advancement devices have been reported to induce changes in the upper airway dimensions. The anterior tongue movement associated with mandibular advancement appliances has been reported to be the cause of enlargement of the upper airway.9-11 Rapid maxillary expansion has been reported to induce changes in the upper airway dimensions.12 Iwasaki et al.13 demonstrated that treatment with RME for maxillary transverse deficiency enlarges the pharyngeal airway and alters the tongue position. Maxillomandibular advancement surgeries that change the upper airway dimensions are also related to anterior movement of the tongue.14
Previous studies have demonstrated that orthodontic appliances and techniques that induce changes in the anteroposterior position of the tongue and tongue base, also cause changes in upper airway dimensions.12,14 In addition, the effect of the tongue on the upper airway has been mentioned in several studies, but with no reference to how the tongue affects the upper airway.15,16 Gurani et al.15 conducted a systematic review of the effect of head and tongue postures on upper airway dimensions and morphology and concluded that they were unable to find any study concerning the effect of tongue posture on upper airway dimensions and morphology. Another study that evaluated the effects of altered head and tongue positions during magnetic resonance imaging (MRI) acquisition demonstrated that altered head and tongue positions cause changes in the upper airway dimensions.17 To the best of our knowledge, no study has investigated the association between tongue position at rest and upper airway dimensions using cone-beam computed tomography (CBCT) images. Therefore, the present study aimed to investigate the association between a low tongue position (LTP) and the dimensions of the nasopharyngeal, retropalatal, retroglossal, and hypopharyngeal segments of the upper airway.

MATERIALS AND METHODS

The participants in this study were Korean patients who visited the orthodontic Department of the Chonnam National University Dental Hospital seeking orthodontic treatment between 2017 and 2022. All data collection and recordings were performed anonymously, and informed consent was obtained from all patients. This study was approved by the Institutional Review Board (IRB) of the Chonnam National University (IRB No. 1040198-211231-HR-183-01). The inclusion criteria were availability of cephalometric radiographs and complete CBCT scans. The patients were stipulated to be 18 years old or older at the time of these modalities. Subjects with respiratory diseases, history of adenoidectomy, ankyloglossia, history of ankyloglossia, enlarged tonsils, craniofacial deformities, or systemic diseases were excluded from the study. Subjects with blurred CBCT images were also excluded to eliminate the effect of swallowing on the tongue position and airway.
CBCT scans were obtained with Alphard VEGA (Asahi Roentgen Co., Kyoto, Japan) scanner under the following conditions: 80 kV, 5 mA, 0.39 × 0.39 × 0.39 mm voxel size, and 200 × 179 mm field of view. The participants were instructed to stand and look at a mirror in their natural head position. To record the patient’s natural head position, a head-posture aligner was attached to the left zygomatic region. The patients were then scanned while sitting in an upright position with the teeth in occlusion. A head-posture aligner was used to maintain the patient’s head in a natural position while scanning. Reference earplugs were also used to orient the CBCT scans in a natural head position, as described in a previous study.18 The patients were asked to maintain head posture and not to swallow or move the tongue during the CBCT scanning process. The CBCT scans were imported into the Invivo5 software (version 5.3; Anatomage, San Jose, CA, USA) to determine whether they met the inclusion criteria of this study. All the CBCT images were collected by two researchers. The fourth cervical vertebra (C4) of the patient had to be clearly and completely displayed on the sagittal CBCT image to ensure that complete upper airway data were obtained in the subsequent analysis. The CBCT images that met the inclusion criteria were exported as Digital Imaging and Communications in Medicine (DICOM) files for subsequent analyses. In addition to age and sex, cephalometric measurements related to the sagittal and vertical facial dimensions that might affect the upper airway were also recorded from the cephalometric radiographs of each subject.
All DICOM files exported by the Invivo5 software were imported into the three-dimensional (3D) slicer software (version 4.11). Two researchers performed the upper airway segmentation. Using the 3D slicer software, the upper airway was extracted using the threshold function in the segment editor tab. The fixed threshold was determined to be between –1,024 and –250. Following segmentation, the previously defined segments were identified and isolated using the scissors function of the 3D slicer. Finally, a quantification function was used to measure the volume and average and minimum cross-sectional areas of each segment.
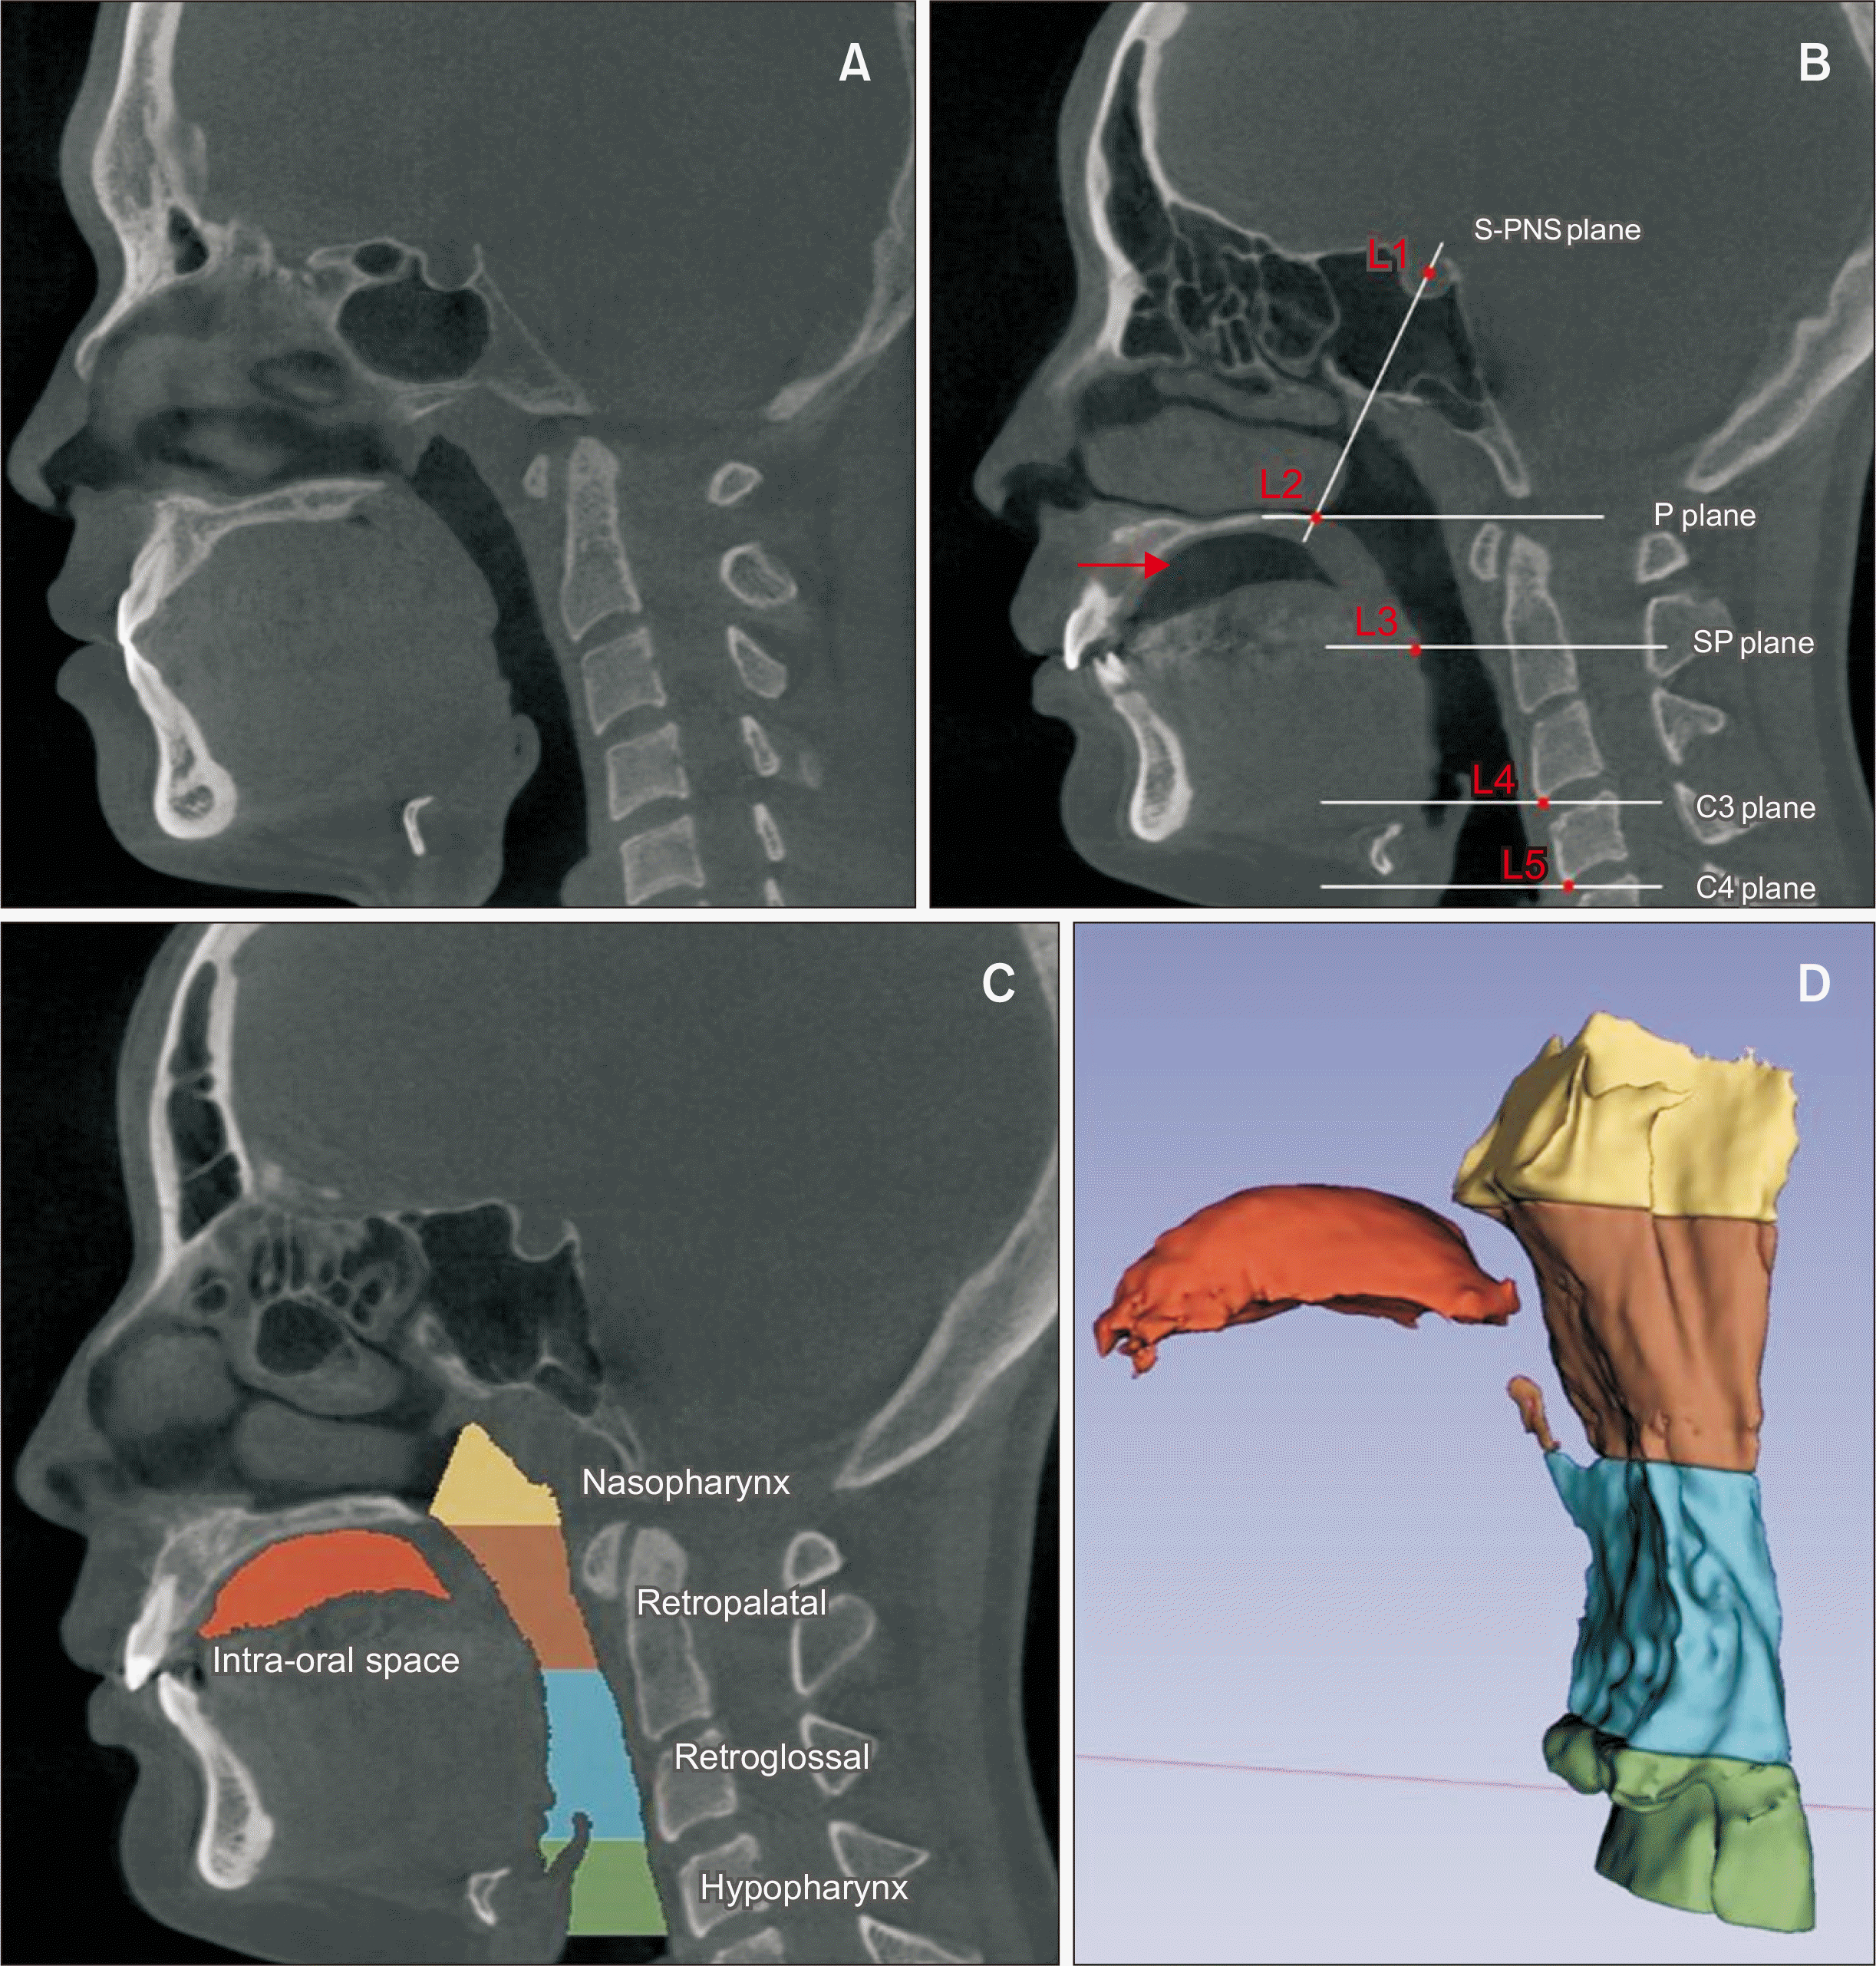
The patients were divided into two groups based on their tongue position. On sagittal view of the CBCT scan, patients who did not have a space between the dorsum of the tongue and the palate in the sagittal view of the CBCT scan were included in the resting tongue position (RTP) group (Figure 1A). The patients with an air-filled space between the dorsum of the tongue and palate were included in the LTP group (Figure 1B). Using the 3D slicer software, five reference planes were constructed using five landmarks to measure various upper airway segments (Figure 1B). The five landmarks included the sella (S), posterior nasal spine (PNS), most inferior point of the soft palate, most anteroinferior point of the third cervical vertebra (C3), and most anteroinferior point of the fourth cervical vertebra (C4). The S-PNS plane was constructed by a plane passing through the S and PNS landmarks perpendicular to the midsagittal plane. The P plane was constructed by a plane passing through the PNS point, parallel to the floor and perpendicular to the midsagittal plane. The SP plane was constructed by a plane that passes through the most inferior point of the soft palate, parallel to the P plane. The C3 and C4 planes were constructed by planes parallel to the P plane passing through the most anteroinferior point of the third and fourth cervical vertebrae, respectively.
According to a previous study, the upper airway was divided into four segments: nasopharynx, retropalatal, retroglossal, and hypopharynx.19 The nasopharyngeal segment of the upper airway extends between the S-PNS plane and the P plane. The retropalatal segment of the upper airway extends between the P plane superiorly and the SP plane inferiorly. The retroglossal segment of the upper airway extends between the SP plane superiorly and the C3 plane inferiorly. The C3 plane limits the hypopharyngeal segment of the upper airway superiorly while the C4 plane limits the hypopharyngeal segment inferiorly. In the LTP group, the intraoral space segment was calculated to represent the air-filled space in the patient's oral cavity between the tongue and the palate (Figure 1C and 1D).

Statistical analysis

The intraclass correlation coefficient (ICC) was used to conduct an inter-examiner reliability test. The sample size was calculated using the G*Power program (version 3.1.9.2; Heinrich-Heine-University, Düsseldorf, Germany) with an alpha error of 5% and a statistical power of 80%, indicating the requirement of 183 participants. One-way analysis of variance (ANOVA) was used to analyze demographic data between the RTP and LTP groups. The chi-squared test was used to test for sex differences between the RTP and LTP groups.
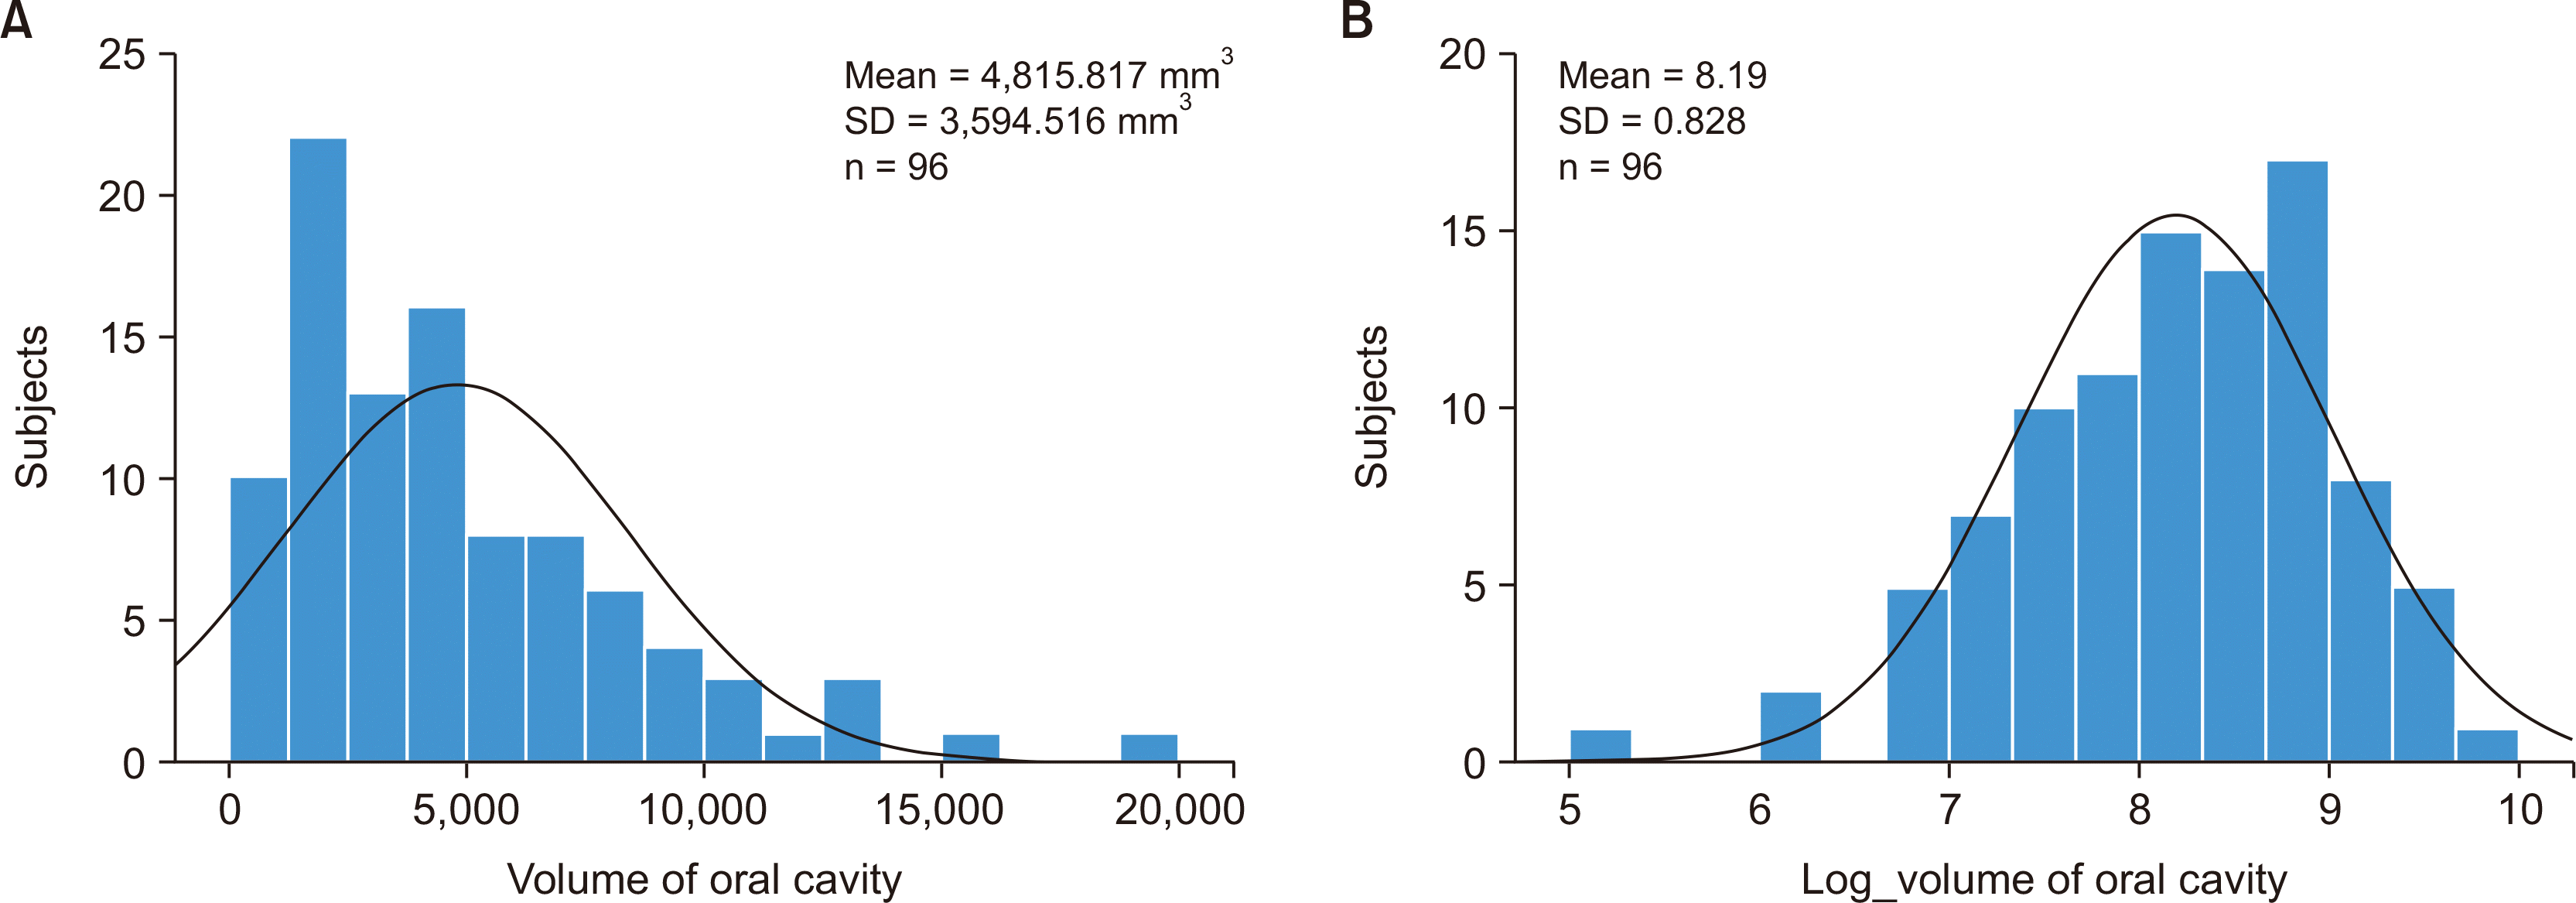
The volume of the intraoral space in the LTP group did not follow a normal distribution. These were transformed using logarithms to obtain normal distributions. After log transformation, the Kolmogorov–Smirnov test suggested that the data followed a normal distribution (P = 0.200, Figure 2). Based on the average value of the log-transformed data (8.1878) and standard deviation (0.82754), the participants were divided into four subgroups (Q1, Q2, Q3, and Q4). Because the values of these fiducials were log-transformed, an exponential transformation was applied to transform these values to the original intraoral space volume. The division process and range of each subgroup are listed in Table 1.
Airway differences between the RTP and LTP groups were analyzed using an independent t test, while one-way ANOVA was performed to explore the significance among the four subgroups of the LTP and RTP groups. The least significant difference post-hoc was performed for significant ANOVA results. Finally, regression analysis was used to analyze the influence of all parameters (intraoral space volume, age, sex, A point-nasion-B point [ANB] angle, sella-nasion plane to mandibular plane [SN-MP] angle, overbite depth indicator [ODI], palatal plane to mandibular plane [PP-MP] angle, and Frankfort-mandibular plane angle [FMA]) on airway morphology. All the statistical calculations in the present study were performed within 95% confidence intervals. Data analysis was performed using IBM SPSS statistical software (version 22.0; IBM Corp., Armonk, NY, USA).

RESULTS

Demographic

A total of 194 participants were enrolled in this study, including 98 in the RTP group and 96 in the LTP group. This study included 91 male participants and 103 female participants. The results of the chi-square test suggested that there was no significant difference in sex distribution between the RTP and LTP groups (P = 0.253; Table 2). The youngest and oldest subjects in this study were 18 and 58 years old, respectively. The median ages of the RTP and LTP groups were 38 and 33 years, respectively, and there was no significant difference in the age distribution between the two groups (P = 0.197; Table 2). No significant differences in the five cephalometric parameters were found between the RTP and LTP groups (Table 2).

Effects of tongue position on the upper airway

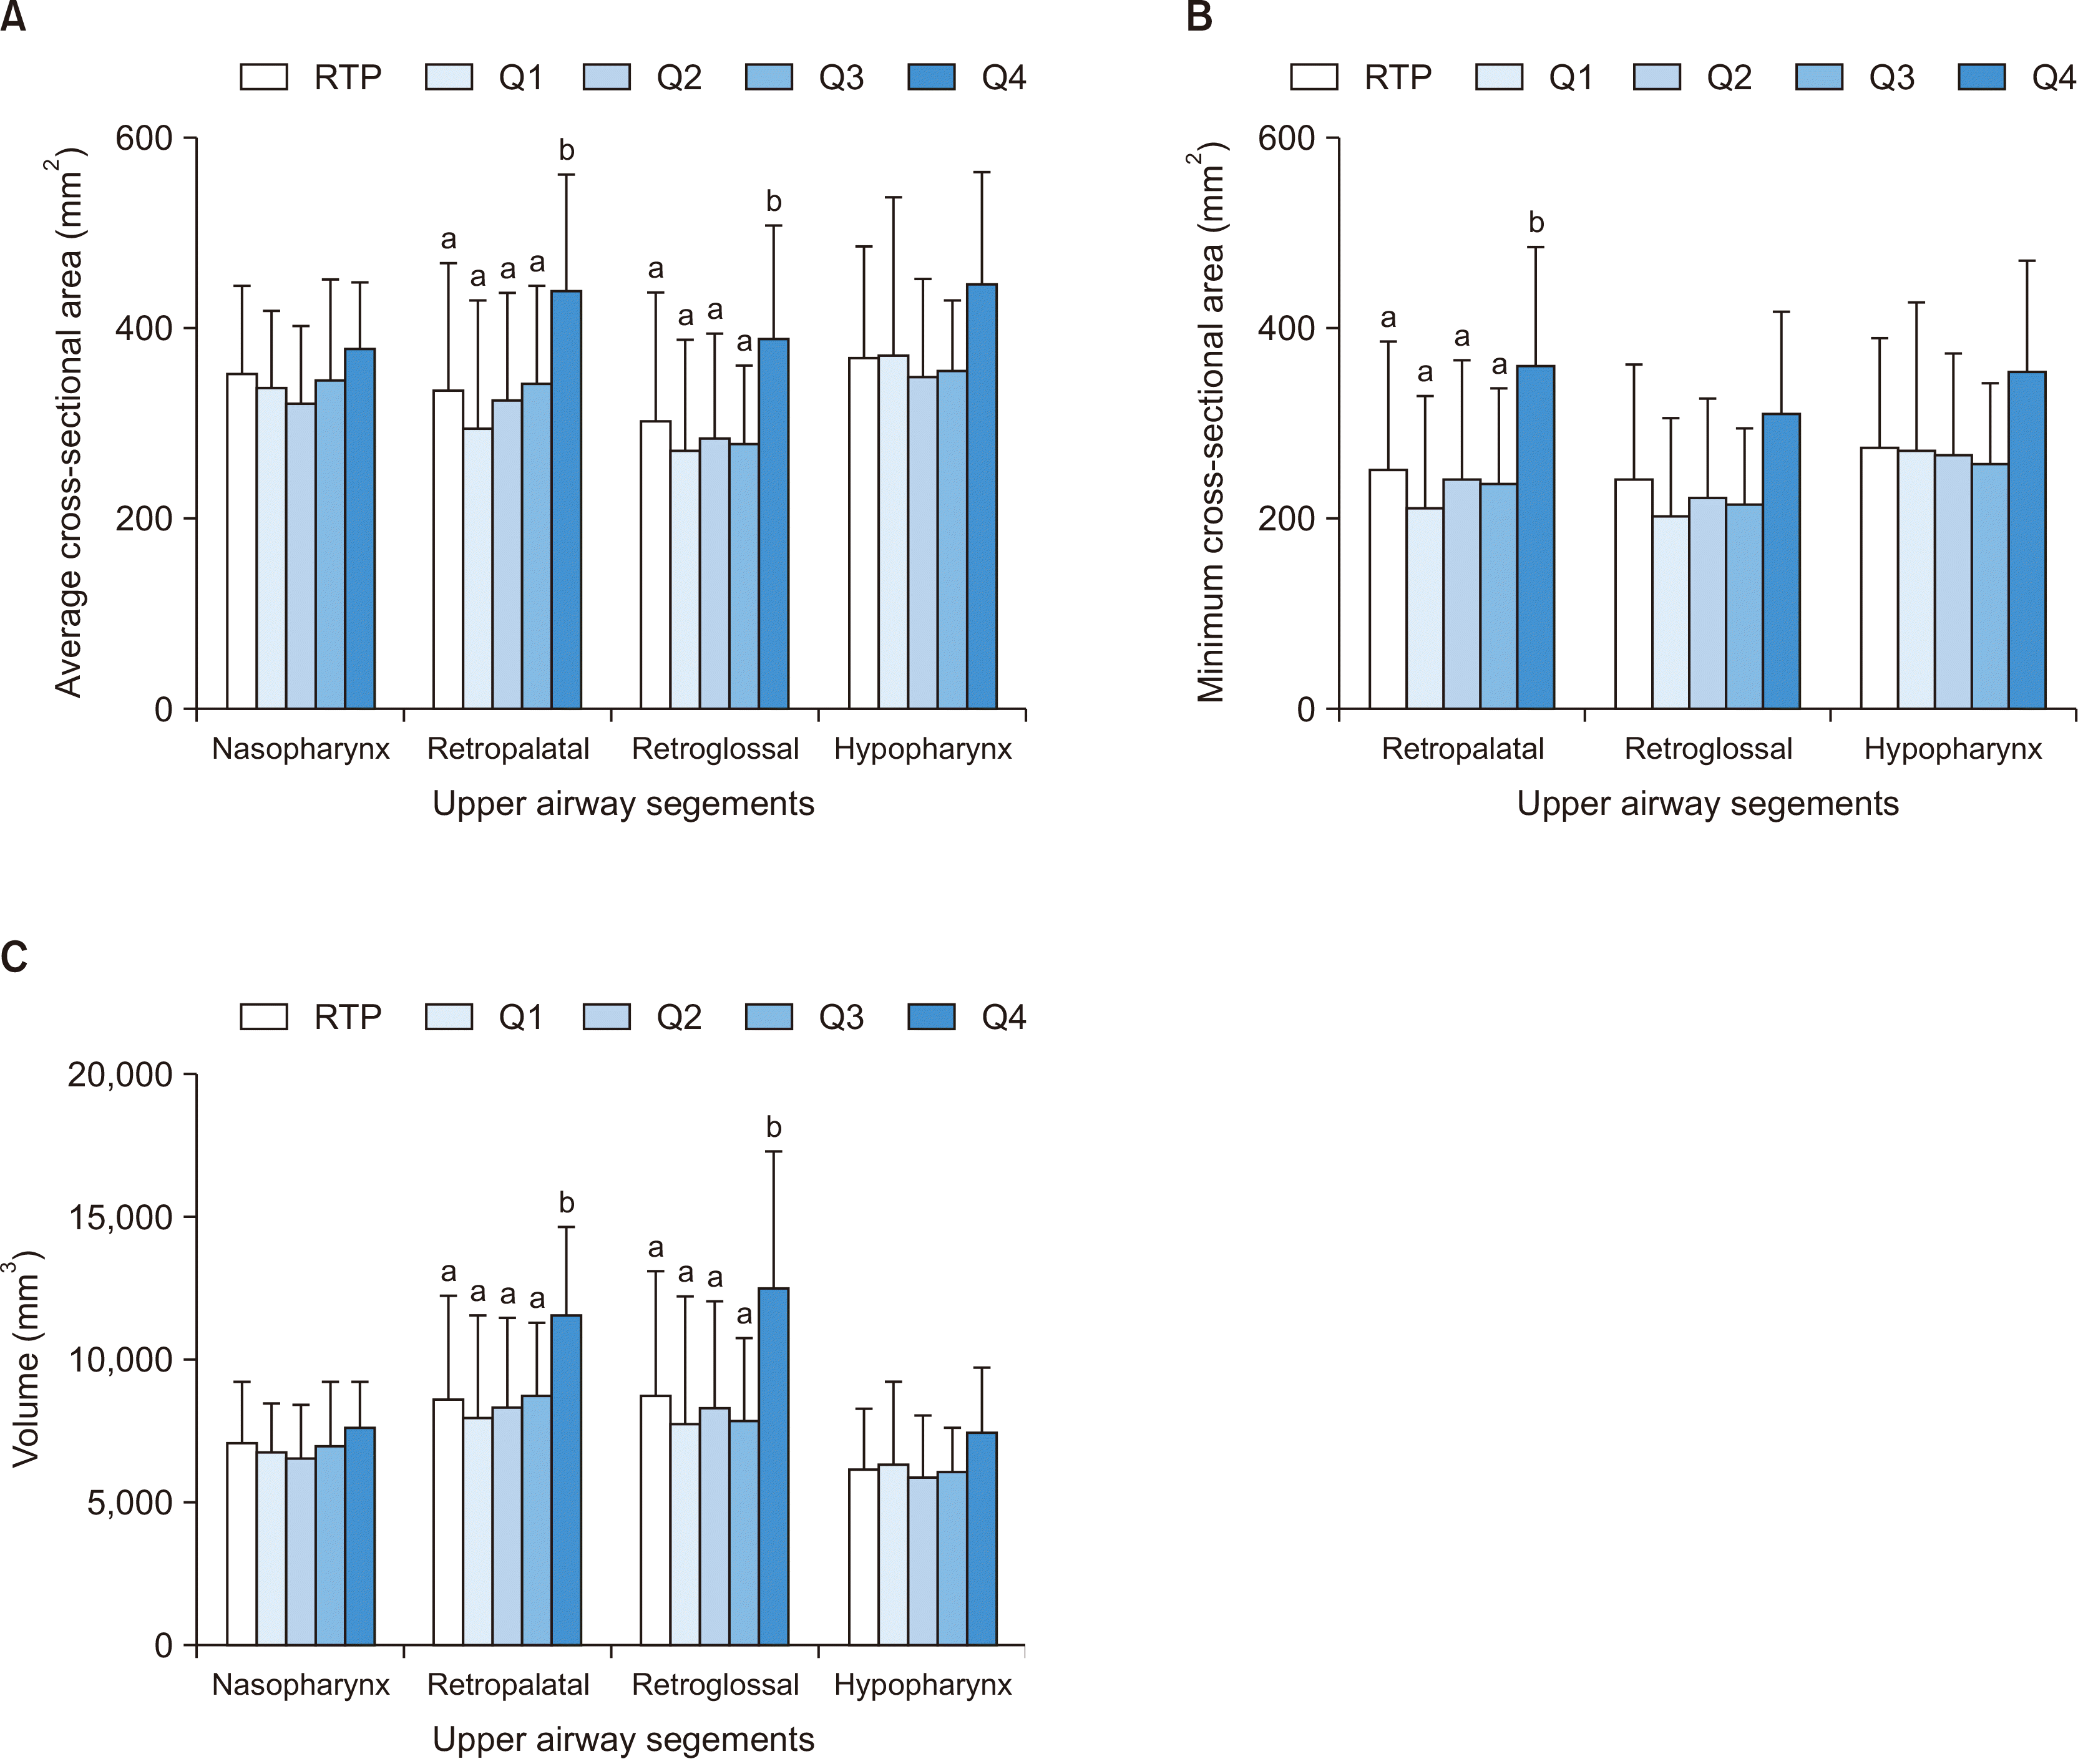
The ICC for the airway segmentation and calculation was 0.991, indicating a high degree of reliability. The upper airway volumes and average and minimum cross-sectional areas did not differ significantly between the RTP and LTP groups (Table 3). For the average cross-sectional area, significant differences were observed between the retropalatal (P = 0.034) and retroglossal (P = 0.048) segments of the upper airway. Post-hoc analysis showed that for both the retropalatal and retroglossal segments, the average cross-sectional area of the Q4 subgroup was significantly greater than that of the Q1, Q2, and Q3 subgroups and the RTP group, while there were no significant differences between the Q1, Q2, and Q3 subgroups and the RTP group. For the minimum cross-sectional area, only the retropalatal segment showed statistical differences (P = 0.016), and post hoc analysis showed that the Q4 subgroup was significantly greater than the Q1, Q2, and Q3 subgroups and the RTP group. No significant differences were found between the Q1, Q2, and Q3 subgroups and the RTP group (Table 4, Figure 3A and 3B).
The volumes of the retropalatal (P = 0.035) and retroglossal (P = 0.006) segments showed statistically significant differences. Post-hoc analysis showed that for the retropalatal and retroglossal segments, the volumes of the Q4 subgroup were significantly greater than those of the other subgroups and the RTP group (Table 4, Figure 3C).

Effects of clinical parameters on the upper airway

Regression analysis was used to explore the influence of eight independent variables (intraoral space volume, age, sex, ANB, SN-MP, ODI, PP-MP, and FMA) on the volume, average, and minimum cross-sectional areas of each segment. The significance and R2 values are listed in Table 5.
Stepwise regression analysis was performed among variables with higher coefficients of determination (R2 > 0.350; retroglossalACA, retroglossalMCA, retroglossalV, and hypopharynxV). In this study, sex in the regression analysis was set to 0 for males and 1 for females, and the results obtained are shown in the following linear regression equations:
RetroglossalACA=383.2+0.008 (oral)42.606 (sex)8.260 (ANB)3.862 (PP-MP)RetroglossalMCA=298.9+0.008 (oral)10.825 (ANB)3.677 (PP-MP)RetroglossalV=12,472.5+0.317 (oral)1,758.945 (sex)211.524 (ANB)168.173 (PP-MP)HypopharynxV=7,497.02,105.949 (sex)131.332 (ANB)
The results showed that the retroglossal airway dimensions were positively correlated with the intraoral space volume and negatively correlated with PP-MP. The retroglossal and hypopharyngeal airway dimensions were negatively correlated with ANB. Males generally had larger retroglossal and hypopharyngeal airways than females.

DISCUSSION

This study aimed to evaluate the association between tongue position and upper airway volume and dimensions. No statistically significant differences were observed in the size of the upper airway segments between the LTP and RTP groups. Gurani et al.17 conducted an MRI study to investigate the relationship between altered head and tongue postures and the upper airway and found that raising or lowering the tongue did not significantly affect the retropalatal segment, oropharyngeal segment, or total upper airway volumes. These findings were similar to those of the present study. In another CBCT study, Iwasaki et al.13 found that following treatment with RME, the patients’ tongue positions were significantly elevated and the upper airway volume increased significantly. However, the authors claimed that the increase in airway volume was due to enlargement of the palate volume rather than the upward movement of the tongue.
Unlike previous studies, we divided the subjects in the LTP group into four subgroups according to the intraoral space volume for comparison with the RTP group. The results showed significant differences between subgroup with the lowest tongue position (Q4) and the RTP group, in the average cross-sectional area and volume of the retropalatal and retroglossal airways. This suggested that, when patients have very LTP, the lower the tongue position, the greater the retropalatal and retroglossal airway dimensions. Hiyama et al.20 reported a significant increase in the forward growth of the maxillary and upper airway dimensions after the use of maxillary protraction appliances. A forward and downward tongue position may lead to a forward position of the soft palate, resulting in increased retropalatal and retroglossal airway volumes.
Various methods have been used in previous studies to determine the tongue position. Staudt et al.21 analyzed the pharyngeal airways of 24 children using lateral cephalograms. In this study, the authors connected landmarks V (vallecula, the depression behind the tongue root) and ST (the superior point of the tongue) and measured the length between the two points to determine the tongue position. Tarkar et al.8 used Rokosi analysis to measure tongue position. However, both of these studies were two-dimensional studies based on lateral cephalograms. In a three-dimensional study, Gurani et al.17 utilized MRI to observe tongue posture directly. This was a CBCT study, and because of the limitations of CBCT in soft tissue observation, the volume of the intraoral space was measured to indirectly determine the tongue position. This approach proved effective in previous studies.13
Additionally, we evaluated the associations between other factors and airway dimensions. We found that the ANB and PP-MP were negatively correlated with the volume and average cross-sectional area of the retroglossal and hypopharyngeal airways. According to a previous study, the volumes of the oropharyngeal and hypopharyngeal airways were negatively correlated with the ANB angle.22 Zhong et al.23 found that there was a significant decrease in the upper airway dimensions in the three subgroups of patients with Angle’s classes III, I, and II, by order. While our conclusion aligned with theirs, we did not perform ANB-based Angle’s classification.
The upright sitting position was used for CBCT scans in our study. Ingman et al.24 used cephalometric methods to explore airway changes in patients in different positions and concluded that the shortest distance between the tip of the soft palate and the posterior oropharyngeal wall significantly changed in the supine position, and the tongue was significantly shorter and thicker in the supine position. Another cephalometric and electromyographic study showed that the soft palate thickness and posterior tongue pressure increased significantly when the patient changed from an upright position to a supine position.25
This study had several limitations. First, it was a static rather than a dynamic study, and it was not possible to observe the real-time effect of tongue position on airway morphology. Dynamic imaging techniques such as sleep MRI are reliable for dynamic airway structure analysis.26 Second, subjects in this study ranged in age from 18 to 58 years, but there were no age-matched controls in our study. Martin et al.27 reported that the upper airway dimensions decrease with age. In addition, the Q1 (n = 15) and Q4 (n = 13) subgroups had smaller sample sizes, which may be because subjects with minimal and extremely large intra-oral spaces are rare. Differences in sample sizes between subgroups can be overcome using statistical calculations. Finally, the effect of body mass index (BMI) on airways was not considered in this study. According to a previous study, the BMI of the Korean population in 2018 was reported 24.6 for male and 23.4 for female, based on the Korea National Health and Nutrition Examination Surveys (KNHANES).28
The results of the present study have important clinical implications. This study evaluated the association between the upper airway dimensions and tongue position inside the oral cavity, which could be influenced by several factors or treatments, including ankyloglossia, transverse discrepancies, and appliances that cause changes in tongue position. Orthodontists could provide insights into the tendency of changes in airway dimensions if the planned treatment affects the tongue position inside the oral cavity. Orthodontists, therefore, could implement techniques in the treatment plan that could affect the tongue position to induce favorable changes in narrow airways. Further investigations with larger sample size are required to investigate influence of tongue position on the airway in patients who have obstructive sleep apnea.

CONCLUSIONS

Except for the extremely LTP, the effect of tongue position on the upper airway volume and dimensions was not significant in this study. The intraoral space volume was positively correlated with the retroglossal and hypopharyngeal airway segments, while ANB and PP-MP were negatively correlated. Male patients generally had larger retroglossal and hypopharyngeal airway dimensions compared to female patients.

Notes

AUTHOR CONTRIBUTIONS

Conceptualization: YZ, HA. Data curation: SHC. Formal analysis: SHC, Min-Soo K. Investigation: YZ, Min-Seok K. Min-Soo K. Methodology: YZ, HA, JHC. Project administration: JHC. Resources: HA, MHO. Supervision: JHC. Validation: Min-Seok K. Visualization: MHO. Writing–original draft: YZ. Writing–review & editing: HA, JHC.

CONFLICTS OF INTEREST

No potential conflict of interest relevant to this article was reported.

REFERENCES

1. Lowe AA, Fleetham JA, Adachi S, Ryan CF. 1995; Cephalometric and computed tomographic predictors of obstructive sleep apnea severity. Am J Orthod Dentofacial Orthop. 107:589–95. https://doi.org/10.1016/s0889-5406(95)70101-x. DOI: 10.1016/S0889-5406(95)70101-X. PMID: 7771363.
crossref
2. Miles PG, Vig PS, Weyant RJ, Forrest TD, Rockette HE Jr. 1996; Craniofacial structure and obstructive sleep apnea syndrome--a qualitative analysis and meta-analysis of the literature. Am J Orthod Dentofacial Orthop. 109:163–72. https://doi.org/10.1016/s0889-5406(96)70177-4. DOI: 10.1016/S0889-5406(96)70177-4. PMID: 8638562.
crossref
3. Oktay H, Ulukaya E. 2008; Maxillary protraction appliance effect on the size of the upper airway passage. Angle Orthod. 78:209–14. https://doi.org/10.2319/122806-535.1. DOI: 10.2319/122806-535.1. PMID: 18251620.
crossref
4. Golchini E, Rasoolijazi H, Momeni F, Shafaat P, Ahadi R, Jafarabadi MA, et al. 2020; Investigation of the relationship between mandibular morphology and upper airway dimensions. J Craniofac Surg. 31:1353–61. https://doi.org/10.1097/SCS.0000000000006341. DOI: 10.1097/SCS.0000000000006341. PMID: 32224775.
crossref
5. Okubo M, Suzuki M, Horiuchi A, Okabe S, Ikeda K, Higano S, et al. 2006; Morphologic analyses of mandible and upper airway soft tissue by MRI of patients with obstructive sleep apnea hypopnea syndrome. Sleep. 29:909–15. https://doi.org/10.1093/sleep/29.7.909. DOI: 10.1093/sleep/29.7.909. PMID: 16895258.
crossref
6. Kirjavainen M, Kirjavainen T. 2007; Upper airway dimensions in Class II malocclusion. Effects of headgear treatment. Angle Orthod. 77:1046–53. https://doi.org/10.2319/081406-332. DOI: 10.2319/081406-332. PMID: 18004913.
crossref
7. Alfawzan AA. 2020; Assessment of airway dimensions in skeletal Class I malocclusion patients with various vertical facial patterns: a cephalometric study in a sample of the Saudi population. J Orthod Sci. 9:12. https://doi.org/10.4103/jos.JOS_10_20. DOI: 10.4103/jos.JOS_10_20. PMID: 33354538. PMCID: PMC7749458. PMID: ab1ce265f39541c8acb487dda09d480d.
crossref
8. Tarkar JS, Parashar S, Gupta G, Bhardwaj P, Maurya RK, Singh A, et al. 2016; An evaluation of upper and lower pharyngeal airway width, tongue posture and hyoid bone position in subjects with different growth patterns. J Clin Diagn Res. 10:ZC79–83. https://doi.org/10.7860/JCDR/2016/16746.7158. DOI: 10.7860/JCDR/2016/16746.7158. PMID: 26894183. PMCID: PMC4740711. PMID: 926e26c0099e40b1a62555fd6880a6ed.
crossref
9. Jugé L, Knapman FL, Humburg P, Burke PGR, Lowth AB, Brown E, et al. 2022; The relationship between mandibular advancement, tongue movement, and treatment outcome in obstructive sleep apnea. Sleep. 45:zsac044. https://doi.org/10.1093/sleep/zsac044. DOI: 10.1093/sleep/zsac044. PMID: 35218653.
crossref
10. Chan AS, Sutherland K, Schwab RJ, Zeng B, Petocz P, Lee RW, et al. 2010; The effect of mandibular advancement on upper airway structure in obstructive sleep apnoea. Thorax. 65:726–32. https://doi.org/10.1136/thx.2009.131094. DOI: 10.1136/thx.2009.131094. PMID: 20685749.
crossref
11. Ferguson KA, Cartwright R, Rogers R, Schmidt-Nowara W. 2006; Oral appliances for snoring and obstructive sleep apnea: a review. Sleep. 29:244–62. https://doi.org/10.1093/sleep/29.2.244. DOI: 10.1093/sleep/29.2.244. PMID: 16494093.
crossref
12. Aljawad H, Lee KM, Lim HJ. 2021; Three-dimensional evaluation of upper airway changes following rapid maxillary expansion: a retrospective comparison with propensity score matched controls. PLoS One. 16:e0261579. https://doi.org/10.1371/journal.pone.0261579. DOI: 10.1371/journal.pone.0261579. PMID: 34941970. PMCID: PMC8699684. PMID: ad2753ccb94b4187b321bc64f6526aa1.
crossref
13. Iwasaki T, Saitoh I, Takemoto Y, Inada E, Kakuno E, Kanomi R, et al. 2013; Tongue posture improvement and pharyngeal airway enlargement as secondary effects of rapid maxillary expansion: a cone-beam computed tomography study. Am J Orthod Dentofacial Orthop. 143:235–45. https://doi.org/10.1016/j.ajodo.2012.09.014. DOI: 10.1016/j.ajodo.2012.09.014. PMID: 23374931.
crossref
14. Hsieh YJ, Liao YF, Chen NH, Chen YR. 2014; Changes in the calibre of the upper airway and the surrounding structures after maxillomandibular advancement for obstructive sleep apnoea. Br J Oral Maxillofac Surg. 52:445–51. https://doi.org/10.1016/j.bjoms.2014.02.006. DOI: 10.1016/j.bjoms.2014.02.006. PMID: 24629456.
crossref
15. Gurani SF, Di Carlo G, Cattaneo PM, Thorn JJ, Pinholt EM. 2016; Effect of head and tongue posture on the pharyngeal airway dimensions and morphology in three-dimensional imaging: a systematic review. J Oral Maxillofac Res. 7:e1. https://doi.org/10.5037/jomr.2016.7101. DOI: 10.5037/jomr.2016.7101. PMID: 27099695. PMCID: PMC4837605. PMID: 73aaf2d959fc499492192638e3f9312d.
crossref
16. Izuka EN, Feres MF, Pignatari SS. 2015; Immediate impact of rapid maxillary expansion on upper airway dimensions and on the quality of life of mouth breathers. Dental Press J Orthod. 20:43–9. https://doi.org/10.1590/2176-9451.20.3.043-049.oar. DOI: 10.1590/2176-9451.20.3.043-049.oar. PMID: 26154455. PMCID: PMC4520137. PMID: 0b89c1c56c2647faa036d90ec391d8b1.
crossref
17. Gurani SF, Cattaneo PM, Rafaelsen SR, Pedersen MR, Thorn JJ, Pinholt EM. 2020; The effect of altered head and tongue posture on upper airway volume based on a validated upper airway analysis-an MRI pilot study. Orthod Craniofac Res. 23:102–9. https://doi.org/10.1111/ocr.12348. DOI: 10.1111/ocr.12348. PMID: 31550076.
crossref
18. Hwang HS, Lee KM, Uhm GS, Cho JH, McNamara JA Jr. 2013; Use of Reference Ear Plug to improve accuracy of lateral cephalograms generated from cone-beam computed tomography scans. Korean J Orthod. 43:54–61. https://doi.org/10.4041/kjod.2013.43.2.54. DOI: 10.4041/kjod.2013.43.2.54. PMID: 23671830. PMCID: PMC3650214.
crossref
19. Lee K, Hwang SJ. 2019; Change of the upper airway after mandibular setback surgery in patients with mandibular prognathism and anterior open bite. Maxillofac Plast Reconstr Surg. 41:51. https://doi.org/10.1186/s40902-019-0230-4. DOI: 10.1186/s40902-019-0230-4. PMID: 31824889. PMCID: PMC6877677. PMID: 34f7a387a7374ed7a7bd1249c866ef60.
crossref
20. Hiyama S, Suda N, Ishii-Suzuki M, Tsuiki S, Ogawa M, Suzuki S, et al. 2002; Effects of maxillary protraction on craniofacial structures and upper-airway dimension. Angle Orthod. 72:43–7. https://pubmed.ncbi.nlm.nih.gov/11843272/. DOI: 10.1043/0003-3219(2002)072<0043:EOMPOC>2.0.CO;2. PMID: 11843272.
21. Staudt CB, Gnoinski WM, Peltomäki T. 2013; Upper airway changes in Pierre Robin sequence from childhood to adulthood. Orthod Craniofac Res. 16:202–13. https://doi.org/10.1111/ocr.12019. DOI: 10.1111/ocr.12019. PMID: 23350818.
crossref
22. Zheng ZH, Yamaguchi T, Kurihara A, Li HF, Maki K. 2014; Three-dimensional evaluation of upper airway in patients with different anteroposterior skeletal patterns. Orthod Craniofac Res. 17:38–48. https://doi.org/10.1111/ocr.12029. DOI: 10.1111/ocr.12029. PMID: 24033888.
crossref
23. Zhong Z, Tang Z, Gao X, Zeng XL. 2010; A comparison study of upper airway among different skeletal craniofacial patterns in nonsnoring Chinese children. Angle Orthod. 80:267–74. https://pubmed.ncbi.nlm.nih.gov/19905851/. DOI: 10.2319/030809-130.1. PMID: 19905851. PMCID: PMC8973238.
crossref
24. Ingman T, Nieminen T, Hurmerinta K. 2004; Cephalometric comparison of pharyngeal changes in subjects with upper airway resistance syndrome or obstructive sleep apnoea in upright and supine positions. Eur J Orthod. 26:321–6. https://doi.org/10.1093/ejo/26.3.321. DOI: 10.1093/ejo/26.3.321. PMID: 15222718.
crossref
25. Pae EK, Lowe AA, Sasaki K, Price C, Tsuchiya M, Fleetham JA. 1994; A cephalometric and electromyographic study of upper airway structures in the upright and supine positions. Am J Orthod Dentofacial Orthop. 106:52–9. https://doi.org/10.1016/S0889-5406(94)70021-4. DOI: 10.1016/S0889-5406(94)70021-4. PMID: 8017350.
crossref
26. Moon IJ, Han DH, Kim JW, Rhee CS, Sung MW, Park JW, et al. 2010; Sleep magnetic resonance imaging as a new diagnostic method in obstructive sleep apnea syndrome. Laryngoscope. 120:2546–54. https://doi.org/10.1002/lary.21112. DOI: 10.1002/lary.21112. PMID: 21108433.
crossref
27. Martin SE, Mathur R, Marshall I, Douglas NJ. 1997; The effect of age, sex, obesity and posture on upper airway size. Eur Respir J. 10:2087–90. https://doi.org/10.1183/09031936.97.10092087. DOI: 10.1183/09031936.97.10092087. PMID: 9311508.
crossref
28. Kim S, Park E. 2020; Differences in height, weight, BMI, and obesity rate between 2018 Community Health and Korea National Health and Nutrition Examination Surveys. J Health Info Stat. 45:281–7. https://doi.org/10.21032/jhis.2020.45.3.281. DOI: 10.21032/jhis.2020.45.3.281.
crossref

Figure 1
A, Sample subject of the resting tongue position group. B, Sample subject of the low tongue position group, the red arrow shows the space that appears due to the low tongue position. Landmarks and reference planes: L1, sella (S); L2, posterior nasal spine (PNS); L3, the most inferior point of the soft palate; L4, the most anteroinferior point of the third cervical vertebra; and L5, the most anteroinferior point of the fourth cervical vertebra. C, Segmentation of the upper airway. D, Three-dimensional models of various segments of the upper airway.
kjod-53-5-317-f1.tif
Figure 2
Histogram of the distribution of subjects in the low tongue position (LTP) group. A, Subjects in the LTP group were not normally distributed. B, Log-normal distribution of the subjects in the LTP group.
SD, standard deviation.
kjod-53-5-317-f2.tif
Figure 3
Column graph of mean differences among the RTP group and LTP subgroups. Statistical analysis from one-way ANOVA. Lowercase letters a and b indicate significant (P < 0.05) intra-class differences in the post-hoc analysis.
RTP, resting tongue positon; LTP, low tongue position; ANOVA, analysis of variance.
kjod-53-5-317-f3.tif
Table 1
Number of subjects and grouping criteria for each group after log-transformation
Q1 (n = 15) Q2 (n = 27) Q3 (n = 41) Q4 (n = 13)
Log-transformed range (log) ≤ (μ − 1*σ) (μ − 1*σ) − μ μ~(μ + 1*σ) > (μ + 1*σ)
Intra-oral space range (mm3) (206.84, 1,574.98] (1,574.98, 3,604.72] (3,604.72, 8,250.26] (8,250.26, 19,232.60]

Intra-oral space range = exp (log-transformed range).

μ, average value of log-transformed intra-oral space volume; σ, standard deviation of log-transformed intra-oral space volume; exp, exponential function.

Table 2
Demographic data of the resting tongue position group and low tongue position group
Overall RTP group (n = 98) LTP group (n = 96) P value
Age 0.197*
Mean ± SD 25.6 ± 9.1 24.1 ± 6.9
Min–Max 18–58 18–48
Median 38 33
95% CI 23.8–27.5 22.7–25.5
Sex (%) 0.253
Male 42 (42.9) 49 (51.0)
Female 56 (57.1) 47 (49.0)
ANB (°) 0.138*
Mean ± SD 2.0 ± 3.7 1.2 ± 3.5
Min–Max −6 to 10 −6.5 to 8
95% CI 1.3–2.7 0.5–1.9
SN-MP (°) 0.975*
Mean ± SD 35.7 ± 5.7 35.7 ± 6.7
Min–Max 38.5–50 21–51
95% CI 34.4–36.8 34.3–37.0
ODI 0.168*
Mean ± SD 70.3 ± 9.8 68.3 ± 10.1
Min–Max 43–92 29–98
95% CI 68.3–72.3 66.3–70.3
PP-MP (°) 0.905*
Mean ± SD 25.1 ± 5.6 25.2 ± 6.0
Min–Max 6–38 7–38
95% CI 24.0–26.4 24.0–26.5
FMA (°) 0.741*
Mean ± SD 26.8 ± 5.1 27.0 ± 5.9
Min–Max 10–40 12–39.5
95% CI 25.7–27.8 25.8–28.2

RTP, resting tongue position; LTP, low tongue position; SD, standard deviation; Min, minimum; Max, maximum; CI, confidence intervals; ANB, A point-nasion-B point angle; SN-MP, sella-nasion plane to mandibular plane angle; ODI, overbite depth indicator; PP-MP, palatal plane to mandibular plane angle; FMA, Frankfort-mandibular plane angle.

*One-way ANOVA P value, chi-square P value, P < 0.05.

Table 3
The mean differences in upper airway dimensions between the RTP group and LTP group
RTP group (n = 98) LTP group (n = 96) Mean difference (95% CI) P value
ACA (mm2)
Nasopharynx 350.9 ± 92.2 342.7 ± 89.5 8.2 (−17.5 to 33.9) 0.531
Retropalatal 334.3 ± 133.1 343.6 ± 118.3 −9.3 (−44.9 to 26.4) 0.610
Retroglossal 302.1 ± 135.1 294.1 ± 106.5 8.0 (−26.4 to 42.5) 0.646
Hypopharynx 369.4 ± 116.1 368.3 ± 109.4 1.1 (−30.5 to 33.0) 0.948
MCA (mm2)
Retropalatal 254.2 ± 133.4 253.8 ± 118.6 0.4 (−35.3 to 36.2) 0.981
Retroglossal 243.1 ± 120.4 230.2 ± 97.8 12.9 (−18.2 to 44.0) 0.413
Hypopharynx 276.3 ± 114.1 277.7 ± 110.7 −1.4 (−33.3 to 30.4) 0.930
Volume (mm3)
Nasopharynx 7,097.9 ± 2,173.0 6,958.5 ± 1,980.1 139.4 (−449.6 to 728.5) 0.641
Retropalatal 8,607.4 ± 3,640.5 8,935.9 ± 3,091.4 −328.5 (−1,285.8 to 628.8) 0.499
Retroglossal 8,777.7 ± 4,342.8 8,639.2 ± 3,944.4 138.6 (−1,037.0 to 1,314.1) 0.816
Hypopharynx 6,203.6 ± 2,120.7 6,289.8 ± 2,098.6 −86.2 (−683.8 to 511.4) 0.776

Values are presented as mean ± standard deviation.

Difference = RTP − LTP.

RTP, resting tongue position; LTP, low tongue position; ACA, average cross-sectional area; MCA, minimum cross-sectional area; CI, confidence intervals.

Significance analysis from independent t test, P < 0.05.

Table 4
The mean differences in upper airway dimensions between the resting tongue position group and low tongue position separated groups
Measurements RTP group
(n = 98)
LTP group (n = 96) Mean (95% CI) P value
Q1 (n = 15) Q2 (n = 27) Q3 (n = 41) Q4 (n = 13)
ACA (mm2)
Nasopharynx 350.9 ± 92.2 337.4 ± 81.2 323.1 ± 78.8 346.2 ± 102.7 378.4 ± 69.3 346.8 (334.0–359.7) 0.440
Retropalatal 334.3 ± 133.1a 297.1 ± 131.7a 325.9 ± 111.9a 342.0 ± 102.4a 438.6 ± 123.3b 338.9 (321.1–356.7) 0.034*
Retroglossal 302.1 ± 135.1a 273.1 ± 114.6a 284.4 ± 110.6a 278.1 ± 82.0a 389.1 ± 118.6b 298.2 (281.0–315.4) 0.048*
Hypopharynx 369.4 ± 116.1 371.1 ± 165.4 348.9 ± 102.8 355.5 ± 73.5 445.9 ± 118.4 368.9 (352.9–384.8) 0.110
MCA (mm2)
Retropalatal 254.2 ± 133.4a 212.8 ± 116.8a 244.6 ± 122.8a 240.2 ± 97.9a 363.1 ± 122.3b 254.0 (236.2–271.9) 0.016*
Retroglossal 243.1 ± 120.4 205.9 ± 101.0 224.9 ± 102.6 216.6 ± 79.1 312.1 ± 106.8 236.7 (221.2–252.2) 0.051
Hypopharynx 276.3 ± 114.2 274.4 ± 153.8 269.0 ± 105.1 259.7 ± 84.5 356.8 ± 116.8 277.0 (261.1–292.9) 0.101
Volume (mm3)
Nasopharynx 7,097.9 ± 2,173.0 6,787.9 ± 1,704.1 6,622.9 ± 1,826.4 7,001.5 ± 2,270.0 7,716.5 ± 1,526.1 7,028.9 (6,735.0–7,322.8) 0.600
Retropalatal 8,607.4 ± 3,640.5a 8,017.7 ± 3,554.3a 8,388.2 ± 3,082.8a 8,799.2 ± 2,536.8a 11,563.9 ± 3,098.6b 8,769.9 (8,292.0–9,247.9) 0.035*
Retroglossal 8,777.7 ± 4,342.8a 7,815.2 ± 4,420.3a 8,350.0 ± 3,704.2a 7,880.0 ± 2,915.8a 12,585.0 ± 4,736.2b 8,709.2 (8,122.9–9,295.5) 0.006**
Hypopharynx 6,203.6 ± 2,120.7 6,402.9 ± 2,828.1 5,895.1 ± 2,199.0 6,117.7 ± 1,547.1 7,522.0 ± 2,228.4 6,246.3 (5,948.2–6,544.3) 0.214

Values are presented as mean ± standard deviation.

RTP, resting tongue position; LTP, low tongue position; CI, confidence intervals; ACA, average cross-sectional area; MCA, minimum cross-sectional area.

a, bSignificant intraclass differences in the post-hoc analysis.

Significance analysis from ANOVA, *P < 0.05, **P < 0.01.

Table 5
Summary of regression analysis results of the effects of age, sex, ANB, SN-MP, ODI, PP-MP, and FMA on the upper airway
P value R2
ACA (mm2)
Nasopharynx 0.133 0.129
Retropalatal 0.004 0.220
Retroglossal < 0.001 0.379
Hypopharynx 0.001 0.260
MCA (mm2)
Retropalatal < 0.001 0.303
Retroglossal < 0.001 0.400
Hypopharynx < 0.001 0.307
Volume (mm3)
Nasopharynx 0.737 0.056
Retropalatal 0.004 0.224
Retroglossal < 0.001 0.375
Hypopharynx < 0.001 0.399

ACA, average cross-sectional area; MCA, minimum cross-sectional area; R2, coefficient of determination.

See Table 2 for definitions of measurement.

Significance analysis from regression analysis, P < 0.05.

TOOLS
Similar articles