Journal List > J Rheum Dis > v.30(4) > 1516083908

Koh, Lee, and Kim: Changes in the cholesterol profile of patients with rheumatoid arthritis treated with biologics or Janus kinase inhibitors

Abstract

Objective

To assess the effects of biological and targeted synthetic disease-modifying antirheumatic drugs (DMARDs) on lipid profiles in patients with moderate-to-severe rheumatoid arthritis (RA).

Methods

This retrospective single-center observational study included patients with RA taking a tumor necrosis factor-α inhibitor (TNFi), abatacept, tocilizumab, or a Janus kinase inhibitor (JAKi) for at least 6 months. Changes in lipid profile were assessed at 6 months after the start of treatment, and associations between changes in lipid profiles and clinical efficacy, concomitant medications, and comorbidities were evaluated.

Results

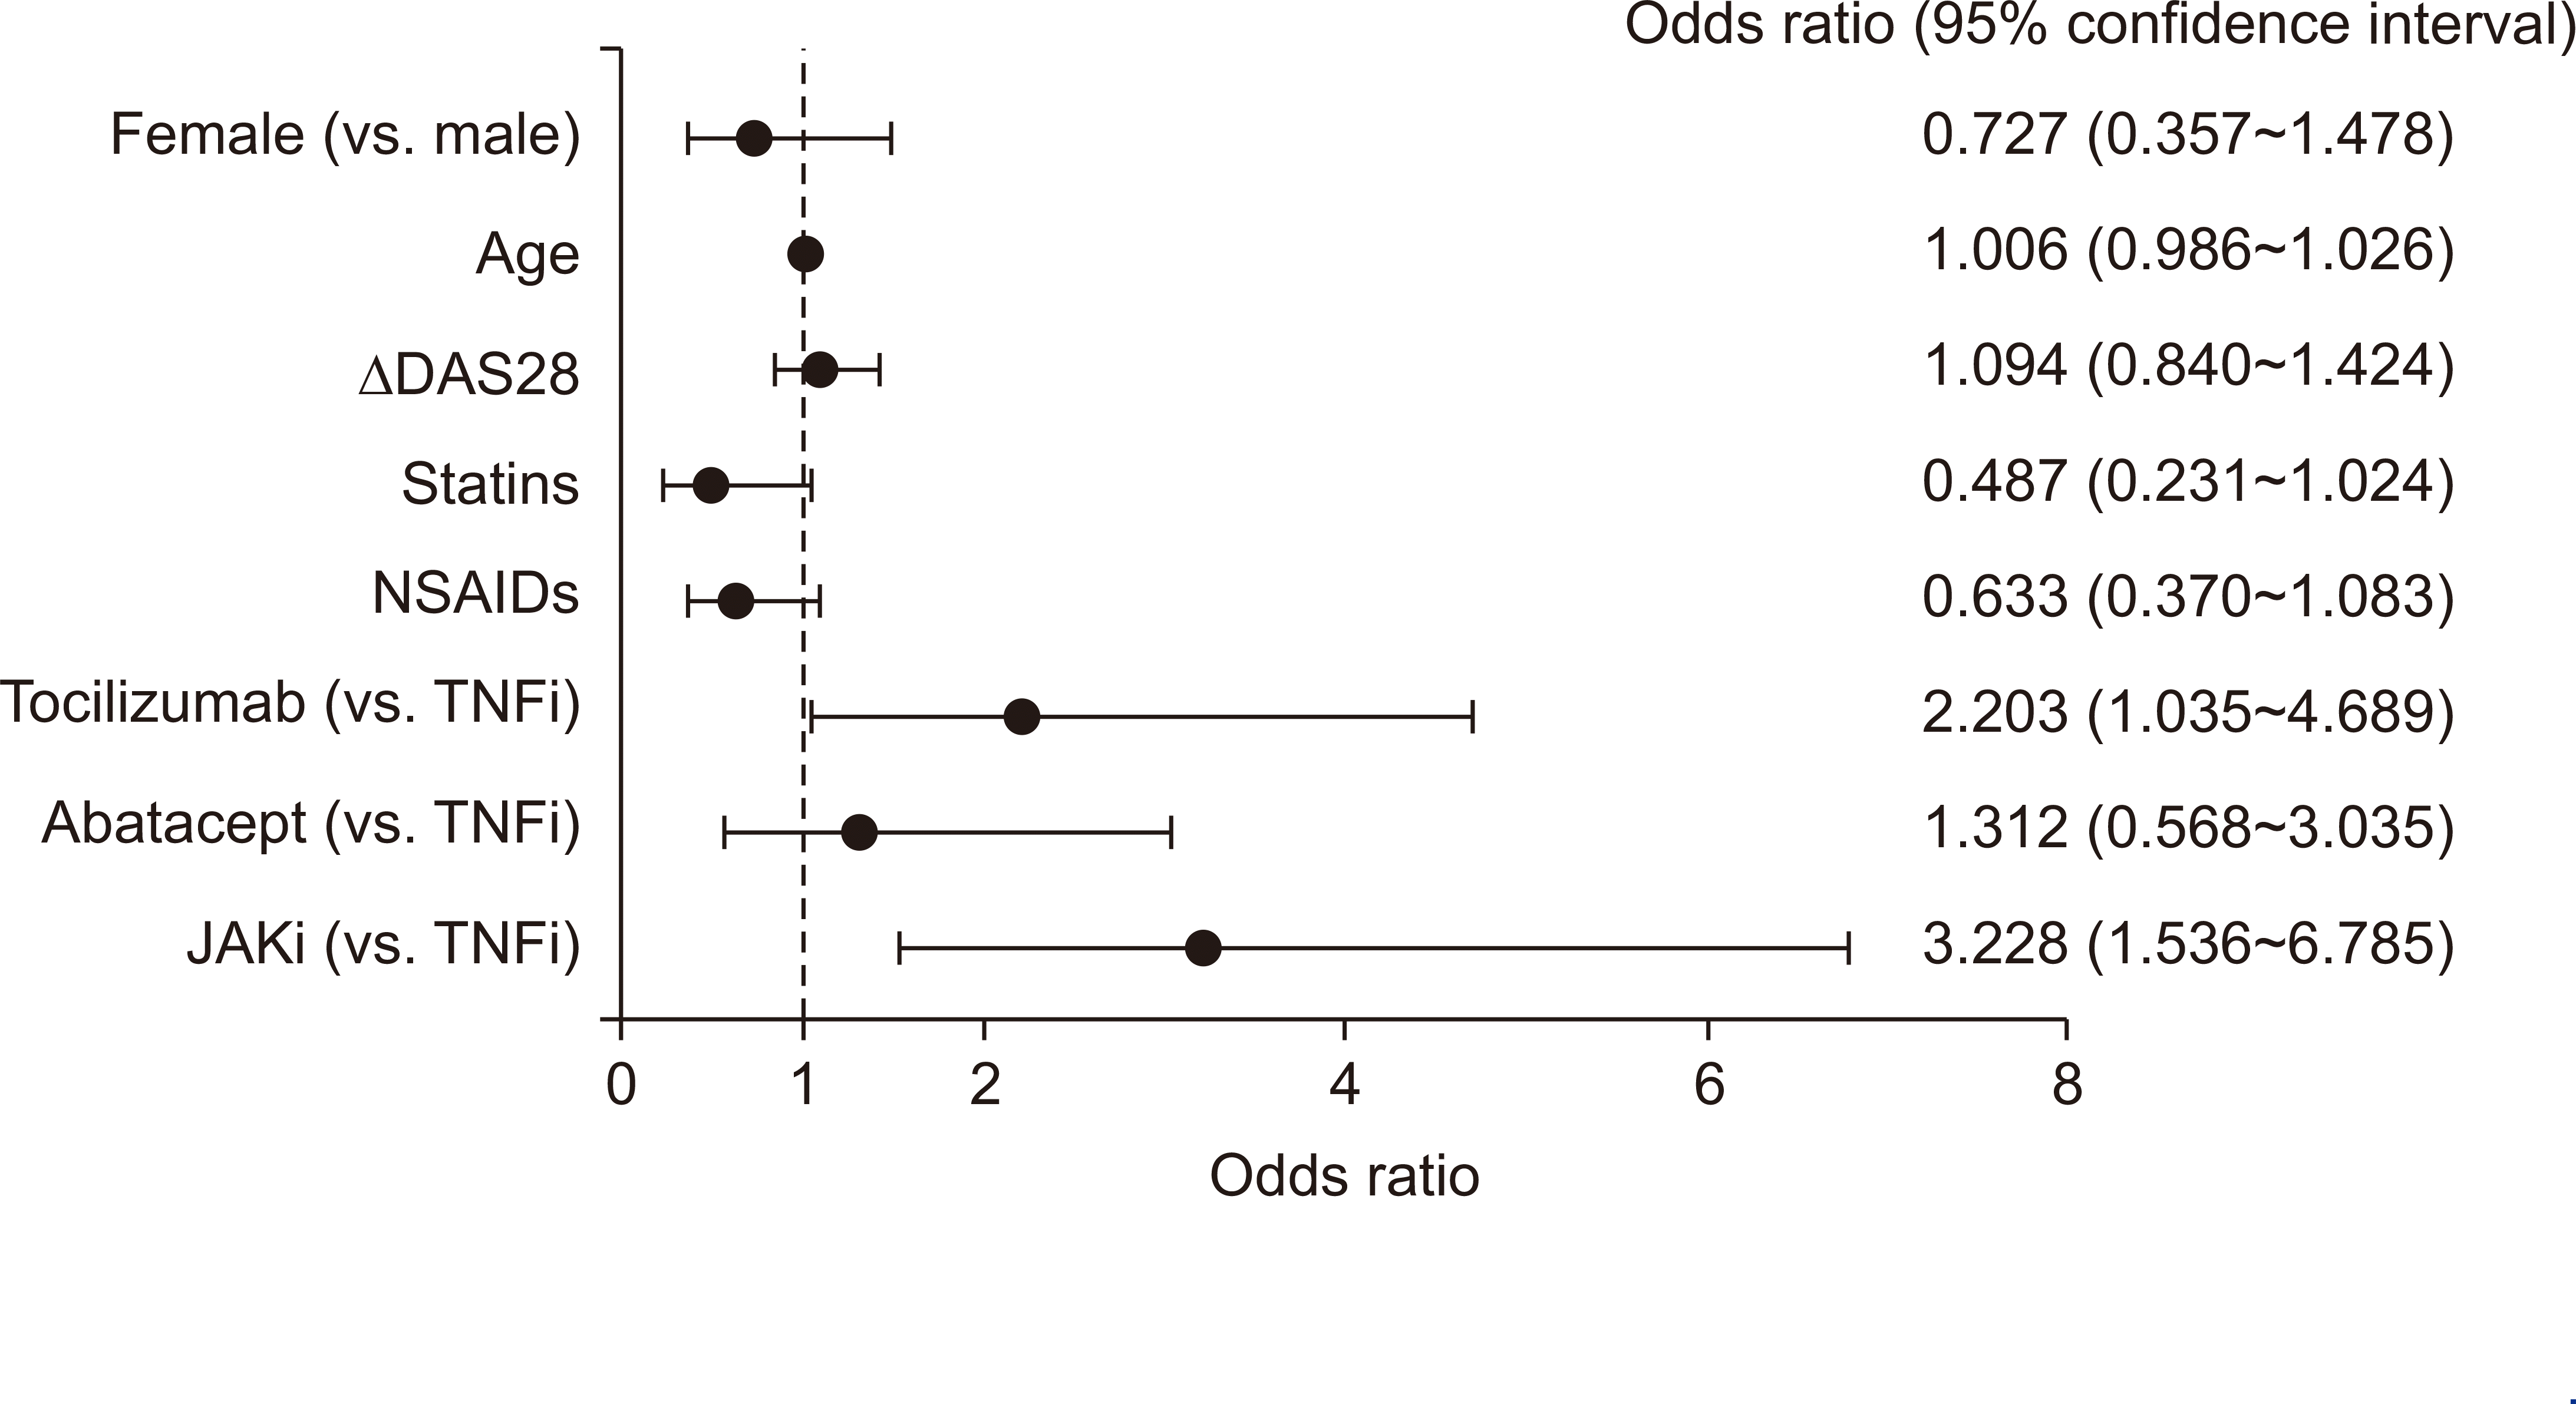
This study included 114 patients treated with TNFi, 81 with abatacept, 103 with tocilizumab, and 89 with JAKi. The mean percentage change (from baseline to 6 months) in total cholesterol, low-density lipoprotein cholesterol (LDL-C), high-density lipoprotein cholesterol (HDL-C), and non-HDL-C levels was higher in those taking tocilizumab and JAKi than in those taking TNFi and abatacept. A significant change in non-HDL-C was associated with JAKi (versus TNFi odds ratio [OR], 3.228; 95% confidence interval [CI], 1.536~6.785), tocilizumab (versus TNFi OR, 2.203; 95% CI, 1.035~4.689), and statins (OR, 0.487; 95% CI, 0.231~1.024). However, changes in disease activity in 28 joints were not associated with a significant change in non-HDL-C.

Conclusion

Tocilizumab- and JAKi-associated increases in serum non-HDL-C levels were observed regardless of changes in disease activity. Statins are recommended for RA patients showing a significant increase in cholesterol levels after initiating biological and targeted synthetic DMARDs.

INTRODUCTION

Rheumatoid arthritis (RA) is a systemic inflammatory autoimmune disease that preferentially affects small joints. Compared with the general population, patients with RA have an increased risk of premature death [1,2]. Cardiovascular disease (CVD), caused mainly by atherosclerosis, has the greatest effect on mortality in patients with RA [3]. Traditional risk factors such as age, dyslipidemia, hypertension, obesity, lack of exercise, and diabetes mellitus, as well as inflammation caused by RA itself and some medications that target inflammation, increase the risk of CVD [3].
The Janus kinase (JAK) family comprises receptor-associated tyrosine kinases that play roles in important biological processes by acting as signaling molecules downstream of type I and type II cytokine receptors [4]. Janus kinase inhibitors (JAKi) are targeted synthetic disease-modifying antirheumatic drugs (DMARDs) that are approved by the US Food and Drug Administration, the European Medicines Agency, and the Korean Ministry of Food and Drug Safety for the treatment of RA. However, the results of a recent postmarketing ORAL Surveillance study, which compared tofacitinib (a JAKi) with tumor necrosis factor-α inhibitor (TNFi) therapy in older patients with RA who have cardiovascular risk factors, revealed that tofacitinib failed to demonstrate noninferiority for major adverse cardiovascular events (MACE) [5].
According to the ‘lipid paradox in RA,’ patients with severe, untreated RA have lower cholesterol levels, but the risk of CVD is high [6]. However, although treatment of active RA can lead to elevated levels of total cholesterol (TC), low-density lipoprotein cholesterol (LDL-C), and high-density lipoprotein cholesterol (HDL-C), in conjunction with reduced levels of inflammation, the risk of CVD is low [6]. JAKi and TNFi effectively reduce inflammation and increase serum lipid levels [7-9]. However, the incidence of MACE is different [5]. One possible explanation may be the degree of cholesterol increase. In a clinical trial, JAKi-treated patients showed greater increases in LDL-C and HDL-C than those treated with adalimumab [10].
Slow accumulation of LDL and other apo B-containing lipoproteins in the arterial wall during young adulthood and middle age increase the total atherosclerotic burden [11]. Non-HDL-C includes all the cholesterol in all atherogenic lipoprotein particles, a combination of LDL-C, very low-density lipoprotein cholesterol (VLDL-C), VLDL remnants, and lipoprotein(a) [12,13]. LDL-C is the dominant form of atherogenic cholesterol, however, non-HDL-C is more atherogenic than either lipoprotein alone [12]. Many studies demonstrate that non-HDL-C can predict the risk of fatal or non-fatal ASCVD [13-15]. Moreover, fasting is not required for the calculation of non-HDL-C [16]. Surprisingly, there are few real-world data regarding changes in non-HDL-C in individuals taking biological or targeted synthetic DMARDs.
In this study, we focused on the association between lipid profile changes in patients with RA. To investigate whether JAKi increases cholesterol levels more than biological DMARDs, we compared changes in cholesterol between patients receiving different biological or targeted synthetic DMARDs (b/tsDMARDs). We also identified factors associated with increases in non-HDL-C after treatment with b/tsDMARDs.

MATERIALS AND METHODS

Patients

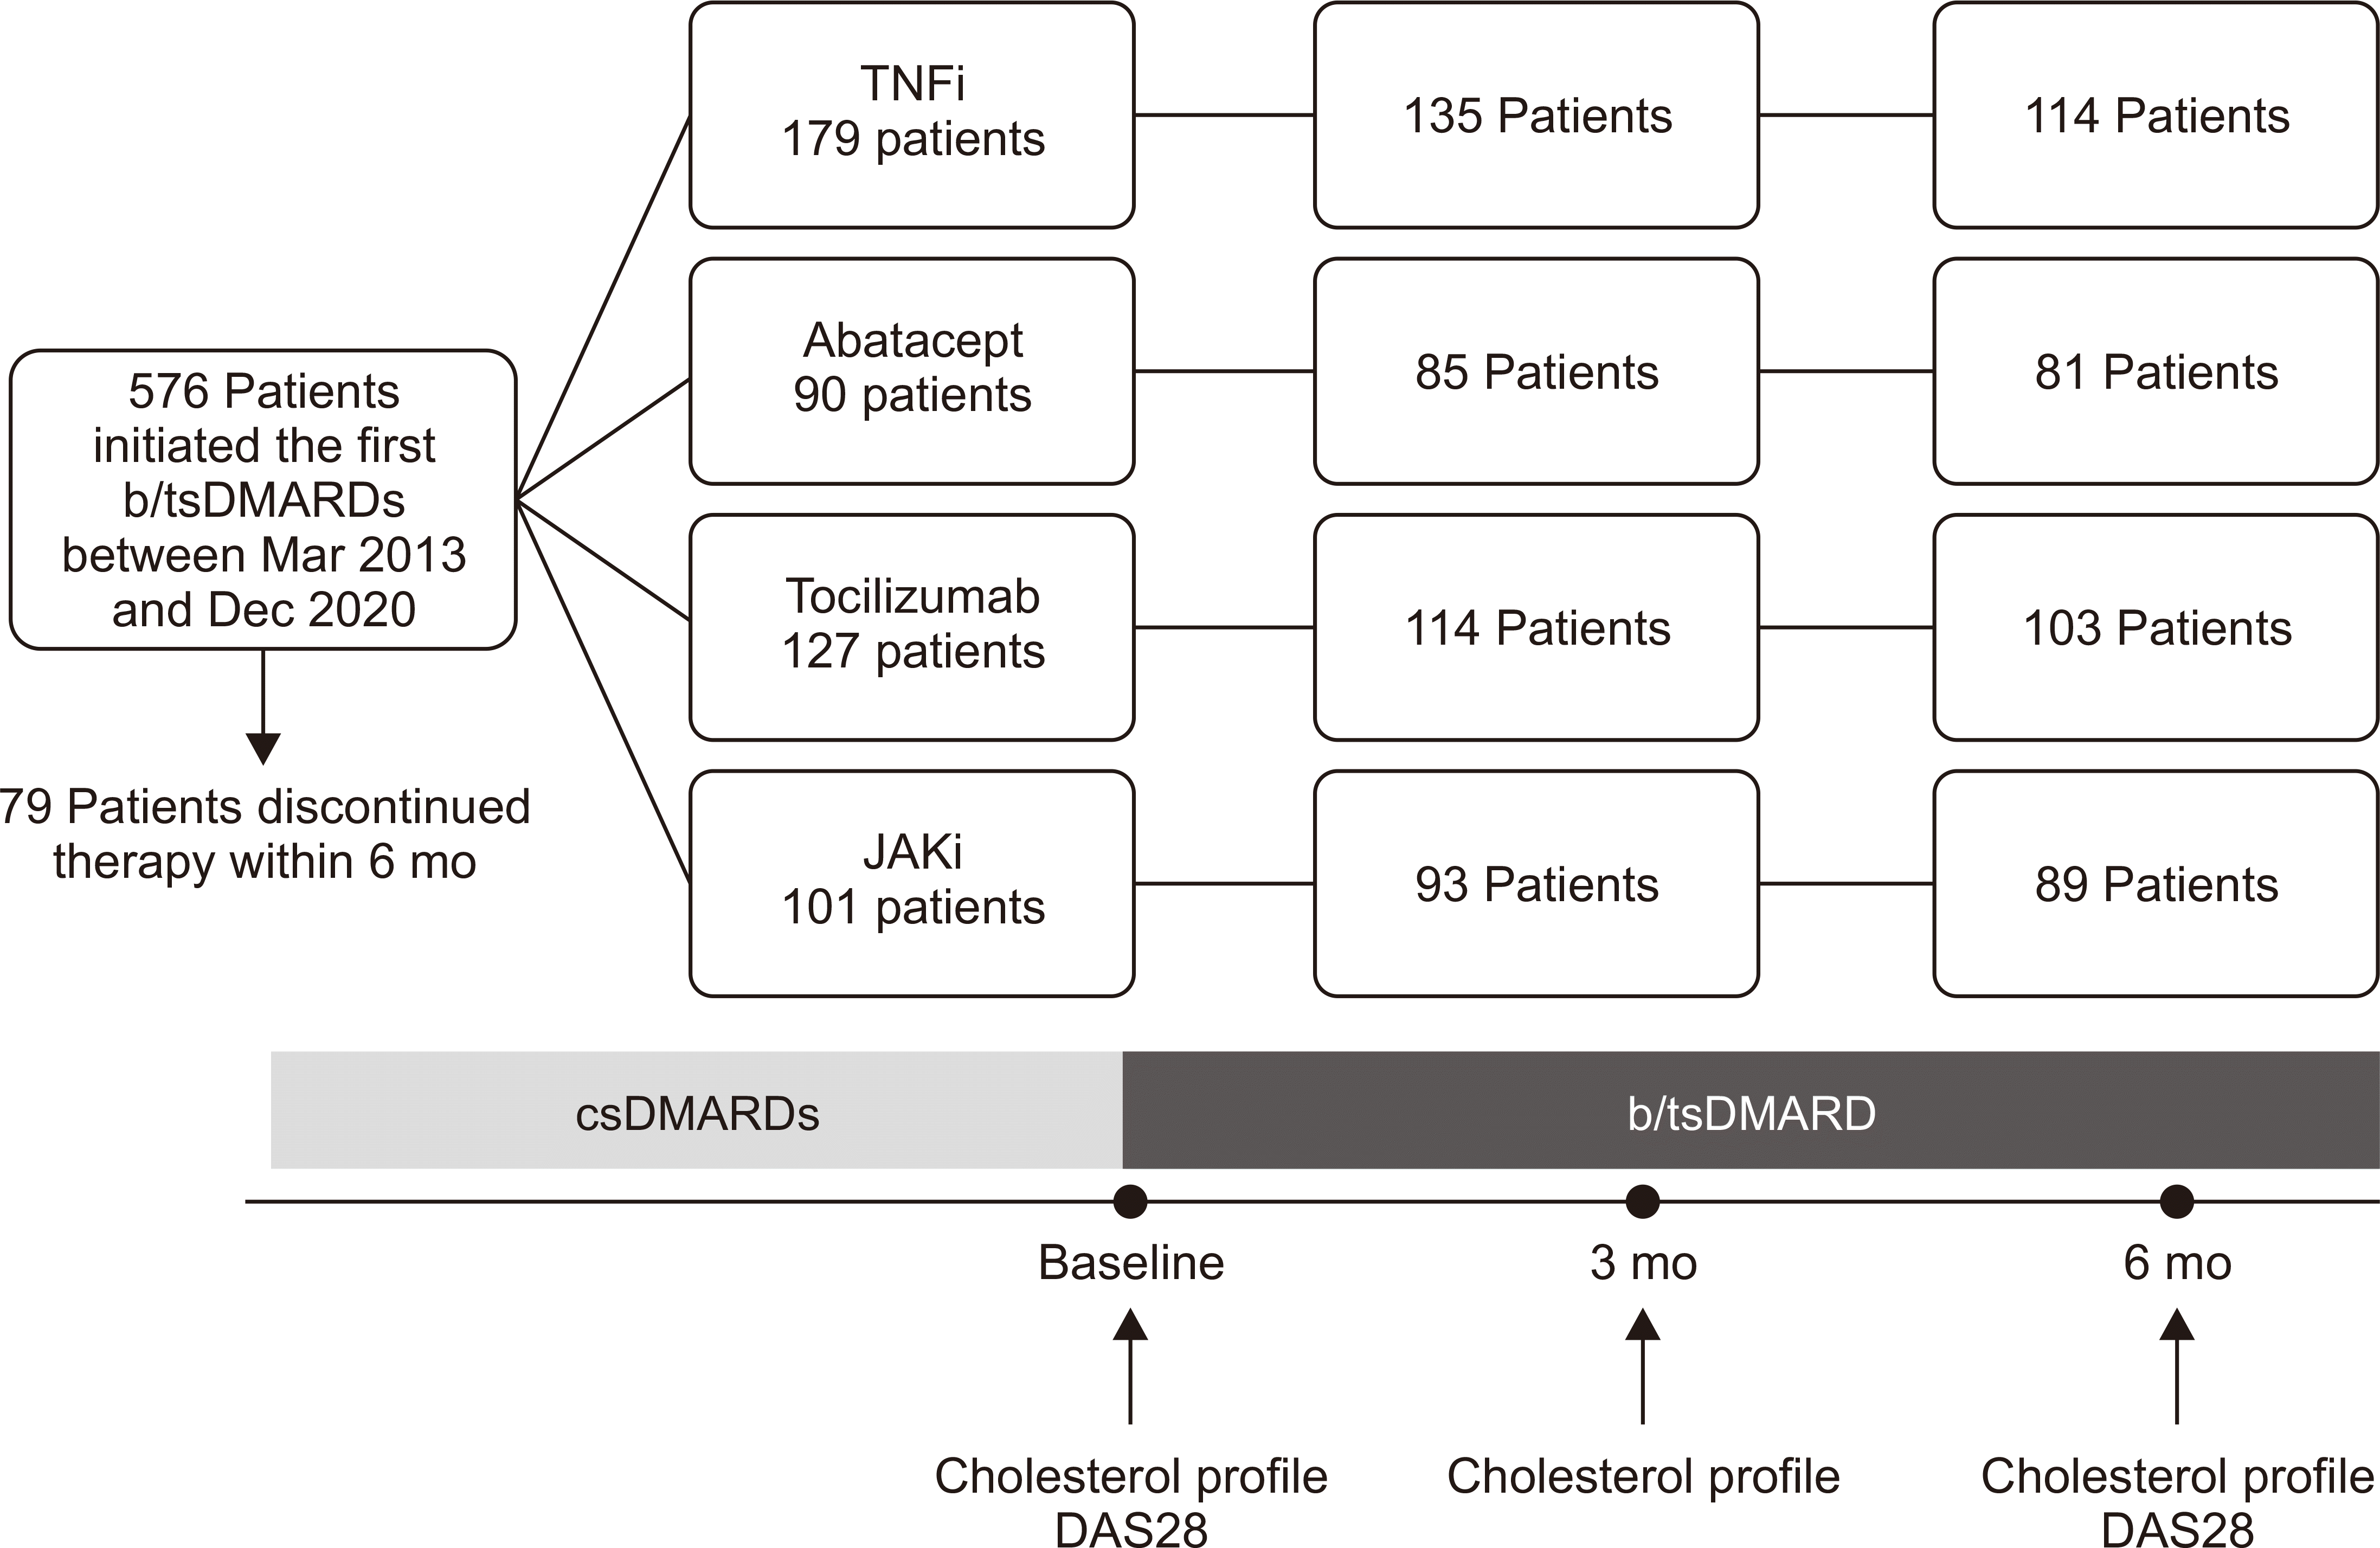
This retrospective study included patients treated at Seoul St. Mary’s Hospital. A total of 576 patients with RA began treatment with b/tsDMARDs between January 1, 2013 and December 31, 2020 (all were b/tsDMARDs-naïve prior to this). All patients were adults (≥20 years) who met the 2010 American College of Rheumatology (ACR)/European League Against Rheumatism (EULAR) classification criteria for RA [17]. All had active, moderate-to-severe RA (disease activity score in 28 joints [DAS28] >5.1) and had been treated for more than 6 months with two or more conventional synthetic DMARDs (csDMARDs), including methotrexate, unless they experienced adverse events or were contraindicated. These patients had follow-up assessments at 6 months, as required for continuation of national health insurance cover. Patients who did not have lipid profiles at 6 months were excluded from the analysis; 387 patients were finally included in this study (Figure 1).
In this study, patients received infliximab or its biosimilar agent, etanercept, adalimumab (a TNFi), tocilizumab (an interleukin [IL]-6 receptor inhibitor), abatacept (a T cell costimulatory blocker), or tofacitinib/baricitinib (a JAKi). Patients were classified into four treatment groups according to the mechanism of action of the b/tsDMARDs.

Ethical approval

This study was approved by the IRB of Seoul St. Mary’s Hospital (approval number: KC22RISI0953). Informed consent was waived for this retrospective study and patient information was anonymized and de-identified prior to analysis. The study was performed in accordance with the Declaration of Helsinki.

Variables

Data from the standard lipid profile (LDL-C, HDL-C, TC, and triglycerides) at baseline, 3 months (if available), and at 6 months follow-up were extracted from the hospital database. Non-HDL-C was calculated as non-HDL-C=TC−HDL-C. The level of LDL-C was measured in 89.7% of patients; and in patients who were not measured, LDL-C was calculated using the Friedewald equation, total cholesterol−HDL-C−(triglyceride/5). The measured and calculated values showed excellent reliability (intraclass coefficient, 0.855; 95% confidence interval [CI], 0.813~0.886: Cronbach's α=0.927).
The main demographic variables were age, sex, disease duration, comorbidities, presence of rheumatoid factor, and presence of anticyclic citrullinated peptide antibodies (ACPA). At the time of b/tsDMARDs initiation, RA disease activity was measured using the DAS28-erythrocyte sedimentation rate (ESR), and then again at the 6-month follow-up visit. Treatment response at 6 months was assessed using the DAS28-ESR and the EULAR response criteria [18]. Comedications, including non-steroidal anti-inflammatory drugs (NSAIDs), statins, glucocorticoids, and csDMARDs, were also reviewed.
There are no RA-specific recommendations for CVD risk prediction in Korea [19]. As the prevalence of CVD in patients with RA is increased to an extent that is comparable to that of patients with diabetes mellitus [3,4], RA was regarded as a borderline risk group. Hyper-LDL-cholesterolemia was defined as a serum LDL-C ≥130 mg/dL. Hypo-HDL-cholesterolemia was defined as a serum HDL-C level <40 mg/dL. Hypertriglyceridemia was defined as a serum triglyceride level ≥150 mg/dL. Dyslipidemia was then defined as satisfying one of the definitions stated above [19].
Some LDL-C levels were calculated, and fasting and hypertriglyceridemia could affect the result. However, the CVD risk associations of non-HDL-C are similar in the non-fasting and fasting population [20]. A significant increase in non-HDL-C was defined as ≥30%, as statins with moderate intensity are supposed to reduce LDL-C by 30% to 50% [12], and each statin induces equal reductions in LDL-C and non-HDL-C.

Statistical analysis

Demographic and disease characteristics are expressed as the mean±standard deviation or as a percentage (%). The levels of TC, LDL-C, HDL-C, triglycerides, and non-HDL-C are expressed as the mean percentage change from baseline; the treatment groups were compared using the analysis of variance (ANOVA), followed by post hoc analysis (the Tukey and Scheffe Method). The significance of the differences in DAS28, TC, LDL-C, HDL-C, triglycerides, and non-HDL-C between groups was analyzed using the Wilcoxon rank-sum test. The effects of clinical variables associated with a significant increase in non-HDL-C were estimated using binary logistic regression analyses. Model assumptions were checked using residual analysis. The results of these analyses are presented as odds ratios (ORs), with 95% CIs.
All p-values are two-sided, with p<0.05 considered statistically significant. SAS 9.4 (SAS Institute, Cary, NC, USA) software was used for data analysis, and graphs were drawn using GraphPad Prism 9.5 (GraphPad Software, San Diego, CA, USA).

RESULTS

Study characteristics

This study included 114 patients treated with TNFi, 81 with abatacept, 103 with tocilizumab, and 89 with JAKi (Figure 1). The baseline characteristics are listed in Table 1. Hypertension was less common comorbidities in the TNFi group than in the other groups, and type 2 diabetes mellitus was less common in the TNFi group than abatacept group.
Methotrexate in combination with abatacept was prescribed less frequently than methotrexate in combination with TNFi and JAKi (p<0.001 and 0.018, respectively). Similarly, methotrexate was prescribed less frequently for patients taking tocilizumab than for patients taking TNFi (p=0.04). Use of leflunomide in combination with TNFi was less common than in combination with abatacept and JAKi (p=0.006 and 0.038, respectively). Patients who started tocilizumab showed greater use of oral glucocorticoids than those who started JAKi (p=0.042).
Only 2.3% of patients did not respond to b/tsDMARDs at 6 months. There were more nonresponders in the group treated with TNFi than the group treated with JAKi (5.3% vs. 0%, respectively; p=0.028). The change in DAS28 was greater in patients treated with tocilizumab than in those treated with other agents.
Statins were prescribed to 55 patients (14.3%) prior to starting b/tsDMARDs; 17 patients began taking statins after starting b/tsDMARDs treatment.

Changes in the lipid profile

We found that TC, triglyceride, LDL-C, and non-HDL-C increased significantly in all of patients not taking statins (Table 2). There was no difference in lipid profile for each agent in TNFi and JAKi. The percentage change in TC and HDL-C showed a modest correlation with changes in the DAS28 (r= -0.141, p=0.014; and r=-0.138, p=0.016, respectively), and with changes in the CRP (r=-0.109, p<0.001 and r=-0.210, p<0.001). However, the percentage change in LDL-C and non-HDL-C did not correlate with changes in the DAS28 and CRP.
The percentage increase in TC was significantly higher in JAKi and tocilizumab users than in TNFi and abatacept users, respectively (Table 2). With respect to LDL-C and HDL-C, the increase in patients taking JAKi was greater than that in those taking TNFi and abatacept. In addition, the increase in non-HDL-C levels was higher in patients taking tocilizumab than that in those taking TNFi. The increase in HDL-C levels was higher in JAKi users than in TNFi and abatacept users. There was no significant difference between the treatment groups with respect to changes in triglycerides (Table 2).
At the 6-month follow-up, dyslipidemia occurred in 36.4% of patients. High non-HDL-C levels (≥160 mg/dL) were measured in 19.7% of patients, and high LDL-C levels (≥130 mg/dL) were measured in 23% of patients. Of the patients with dyslipidemia, only 15.6% started statin therapy.

Factors associated with a significant change in non-HDL-C

Multivariate analyses identified tocilizumab and JAKi as being associated with a significant increase in non-HDL-C when compared with TNFi (OR, 2.203; 95% CI, 1.035~4.689 for tocilizumab; OR, 3.228; 95% CI, 1.536~6.785 for JAKi). There was no association between changes in the DAS28, or combined use of csDMARDs, and increased non-HDL-C levels. However, concomitant use of statins was associated with a smaller increase (OR, 0.487; 95% CI, 0.231~1.024; p=0.058) (Figure 2).

DISCUSSION

As far as we know, this paper presents the first real-world data to simultaneously compare early changes in cholesterol profile in patients treated with one of the four clinically approved b/tsDMARDs as a first-line targeted therapy for RA. We demonstrate that JAKi and tocilizumab increase TC, LDL-C, non-HDL-C, and HDL-C levels to a greater extent than TNFi and abatacept.
Patients treated with tocilizumab and JAKi showed a significant increase in non-HDL-C when compared with patients treated with TNFi. This result is in agreement with those previously reported in randomized controlled trials [10,21]. TNF-α and IL-6 are inflammatory cytokines that have an atherogenic effect on endothelial cells [22,23]. Binding of TNF-α to its receptor triggers several signaling pathways, including nuclear factor κB (NF-κB), mitogen-activated protein kinases (MAPKs), and proteases [24]. IL-6 exerts its biological effects by binding to the IL-6 receptor, activating signal transduction via the Janus kinase-signal transducers and activators of the transcription factors (JAK-STAT) pathway and the Ras-MAPK pathway [25]. TNF-α and IL-6 receptor antagonists inhibit oxidized LDL-induced production of monocyte chemoattractant protein-1 (MCP-1), which plays a crucial role in the pathogenesis of inflammatory diseases and atherosclerosis [26,27]. However, blockade of each of these cytokines increases cholesterol levels by different degrees.
Here, we found that tocilizumab and JAKi resulted in a similar increase in cholesterol levels. Both agents affect the JAK-STAT pathway. Lipid metabolism is regulated by activation of the JAK-STAT signaling pathway in adipocytes [28]. IL-6 and JAKs are associated with STAT3, the most prominent transcription factor recruited to gp130 [29]. STAT3 promotes lipolysis and inhibits adipogenesis in mature adipocytes, as well as differentiation of preadipocytes [30], and activation of lipolysis in adipocytes increases HDL-C [31]. Therefore, inhibition of the STAT3 signaling pathway may block conversion of cholesterol to HDL, which is associated with an overall increase in non-HDL-C. Another study showed that cholesterol ester catabolism is higher in patients with RA, resulting in increased HDL-C, LDL-C, and TC [32]. Following tofacitinib treatment, the rate of cholesterol ester catabolism decreased, and cholesterol levels increased [32].
Abatacept modulates the costimulation of T lymphocytes. There are few data on the effects of abatacept on lipid profiles. A phase IIIb trial of abatacept combined with methotrexate versus adalimumab plus methotrexate revealed that those two combination therapies are associated with improvement in HDL function, despite increases in cholesterol levels [33]. A long-term observational study showed that abatacept and TNFi reduced the risk of CVD to a greater extent than csDMARD, whereas tocilizumab and tofacitinib did not [34]. Both TNFi and abatacept reduced inflammation while not increasing non-HDL-C levels significantly (compared with tocilizumab and JAKi), which may have helped to prevent CVD.
We found that in the real world, statins were prescribed to few patients. This may be due to passive control of high cholesterol levels following treatment of b/tsDMARDs, resulting from belief in the ‘lipid paradox in RA’ [35]. However, cholesterol is still the primary cause of atherosclerosis, which occurs in conjunction with inflammation [36]. Even in the young population, mildly abnormal lipid levels are associated with an increased future risk of atherosclerotic CVD events [37]. Our data also demonstrate that the level of TC and HDL-C increases as RA disease activity decreases. However, changes in non-HDL-C and LDL-C, which are crucial for atherogenesis [12,15], did not correlate with disease activity. Therefore, lipid-lowering therapy should be considered for RA patients showing a significant increase in cholesterol levels after treatment with b/tsDMARDs. Statins have beneficial effects beyond their lipid-lowering activities, including anti-inflammatory and proapoptosis effects on cultured RA synoviocytes [38]. Maintaining low LDL-C or non-HDL-C levels by treatment with statins may reduce the CVD risk in patients with RA.
This study has several limitations. First, atherosclerotic CVD risk estimation, which estimates the risk of a non-fatal or fatal CVD event in the next 10 years [12], was not evaluated. Some of the items for the risk estimation were missing, and these items were difficult to retrieve in retrospective studies. Second, the long-term changes in lipid profiles were not reviewed. This study focused on the early change of lipid profiles after initiating b/tsDMARDs, Lipid profiles are recommended to recheck 2 to 4 months after the inflammatory disease has been under control [12]. The long-term effect of b/tsDMARDs on lipid profiles has been studied in Korea which showed no difference between b/tsDMARDs [39]. Third, it was difficult to compare CVD events during follow-up because the observational period for JAKi was relatively short; this agent has been used as a first-line b/tsDMARDs only since 2017. To better elucidate the relationship between b/tsDMARDs, dyslipidemia, and CVD event in patients with RA, a prospective long-term follow-up study of patients in whom onset of RA occurred at a younger age would better identify the relative roles of inflammation and cholesterol in development of CVD.

CONCLUSION

Patients treated with b/tsDMARDs show increased levels of TC, LDL-C, and HDL-C. A significant increase in non-HDL-C was associated with the type of agent. Increased non-HDL-C levels were not associated with a reduction in the DAS28. Our data suggest that lipid profile should be regularly monitored in RA patients treated with b/tsDMARD and that prescription of statins should be considered for RA patients showing a significant increase in cholesterol levels.

ACKNOWLEDGMENTS

This paper is an extended version of the abstract presented at EULAR 2023 (http://dx.doi.org/10.1136/annrheumdis-2023-eular.3636).

Notes

FUNDING

This work was supported by National Research Foundation of Korea grants funded by the Ministry of Science, ICT and Future Planning (Grant 2015R1A3A2032927 to W.U. Kim).

CONFLICT OF INTEREST

No potential conflict of interest relevant to this article was reported.

AUTHOR CONTRIBUTIONS

J.H.K.: Conceptualization, Data curation, Formal analysis; Investigation, Methodology, Writing - Original draft preparation, Writing - Reviewing and Editing. B.W.L.: Data curation, Formal analysis; Methodology, Investigation, Writing - Original draft preparation. W.U.K.: Conceptualization, Methodology, Resources, Funding acquisition, Writing - Reviewing and Editing, Supervision.

REFERENCES

1. Dadoun S, Zeboulon-Ktorza N, Combescure C, Elhai M, Rozenberg S, Gossec L, et al. 2013; Mortality in rheumatoid arthritis over the last fifty years: systematic review and meta-analysis. Joint Bone Spine. 80:29–33. DOI: 10.1016/j.jbspin.2012.02.005. PMID: 22459416.
crossref
2. Widdifield J, Paterson JM, Huang A, Bernatsky S. 2018; Causes of death in rheumatoid arthritis: how do they compare to the general population? Arthritis Care Res (Hoboken). 70:1748–55. DOI: 10.1002/acr.23548. PMID: 29512334.
crossref
3. Nurmohamed MT, Heslinga M, Kitas GD. 2015; Cardiovascular comorbidity in rheumatic diseases. Nat Rev Rheumatol. 11:693–704. DOI: 10.1038/nrrheum.2015.112. PMID: 26282082.
crossref
4. Schwartz DM, Kanno Y, Villarino A, Ward M, Gadina M, O'Shea JJ. 2017; JAK inhibition as a therapeutic strategy for immune and inflammatory diseases. Nat Rev Drug Discov. 16:843–62. Erratum in: Nat Rev Drug Discov 2017;17:78. DOI: 10.1038/nrd.2017.201. PMID: 29104284. PMCID: PMC6168198.
crossref
5. Ytterberg SR, Bhatt DL, Mikuls TR, Koch GG, Fleischmann R, Rivas JL, et al. 2022; Cardiovascular and cancer risk with tofacitinib in rheumatoid arthritis. N Engl J Med. 386:316–26. DOI: 10.1056/NEJMoa2109927. PMID: 35081280.
crossref
6. Robertson J, Peters MJ, McInnes IB, Sattar N. 2013; Changes in lipid levels with inflammation and therapy in RA: a maturing paradigm. Nat Rev Rheumatol. 9:513–23. DOI: 10.1038/nrrheum.2013.91. PMID: 23774906.
crossref
7. Kremer JM, Genovese MC, Keystone E, Taylor PC, Zuckerman SH, Ruotolo G, et al. 2017; Effects of baricitinib on lipid, apolipoprotein, and lipoprotein particle profiles in a phase IIb study of patients with active rheumatoid arthritis. Arthritis Rheumatol. 69:943–52. DOI: 10.1002/art.40036. PMID: 28029752.
crossref
8. Lee EB, Fleischmann R, Hall S, Wilkinson B, Bradley JD, Gruben D, et al. 2014; Tofacitinib versus methotrexate in rheumatoid arthritis. N Engl J Med. 370:2377–86. DOI: 10.1056/NEJMoa1310476. PMID: 24941177.
crossref
9. Pollono EN, Lopez-Olivo MA, Lopez JA, Suarez-Almazor ME. 2010; A systematic review of the effect of TNF-alpha antagonists on lipid profiles in patients with rheumatoid arthritis. Clin Rheumatol. 29:947–55. DOI: 10.1007/s10067-010-1405-7. PMID: 20383550.
crossref
10. van Vollenhoven RF, Fleischmann R, Cohen S, Lee EB, García Meijide JA, Wagner S, et al. 2012; Tofacitinib or adalimumab versus placebo in rheumatoid arthritis. N Engl J Med. 367:508–19. Erratum in: N Engl J Med 2013;369:293. DOI: 10.1056/NEJMoa1112072. PMID: 22873531.
crossref
11. Ference BA, Graham I, Tokgozoglu L, Catapano AL. 2018; Impact of lipids on cardiovascular health: JACC Health Promotion Series. J Am Coll Cardiol. 72:1141–56. DOI: 10.1016/j.jacc.2018.06.046. PMID: 30165986.
12. Grundy SM, Stone NJ, Bailey AL, Beam C, Birtcher KK, Blumenthal RS, et al. 2019; 2018 AHA/ACC/AACVPR/AAPA/ABC/ACPM/ADA/AGS/APhA/ASPC/NLA/PCNA guideline on the management of blood cholesterol: a report of the American College of Cardiology/American Heart Association Task Force on Clinical Practice Guidelines. Circulation. 139:e1082–143. Erratum in: Circulation 2019;139:e1182-6. DOI: 10.1161/CIR.0000000000000624. PMID: 30586774. PMCID: PMC7403606.
13. Langlois MR, Sniderman AD. 2020; Non-HDL cholesterol or apoB: which to prefer as a target for the prevention of atherosclerotic cardiovascular disease? Curr Cardiol Rep. 22:67. DOI: 10.1007/s11886-020-01323-z. PMID: 32562186.
crossref
14. Colantonio LD, Bittner V, Reynolds K, Levitan EB, Rosenson RS, Banach M, et al. 2016; Association of serum lipids and coronary heart disease in contemporary observational studies. Circulation. 133:256–64. DOI: 10.1161/CIRCULATIONAHA.115.011646. PMID: 26659948. PMCID: PMC4718875.
crossref
15. Brunner FJ, Waldeyer C, Ojeda F, Salomaa V, Kee F, Sans S, et al. 2019; Application of non-HDL cholesterol for population-based cardiovascular risk stratification: results from the Multinational Cardiovascular Risk Consortium. Lancet. 394:2173–83. Erratum in: Lancet 2019;394:2154. Erratum in: Lancet 2020;395:32. DOI: 10.1016/S0140-6736(19)32519-X. PMID: 31810609. PMCID: PMC6913519.
crossref
16. Nordestgaard BG, Langsted A, Mora S, Kolovou G, Baum H, Bruckert E, et al. 2016; Fasting is not routinely required for determination of a lipid profile: clinical and laboratory implications including flagging at desirable concentration cut-points-a joint consensus statement from the European Atherosclerosis Society and European Federation of Clinical Chemistry and Laboratory Medicine. Eur Heart J. 37:1944–58. DOI: 10.1093/eurheartj/ehw152. PMID: 27122601. PMCID: PMC4929379.
crossref
17. Aletaha D, Neogi T, Silman AJ, Funovits J, Felson DT, Bingham CO 3rd, et al. 2010; 2010 Rheumatoid arthritis classification criteria: an American College of Rheumatology/European League Against Rheumatism collaborative initiative. Arthritis Rheum. 62:2569–81. DOI: 10.1002/art.27584. PMID: 20872595.
crossref
18. van Gestel AM, Prevoo ML, van 't Hof MA, van Rijswijk MH, van de Putte LB, van Riel PL. 1996; Development and validation of the European League Against Rheumatism response criteria for rheumatoid arthritis. Comparison with the preliminary American College of Rheumatology and the World Health Organization/International League Against Rheumatism Criteria. Arthritis Rheum. 39:34–40. DOI: 10.1002/art.1780390105. PMID: 8546736.
crossref
19. Rhee EJ, Kim HC, Kim JH, Lee EY, Kim BJ, Kim EM, et al. 2019; 2018 Guidelines for the management of dyslipidemia in Korea. J Lipid Atheroscler. 8:78–131. DOI: 10.12997/jla.2019.8.2.78. PMID: 32821702. PMCID: PMC7379116.
crossref
20. Welsh C, Celis-Morales CA, Brown R, Mackay DF, Lewsey J, Mark PB, et al. 2019; Comparison of conventional lipoprotein tests and apolipoproteins in the prediction of cardiovascular disease. Circulation. 140:542–52. DOI: 10.1161/CIRCULATIONAHA.119.041149. PMID: 31216866. PMCID: PMC6693929.
crossref
21. Gabay C, McInnes IB, Kavanaugh A, Tuckwell K, Klearman M, Pulley J, et al. 2016; Comparison of lipid and lipid-associated cardiovascular risk marker changes after treatment with tocilizumab or adalimumab in patients with rheumatoid arthritis. Ann Rheum Dis. 75:1806–12. DOI: 10.1136/annrheumdis-2015-207872. PMID: 26613768. PMCID: PMC5036214.
crossref
22. Lee J, Lee S, Zhang H, Hill MA, Zhang C, Park Y. 2017; Interaction of IL-6 and TNF-α contributes to endothelial dysfunction in type 2 diabetic mouse hearts. PLoS One. 12:e0187189. DOI: 10.1371/journal.pone.0187189. PMID: 29095915. PMCID: PMC5667841.
crossref
23. Hashizume M, Mihara M. 2012; Atherogenic effects of TNF-α and IL-6 via up-regulation of scavenger receptors. Cytokine. 58:424–30. DOI: 10.1016/j.cyto.2012.02.010. PMID: 22436638.
crossref
24. Noack M, Miossec P. 2017; Selected cytokine pathways in rheumatoid arthritis. Semin Immunopathol. 39:365–83. DOI: 10.1007/s00281-017-0619-z. PMID: 28213794.
crossref
25. Hunter CA, Jones SA. 2015; IL-6 as a keystone cytokine in health and disease. Nat Immunol. 16:448–57. Erratum in: Nat Immunol 2017; 18:1271. DOI: 10.1038/ni.3153. PMID: 25898198.
crossref
26. Hashizume M, Mihara M. 2012; Blockade of IL-6 and TNF-α inhibited oxLDL-induced production of MCP-1 via scavenger receptor induction. Eur J Pharmacol. 689:249–54. DOI: 10.1016/j.ejphar.2012.05.035. PMID: 22683409.
crossref
27. Bianconi V, Sahebkar A, Atkin SL, Pirro M. 2018; The regulation and importance of monocyte chemoattractant protein-1. Curr Opin Hematol. 25:44–51. DOI: 10.1097/MOH.0000000000000389. PMID: 28914666.
crossref
28. Richard AJ, Stephens JM. 2014; The role of JAK-STAT signaling in adipose tissue function. Biochim Biophys Acta. 1842:431–9. DOI: 10.1016/j.bbadis.2013.05.030. PMID: 23735217. PMCID: PMC4029773.
crossref
29. Srivastava S, Rasool M. 2022; Underpinning IL-6 biology and emphasizing selective JAK blockade as the potential alternate therapeutic intervention for rheumatoid arthritis. Life Sci. 298:120516. DOI: 10.1016/j.lfs.2022.120516. PMID: 35367240.
crossref
30. Cernkovich ER, Deng J, Bond MC, Combs TP, Harp JB. 2008; Adipose-specific disruption of signal transducer and activator of transcription 3 increases body weight and adiposity. Endocrinology. 149:1581–90. DOI: 10.1210/en.2007-1148. PMID: 18096662. PMCID: PMC2276706.
crossref
31. Verghese PB, Arrese EL, Soulages JL. 2007; Stimulation of lipolysis enhances the rate of cholesterol efflux to HDL in adipocytes. Mol Cell Biochem. 302:241–8. DOI: 10.1007/s11010-007-9447-0. PMID: 17390217.
crossref
32. Charles-Schoeman C, Fleischmann R, Davignon J, Schwartz H, Turner SM, Beysen C, et al. 2015; Potential mechanisms leading to the abnormal lipid profile in patients with rheumatoid arthritis versus healthy volunteers and reversal by tofacitinib. Arthritis Rheumatol. 67:616–25. DOI: 10.1002/art.38974. PMID: 25470338. PMCID: PMC5024065.
crossref
33. Charles-Schoeman C, Gugiu GB, Ge H, Shahbazian A, Lee YY, Wang X, et al. 2018; Remodeling of the HDL proteome with treatment response to abatacept or adalimumab in the AMPLE trial of patients with rheumatoid arthritis. Atherosclerosis. 275:107–14. DOI: 10.1016/j.atherosclerosis.2018.04.003. PMID: 29886354. PMCID: PMC6113060.
crossref
34. Ozen G, Pedro S, Michaud K. 2021; The risk of cardiovascular events associated with disease-modifying antirheumatic drugs in rheumatoid arthritis. J Rheumatol. 48:648–55. DOI: 10.3899/jrheum.200265. PMID: 32801134.
crossref
35. Myasoedova E, Crowson CS, Kremers HM, Roger VL, Fitz-Gibbon PD, Therneau TM, et al. 2011; Lipid paradox in rheumatoid arthritis: the impact of serum lipid measures and systemic inflammation on the risk of cardiovascular disease. Ann Rheum Dis. 70:482–7. DOI: 10.1136/ard.2010.135871. PMID: 21216812. PMCID: PMC3058921.
crossref
36. Stary HC, Chandler AB, Glagov S, Guyton JR, Insull W Jr, Rosenfeld ME, et al. 1994; A definition of initial, fatty streak, and intermediate lesions of atherosclerosis. A report from the Committee on Vascular Lesions of the Council on Arteriosclerosis, American Heart Association. Circulation. 89:2462–78. DOI: 10.1161/01.CIR.89.5.2462. PMID: 8181179.
crossref
37. Park JB, Kim DH, Lee H, Hwang IC, Yoon YE, Park HE, et al. 2020; Mildly abnormal lipid levels, but not high lipid variability, are associated with increased risk of myocardial infarction and stroke in "statin-naive" young population a nationwide cohort study. Circ Res. 126:824–35. DOI: 10.1161/CIRCRESAHA.119.315705. PMID: 31978313.
crossref
38. Bisoendial RJ, Stroes ES, Kastelein JJ, Tak PP. 2010; Targeting cardiovascular risk in rheumatoid arthritis: a dual role for statins. Nat Rev Rheumatol. 6:157–64. DOI: 10.1038/nrrheum.2009.277. PMID: 20142814.
crossref
39. Min HK, Kim HR, Lee SH, Shin K, Kim HA, Park SH, et al. 2021; Four-year follow-up of atherogenicity in rheumatoid arthritis patients: from the nationwide Korean College of Rheumatology Biologics Registry. Clin Rheumatol. 40:3105–13. DOI: 10.1007/s10067-021-05613-x. PMID: 33576925.
crossref

Fig. 1
Flow diagram showing the patients analyzed in this study. Overall, 576 patients with rheumatoid arthritis were screened, and 497 who had taken and maintained biological and targeted synthetic disease-modifying antirheumatic drugs (b/tsDMARDs) for at least 6 months were included. Patients were divided into four treatment groups: tumor necrosis factor-α inhibitor (TNFi), abatacept, tocilizumab, and Janus kinase inhibitor (JAKi). Patients tested with the standard lipid profile when they initiated b/tsDMARDs treatment, and who were followed-up for 6 months, were included in the final analysis. The standard lipid profile included total cholesterol, low-density lipoprotein cholesterol, high-density lipoprotein cholesterol, and triglyceride. csDMARD: conventional synthetic DMARDs, DAS28: disease activity score in 28 joints.
jrd-30-4-234-f1.tif
Fig. 2
Factors predisposing patients to a significant change in non-high-density lipoprotein cholesterol levels at 6 months (the multivariate model was adjusted for age and sex). NSAIDs: non-steroidal anti-inflammatory drugs, JAKi: Janus kinase inhibitor, TNFi: tumor necrosis factor-α inhibitor.
jrd-30-4-234-f2.tif
Table 1
Baseline characteristics
TNFi
(n=114)
Abatacept
(n=81)
Tocilizumab
(n=103)
JAKi
(n=89)
p-value
Age (yr) 53±12 58±14 55±14 57±12 0.051
Female 99 (86.8) 72 (88.9) 83 (80.6) 78 (87.6) 0.351
RF positive 107 (93.9) 77 (95.1) 99 (96.1) 84 (94.4) 0.894
ACPA positive 109 (95.6)* 71 (87.7)* 98 (95.2) 84 (94.4) 0.112
T2DM 4 (3.5)* 6 (9.4)* 8 (8.2) 5 (6.4) 0.301
Hypertension 9 (7.9)*,, 19 (23.5) 22 (21.4) 15 (16.9)* 0.014
Comedication
Methotrexate 103 (90.4)*, 57 (70.4)*, 83 (80.6) 76 (85.4) 0.003
Leflunomide 2 (1.8)*, 9 (11.1) 6 (5.8) 7 (7.9)* 0.057
HCQ 5 (4.5) 8 (9.9) 11 (10.7) 6 (6.7) 0.315
NSAID 92 (80.7) 56 (69.1) 78 (75.7) 72 (80.9) 0.206
Glucocorticoids 100 (87.7) 66 (81.5) 97 (94.2)* 76 (85.4)* 0.063
Statin 16 (14.0) 15 (18.5) 13 (12.7) 11 (12.4) 0.646
DAS28 5.4±0.5* 5.3±0.5 5.3±0.6 5.2±0.4* 0.035

Values are presented as mean±standard deviation or number (%). TNFi: tumor necrosis factor-α inhibitor, JAKi: Janus kinase inhibitor, T2DM: type 2 diabetic mellitus, HCQ: hydroxychloroquine, NSAID: non-steroidal anti-inflammatory drugs, DAS28: disease activity score in 28 joints. *,†,‡Significantly different after post hoc analysis.

Table 2
Percentage change, from baseline to 6 months, in lipid parameters according to the baseline use of statins
TNFi
(n=114)
Abatacept
(n=81)
Tocilizumab
(n=103)
JAKi
(n=89)
p-value
Total cholesterol (mg/dL)
Without statins (n) 98 66 89 78
Baseline 178±33 184±32 183±36 177±32 0.696
6 months 185±30*, 192±35 204±35* 206±46 <0.001
Mean change (%)§ 6.2±19.1* 5.3±15.4 14.1±21.4 17.8±26.1* <0.001
With statins (n) 16 15 14 11
Baseline 170±43 163±18 171±26 173±44 0.874
6 months 160±39 178±33 177±36 185±39 0.342
% change§ −4.0±20.3 10.4±22.9 4.1±22.4 8.9±17.6 0.243
LDL-C (mg/dL)
Without statins (n) 98 66 89 78
Baseline 100±29 103±27 102±28 96±28 0.411
6 months 104±27* 107±28 115±29* 113 ± 39 0.046
% change§ 8.8±29.2* 5.7±22.2 19.2±33.9 22.3±40.5*, 0.003
With statins (n) 16 15 14 11
Baseline 91±36 82±19 97±22 95±29 0.537
6 months 79±32 92±27 93±28 96±22 0.352
% change§ −8.6±33.5 18.0±43.0 −0.4±36.0 4.8±17.9 0.206
Non-HDL-C (mg/dL)
Without statins (n) 98 66 89 78
Baseline 121±31 124±27 123±31 117±31 0.506
6 months 125±29* 131±31 140±32* 137±44 0.015
% change§ 6.7±23.0*, 8.1±21.2‡ 18.1±29.4* 21.5±37.6,‡ 0.001
With statins (n) 16 15 14 11
Baseline 116±37 105±18 120±22 115±34 0.537
6 months 106±32 116±30 120±33 121±29 0.530
% change§ −5.7±25.2 13.8±34.9 1.7±32.3 7.2±17.6 0.297
HDL-C (mg/dL)
Without statins (n) 98 66 89 78
Baseline 57±14 61±16 59±13 61±15 0.219
6 months 60±14* 61±14 64±16 69±15*, <0.001
% change§ 3.9±15.0* 0.8±13.6 5.5±13.9 10.2±19.0*, 0.356
With statins (n) 16 15 14 11
Baseline 54±14 58±12 51±10 58±18 0.468
6 months 55±18 62±14 56±10 64±22 0.404
% change§ −8.6±33.5 18.0±43.0 −0.4±36.0 4.8±17.9 0.206
Triglyceride (mg/dL)
Without statins (n) 98 66 89 78
Baseline 89±50 92±40 100±51 96±75 0.559
6 months 93±49* 100±50 118±68* 97±62 0.020
% change§ 17.8±66.1 18.4±53.9 34.3±100.3 16.0±51.1 0.307
With statins (n) 16 15 14 11
Baseline 117±69 104±40 117±38 104±32 0.818
6 months 129±87 101±46 125±47 110±52 0.603
% change§ 19.7±57.6 5.3±45.8 19.8±68.3 5.8±36.3 0.813

Values are presented as mean±standard deviation. TNFi: tumor necrosis factor-α inhibitor, JAKi: Janus kinase inhibitor, LDL-C: low-density lipoprotein cholesterol, HDL-C: high-density lipoprotein cholesterol. *,†,‡Significantly different after post hoc analysis. §Percentage change from baseline to 6 months.

TOOLS
Similar articles