

 PDF
PDF Citation
 Print
Print


INTRODUCTION
Physicians increasingly use patients’ laboratory test results for disease diagnosis, patient monitoring, treatment planning, and the evaluation of treatment effectiveness [1-4]. Laboratory test values do not represent exact data but rather vary within certain confidence limits due to systematic or random variation [1,5,6]. Bias is the systematic deviation of laboratory test results from the actual value. A significant bias in measurement results can cause misdiagnosis or misestimation of disease prognosis and increased healthcare costs [7-9]. Some causes of bias have been presented previously [10-12]. Although bias has been extensively discussed within the last decades, it has rarely been properly addressed, representing the “dark side of the moon,” particularly in the field of laboratory medicine. To handle bias properly, the terminology, pre-analytical and analytical conditions, and statistical techniques used to evaluate bias must be standardized [13-19]. Notably a “purist” approach in which “everything is expected to be perfect” is not a pragmatic method for solving common laboratory medicine problems. Laboratory resources should not be wasted on correcting insignificant and minor differences that do not affect clinical decisions.
Biological and non-biological samples have distinct properties. Non-biological samples are affected by pre-analytical or analytical variations, whereas biological samples such as whole blood, plasma, and urine are affected by both pre-analytical and analytical variations as well as by biological variation (BV) [1]. This is particularly evident in sequential sampling. Within the human body, analytes fluctuate around (homeostatic) set points, which is known as the within-subject BV [20]. Measurement results of patient samples vary over time due to BV, even if pre-analytical and analytical variations are negligible [1, 20]. Deviations that cannot be tolerated in industrial measurements can be tolerated in medical laboratories. According to Albert Einstein, “everything should be made as simple as possible, but not simpler” [21]. The practical aspect should be as simple as possible but not at the expense of the theoretical background of the concepts under study.
In this review, bias is evaluated from metrological and statistical, laboratory, and clinical perspectives. The theoretical aspects of bias based on metrological and BV principles are summarized, and these principles are applied to laboratory and diagnostic medicine for practical use.
METROLOGICAL AND STATISTICAL PERSPECTIVES OF BIAS
Terminology
The terms bias, trueness, and systematic error are interrelated [13, 22]. According to Vocabulary International Metrology (VIM) edition 3, measurement bias is the “estimate of a systematic measurement error” (2.18) [13]. Measurement trueness is defined as the “closeness of agreement between the average of an infinite number of replicate measured quantity values and a reference quantity value” (2.14) and “is inversely related to systematic measurement error, but is not related to random measurement error” (Note 2). Instrumental bias is defined as the “average of replicate indications minus a reference quantity value” (4.20).
Based on these definitions, estimating bias requires two main components: (1) a reference quantity or assigned value and (2) a replicate measurement of the quantity (Fig. 1). If one of these two components is unknown or has not been properly determined, bias cannot be estimated correctly.
Mathematically, bias can be calculated using the following equation:
where O(A) and E(A) are observed (measured) and expected values of analyte A, respectively. In practice, O(A) and E(A) correspond to the mean of repeated measurements and reference data, respectively.
Estimated bias is not a precise value. Each measurement result has a systematic and random component, and the mean of repeated measurements has a degree of variation depending on the probability selected.
Types of bias
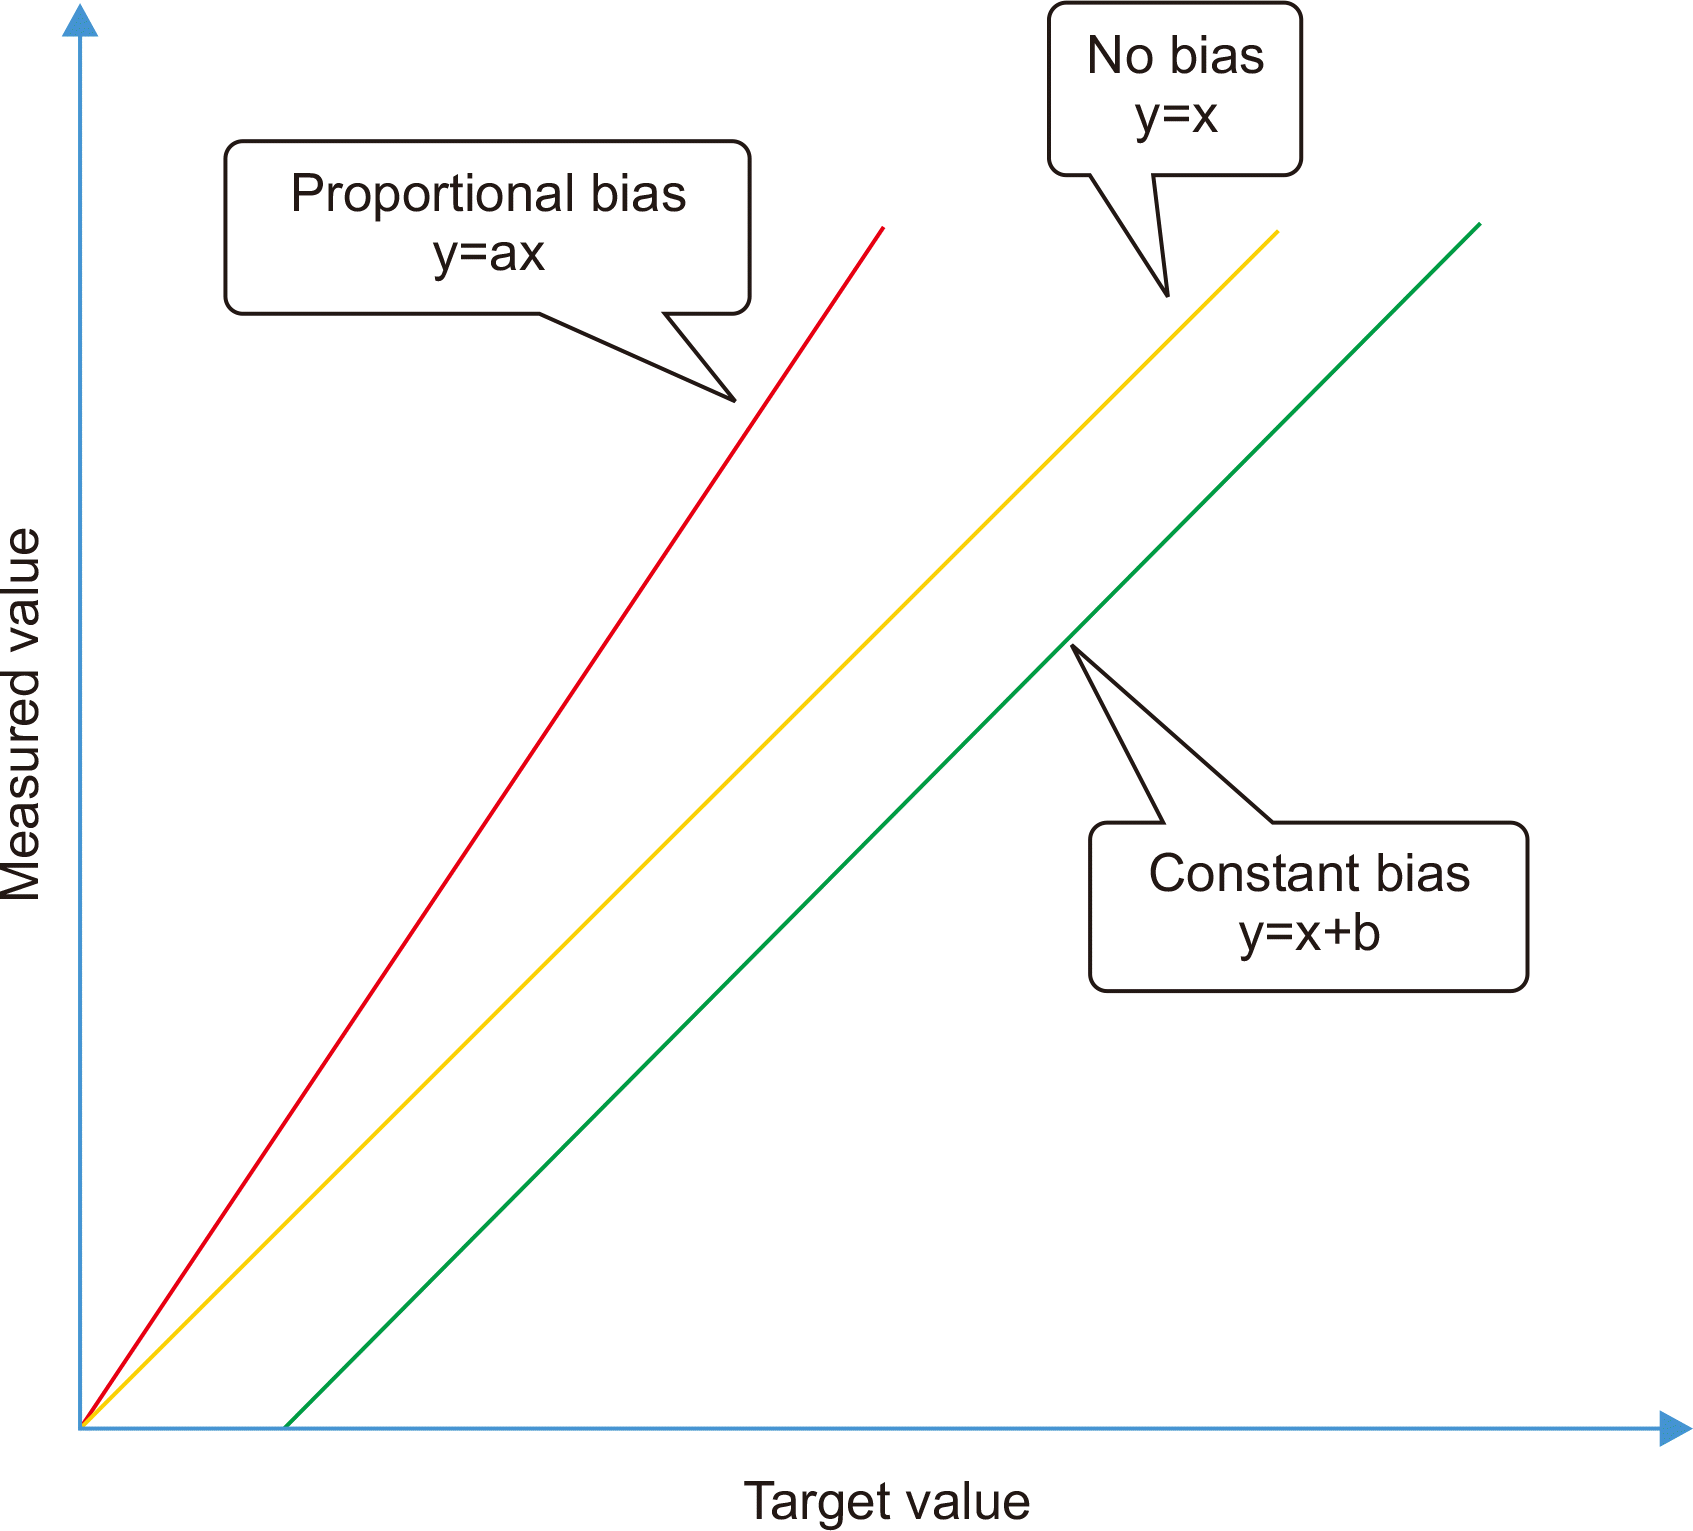
Measurement accuracy varies across different concentrations, and the linearity of measurement methods is lost in the region near the limit of quantitation and upper measurement limits [23, 24]. Measured bias can be constant or proportional. In constant bias, the difference between the target and measured values is constant, whereas in proportional bias, the difference between the target and measured values is proportional to the amount of the measurand (i.e., it is a function of the measurand concentration) (Fig. 2) [25-28]. The bias between two methods can be evaluated using a Bland–Altman graph, which is a powerful graphic tool for evaluating the agreement between two methods, particularly when it is correctly interpreted and based on an adequate sample size [29-31]. Passing–Bablok regression analysis can also be used to evaluate the presence of constant and proportional bias between two methods (Fig. 2) [32].
The regression equation for two methods can be written as follows:
where a is the slope and b is the intercept.
If y=x (i.e., a=1 and b=0), it can be considered that there is no significant bias between two methods or instruments. Note that in the case of a≠1 and b≠0, the significance of a and b should be evaluated using the 95% confidence intervals (CIs) of the slope and intercept. If the 95% CI of a includes 1, it can be concluded that there is no significant proportional bias between two methods. Similarly, if the 95% CI of b includes 0, it can be concluded that there is no significant constant bias between two methods (Fig. 2). Details for detecting proportional and constant bias have been presented previously [33-35].
Measurement of bias
Practically, bias measurement requires the availability of reference values and the mean of repeated measurements (Fig. 1A). The reference quantity value can be determined using certified reference materials (CRMs) or fresh patient samples measured using reference methods [36, 37]. If the reference quantity value is not available, an assigned value can be used to estimate the bias (Fig. 1B). Bias should not be estimated by simply subtracting the mean of the measured value from the reference or assigned value. Additionally, the significance of the bias should be evaluated and confirmed. Subtracting a single measurement result from a reference or assigned value does not yield bias; this is a common error made in medical laboratories, particularly when calculating the sigma metric (SM) [38] of the measurement procedure. The characteristics of bias depend on the measurement procedure and the duration of data collection for bias estimation; therefore, measurement conditions have a significant influence on bias and its significance [12, 39].
Measurement conditions
Metrologically, three bias measurement conditions [39] can be defined, which are discussed as follows:
Repeatability conditions
For repeatability conditions, (1) the measurement procedure, instrument, operating conditions, operator, and location (laboratory) must be the same, and (2) the repeated measurements must be completed within a short period (no longer than one day) and in a single run.
Repeated measurements under repeatability conditions yield the smallest random variation, and if a bias exists, it can be easily detected.
Intermediate precision conditions
Intermediate precision conditions are referred to as the variation in a measurand analyzed in a single laboratory over several months using different instruments, operating conditions, operators, reagents, and calibrators. Repeated measurements under intermediate precision conditions show higher random variation than those under repeatability conditions, and if a bias exists, it may be difficult to detect (Fig. 3).
Reproducibility conditions
In addition to repeatability and intermediate precision, reproducibility conditions also include the total variation of different laboratories. The variation of repeated measurements under reproducibility conditions includes all types of variations originating from different sources, such as measurement procedures, instruments, operating conditions, operators, and locations (laboratories) over several months. Among repeated measurements, those conducted under reproducibility conditions demonstrate the highest degree of random variation compared to those conducted under intermediate precision conditions, and if bias exists, it may be difficult to detect.
Significance of bias
Since bias is defined as the difference between a target value and the mean of repeated measurements (Fig. 1), the significance of a calculated bias should be evaluated before further calculations [40, 41]. The significance of bias can be evaluated using t-test. Alternatively, while it may not be statistically accurate in some instances, the significance of bias can be evaluated using the 95% CI in a very practical context. This evaluation is more visual in nature, as opposed to a strict statistical assessment. If the 95% CI of the mean of repeated measurement results and the target value overlap, bias is not considered to be significant, whereas if there is no overlap bias is considered to be significant (see Supplemental Method for an explanation and Supplemental Tables S1, S2 for practical examples). Note that since bias and imprecision are related, the imprecision of the method significantly impacts the significance of the bias [14].
CLINICAL LABORATORY PERSPECTIVE OF BIAS
In clinical laboratories, bias should be evaluated using fresh patient samples or commutable samples. The use of commutable samples in clinical laboratories has been reviewed previously [42-44] (see also the “Commutability and bias” section below). As the analytical responses of fresh patient samples and commutable samples are similar [45], commutable samples can represent fresh patient samples in performance evaluations of measurement procedures. A pragmatic procedure including analytical performance of the instruments, sample types, measurement procedures, data collection period, and statistical techniques is required to handle bias in clinical laboratories.
Analytical performance specifications (APSs)
APSs are a set of criteria that specify the quality required for the analytical performance of measurement procedures to deliver laboratory test results that achieve the best possible health outcomes for patients without causing harm [46]. In daily practice, the analytical performance of measurement systems is evaluated by calculating the systematic and random variations, namely, bias and imprecision. In addition to bias and imprecision, total allowable error (TEa) has been accepted as a component of APS over the last four decades and has been used for various purposes. However, TEa has limitations, including a lack of definition in the VIM and a lack of fit in metrology [13]. The standard equation of TEa is as follows:
In the linear combination of bias and the CV, only one side of the CV (normal distribution) is included in the calculation; therefore, the appropriate multiplier for a 95% probability is 1.65. The CV represents the imprecision of the measurement procedure.
According to the Guide to the Expression of Uncertainty in Measurement (GUM) [47], bias should be corrected and known bias should not be included when calculating APSs and other indicators. Because of the limitations mentioned above, TEa should not be used in laboratory medicine to represent a tolerance limit and/or measurement uncertainty (MU). In metrology, total error (not TEa) corresponds to accuracy. Accuracy is the combination of bias and imprecision, which can be used to evaluate the error of a single measurement result. Therefore, accuracy is used in External Quality Assessment Scheme (EQAS) programs. In clinical laboratories, TEa has been incorrectly used or recommended instead of the tolerance limit (TL) [38], MU [48], or other reliable indicators. The TL or tolerance interval contains a specified proportion of units from the sampled process or population; the detailed calculation method is presented previously [49]. Although TEa explains many phenomena in laboratory medicine, in reality, it cannot solve any problems and has no place in metrology. Therefore, it is not considered a part of APSs in this review.
To prevent misdiagnosis, acceptable limits for bias should be determined for the measurand measurement results reported to patients.
Models for deriving acceptable bias
The acceptable limits or TLs can be determined based on various factors, including customer requirements, clinical needs, established guidelines, and statistical methodologies such as the Taguchi loss function [50, 51]. Despite intensive efforts, the acceptable limits for laboratory analytes measured in biological samples are not well-defined. Two international meetings were organized to define the criteria for APSs in medical laboratories [52-55].
Stockholm and Milan consensuses
The first conference on global analytical quality specifications was held in Stockholm in 1999. According to the Stockholm consensus, APSs are based on five hierarchical criteria [54] with the highest-ranking criterion given the highest priority. If it is not feasible to apply the first criterion, then the second criterion should be utilized, and so on, in descending order of priority [1, 53].
Although the Stockholm consensus was aimed at defining acceptance criteria for APS based on medical needs, it did not have the expected effect in laboratory medicine for 15 years. In 2014, the European Federation of Clinical Chemistry and Laboratory Medicine (EFLM) organized a strategic conference in Milan to revise the Stockholm consensus, which was named the Milan consensus [55]. The APS criteria were revised and simplified based on clinical and laboratory requirements, and technological achievability was considered a critical parameter.
In both the Stockholm and Milan consensuses, the first criterion in the hierarchy is based on the effect of analytical performance on clinical outcomes and the second criterion is based on the components of the measurands’ BV. In the Milan consensus, the third and fourth criteria of the Stockholm consensus are excluded and the APS criteria are simplified and limited to three criteria. The last criterion (the fifth in the Stockholm consensus and the third in the Milan consensus) is based on the state of the art of the measurement, i.e., the highest level of analytical performance technically achievable.
Since 1999, APSs of laboratory analytes based on clinical decision limits have been difficult to define. A single laboratory test can be used for numerous clinical purposes, resulting in various associated clinical decision limits. Although the first criterion is excellent, it is not widely used in practice. No single model can be applied to all measurands, and therefore, applying different models is a pragmatic approach to estimate the APSs of different measurands. Alternatively, APSs can be based on a compromise between different models [56]. Selecting the most appropriate model for a measurand can be challenging. Ceriotti, et al. [57] proposed a simple and pragmatic workflow to select the most appropriate models for various measurands.
Because of the nature of laboratory tests, the first criterion of both the Stockholm and Milan consensuses is not widely applied in practice, and therefore, the APSs of laboratory analytes are mainly based on the second criterion, BV.
Acceptable bias derived from components of BV of the measurands
Unlike clinical outcomes, BV in an analyte can be easily estimated. The EFLM BV Working Group has greatly contributed to laboratory test BV. In the last decade, the group has developed checklists [58] and standards [59] for BV studies, measured the BV of numerous analytes [60] using a strict protocol [61], performed meta-analyses of BV data of numerous analytes published in the literature [62-69], and launched a BV database for most laboratory tests [70]. The database is dynamic and is updated when a new paper on BV is published.
The question remains as to how to develop a model to estimate acceptable limits for bias based on BV. There is a model for the acceptable limits of imprecision based on BV. This model is based on the contribution of analytical variation to the total variation, which is calculated using the following equation:
A triple model for performance evaluation has been proposed as follows [1]:
Desirable performance is defined as CVA<0.50 CVI. Here, the maximum contribution of analytical variation to total variation is 12%.
Optimum performance is defined as CVA<0.25 CVI. Here, the maximum contribution of analytical variation to total variation is 3%.
Minimum performance is defined as CVA<0.75 CVI. Here, the maximum contribution of analytical variation to total variation is 25%.
The acceptable limit for imprecision can be modeled based on the contribution of the analytical variation to total variation; however, this method cannot be used for bias. Because bias is a linear parameter, the reference interval (RI) can be used to model the limits of acceptable bias [71-74].
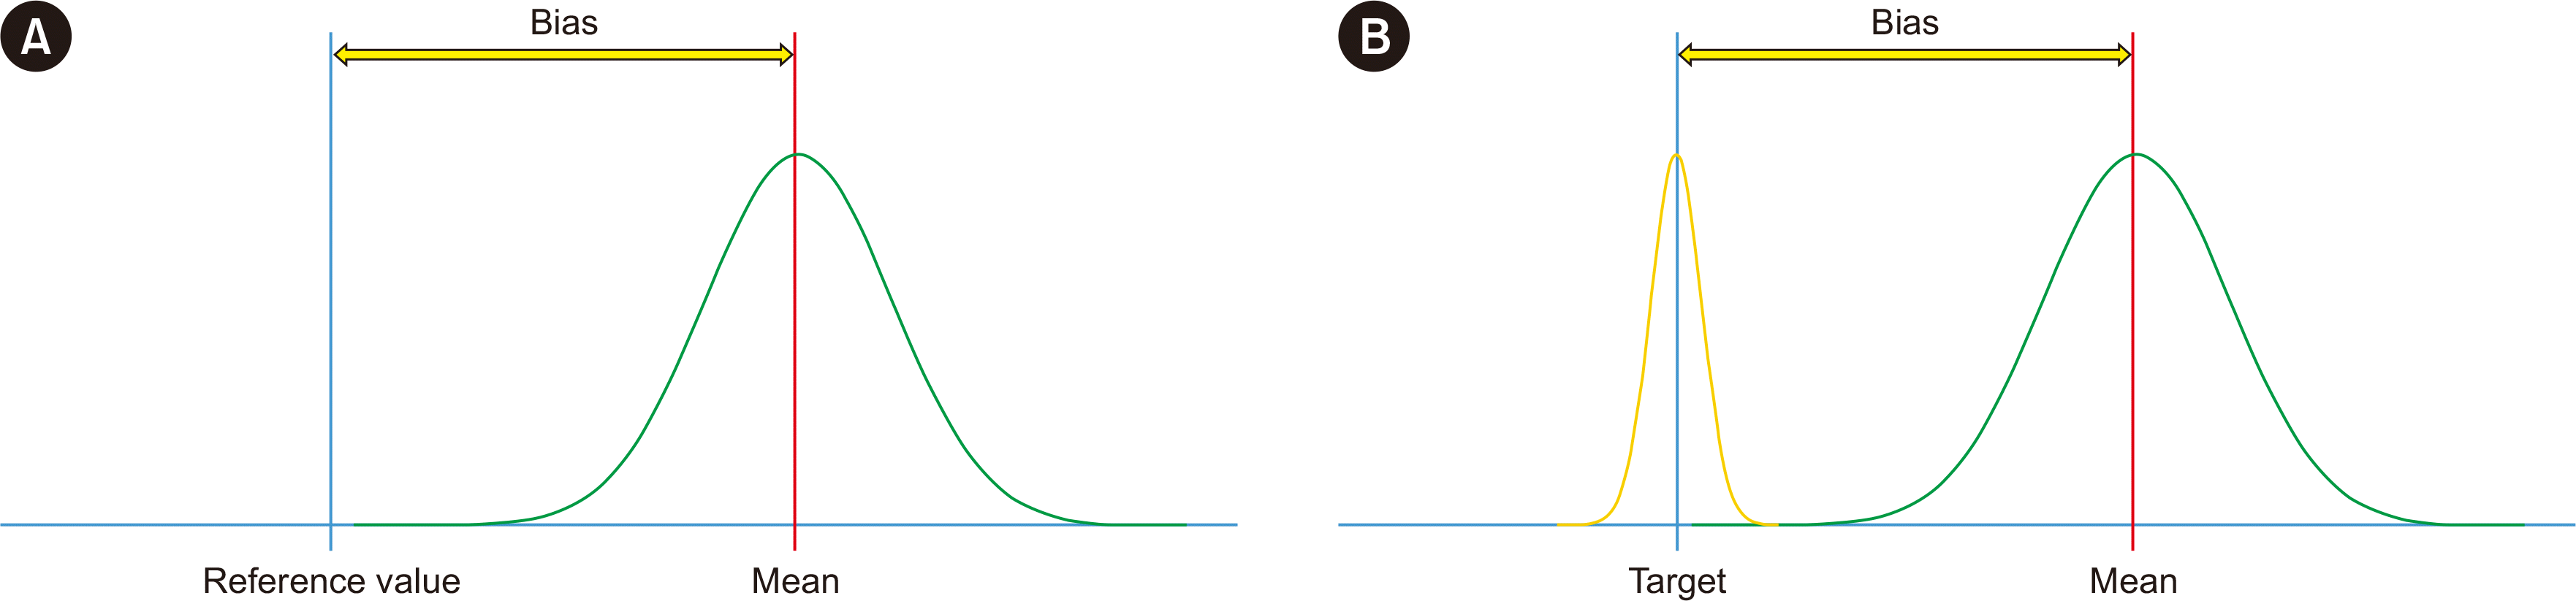
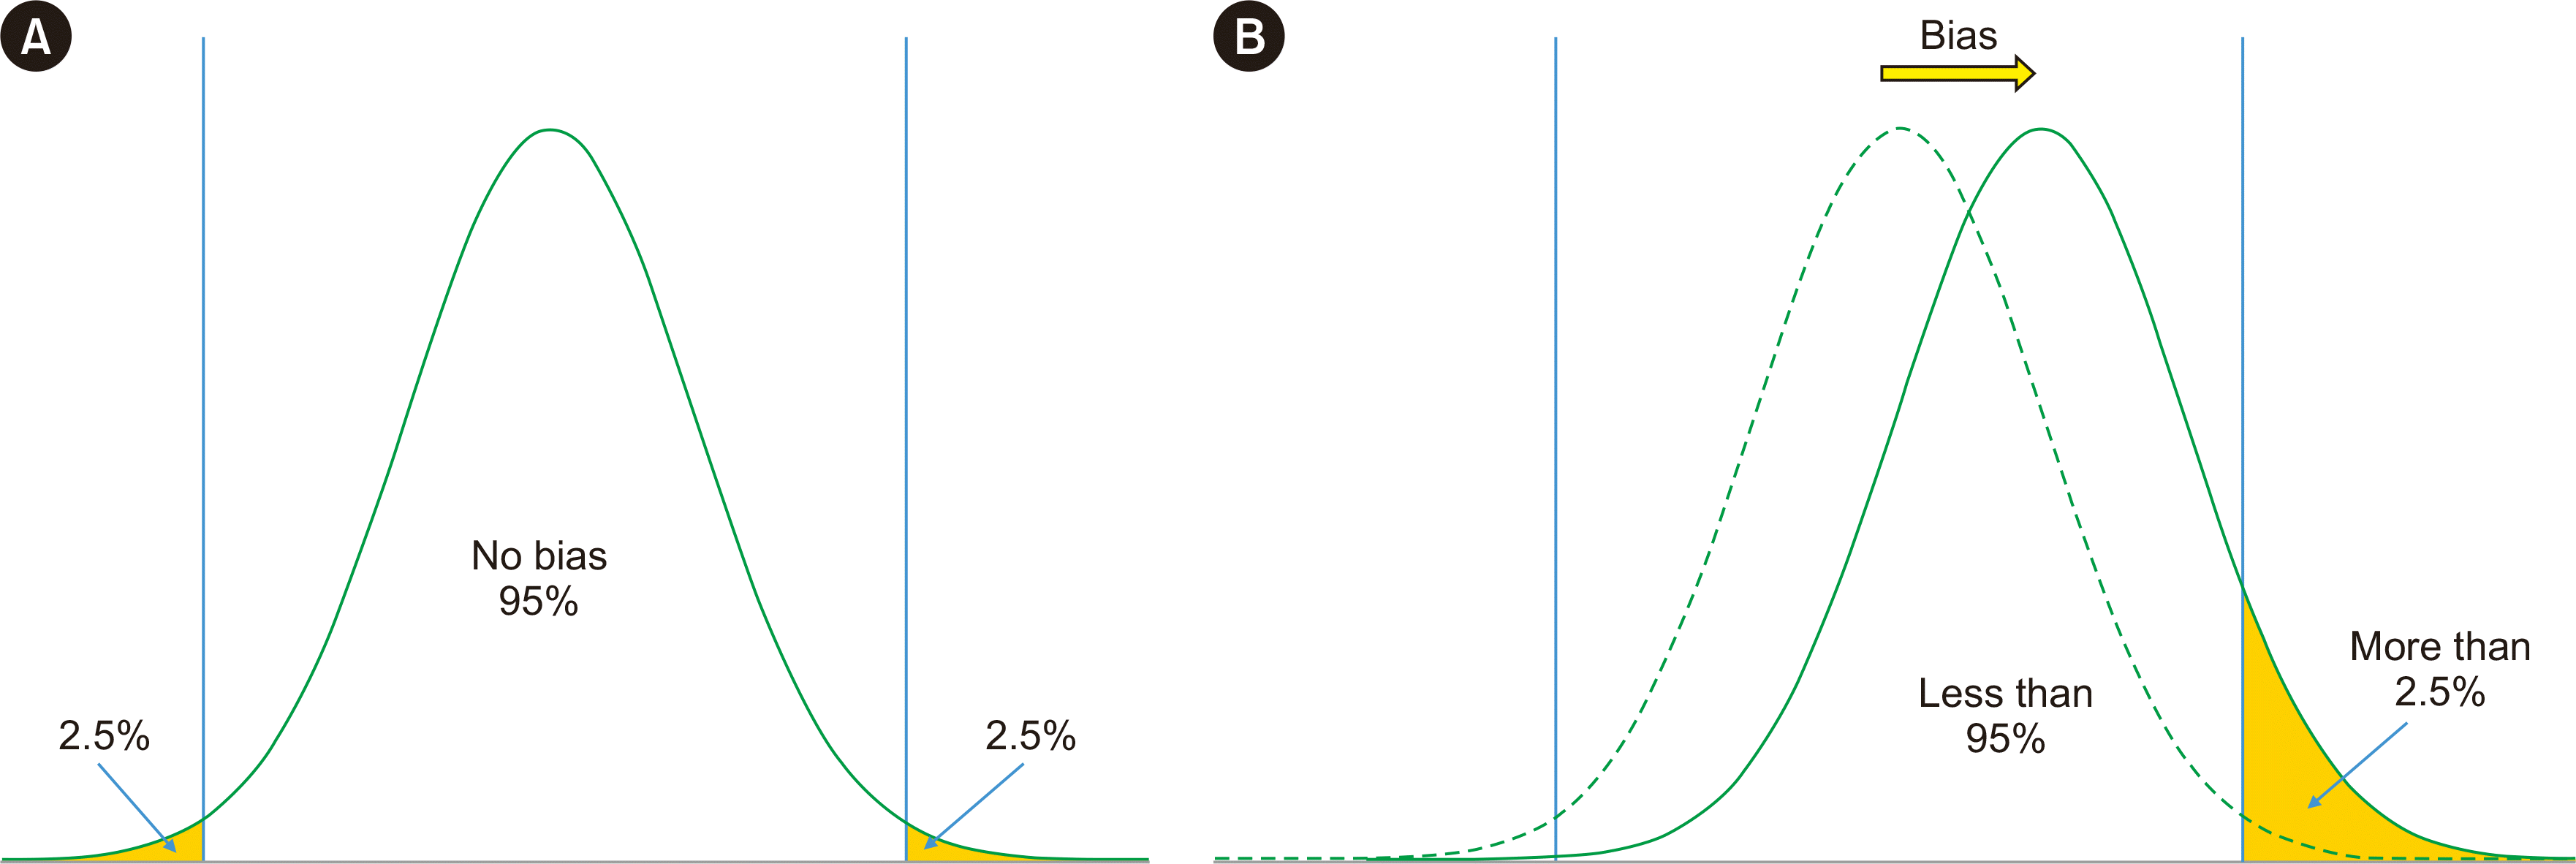
Physicians generally use conventional RIs for clinical decisions. If a patient’s laboratory results are within the RI, they are accepted as normal; otherwise, they are considered abnormal. Therefore, bias has various effects on disease misdiagnosis [71]. A positive bias in laboratory test results will increase the percentage of RIs outside the upper limits (ULs) and decrease the percentage outside the lower limits (LLs). A negative bias will have the opposite effect. Laboratory test results within RIs are considered normally distributed. The geometrical shape of the normal distribution is not rectangular [75, 76]; therefore, the effect of bias on the UL and LL is not symmetric. Using normal distribution mathematics, we can calculate the percentage of individuals outside the RI when bias exists. This can be used to model the acceptable limit for bias based on BV as with imprecision [77].
The conventional population-based RI comprises both between- and within-subject BV, so that acceptable bias can be calculated according to their Gaussian combination. The model for acceptable bias is based on the acceptable number of people outside the RI when bias exists. Details of the model to derive the acceptable bias from BV data have been reported previously [1]. As shown in Fig. 4A, the LL and UL of the RI are set to cover 95% of the population values. If the measurement procedure has a positive bias, the curve will shift to the right (Fig. 4B); >2.5% of the population will have values higher than the UL and <2.5% of the population values will be outside the LL. Because of the bell shape of the curve, the increase in population values outside the UL will be higher than the decrease in population values outside the LL. The change in population values inside and outside of the RI caused by increasing bias is presented in Fig. 4B.
Mathematically, the area under the curve (AUC) can be used to calculate the population values inside and outside of the RI as follows:
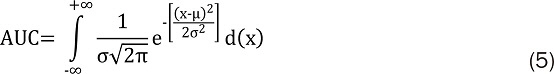
where σ is the standard deviation, µ is the mean, and x is the variable.
From Equation 5, the AUC within the RI can be calculated using Equation 6:

From Equations 5 and 6, the population values outside the RI can be calculated according to Equation 7:
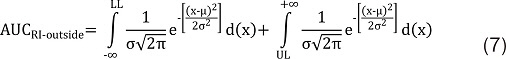
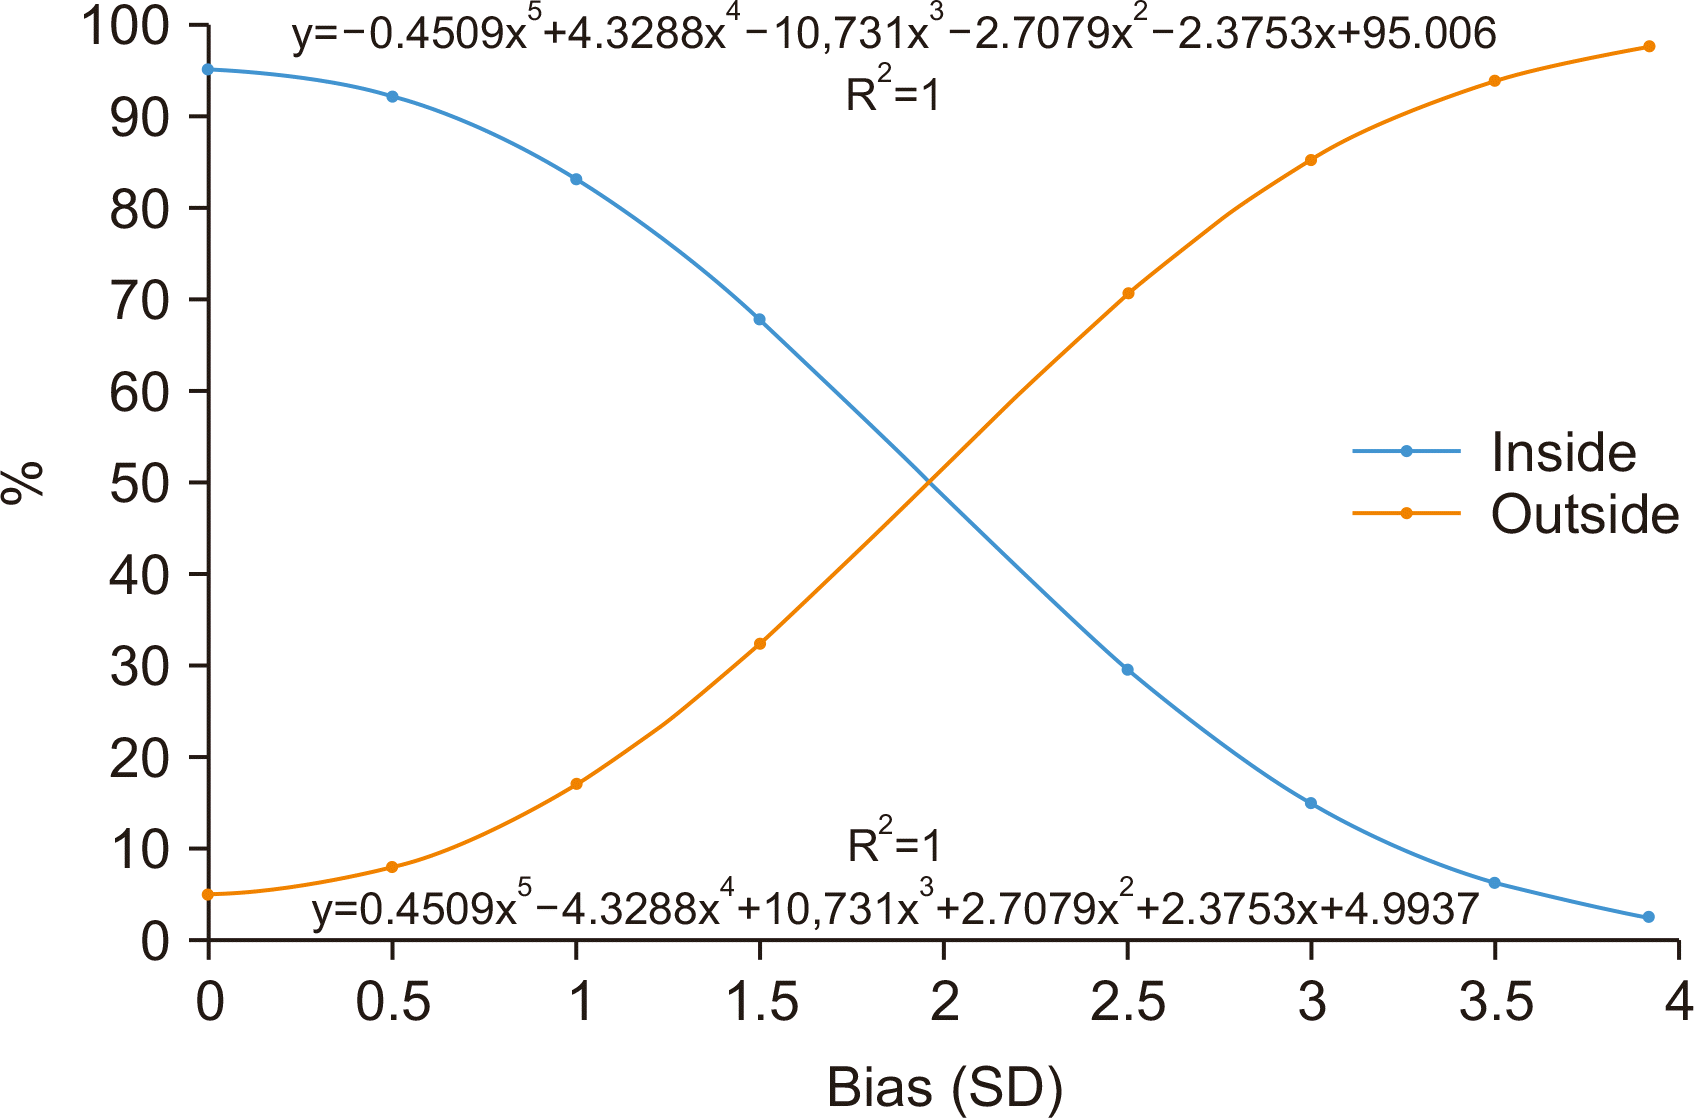
Equations 5–7 are very complex and cannot be used in daily practice. Instead, z-transformation and a z table can be used to calculate the AUC and population values inside and outside the RI. A practical method is presented in Fig. 5. When bias exists, this graph can be used to easily estimate the population values outside and inside the RI.
Based on the normal distribution, a triple model for bias has been suggested (see Supplemental Table S3):
where CVB is the total BV.
Desirable performance is defined as BA<0.250CVB. Here, 0.8% of the additional population will be outside the conventional RI and 5.8% will be outside the RIs due to bias.
Optimum performance is defined as BA<0.125CVB. Here, 0.1% of the additional population will be outside the conventional RI and 5.1% will be outside the RI due to bias.
Minimum performance is defined as BA<0.375CVB. Here, 1.7% of the additional population will be outside the conventional RI and 6.7% will be outside the RI due to bias.
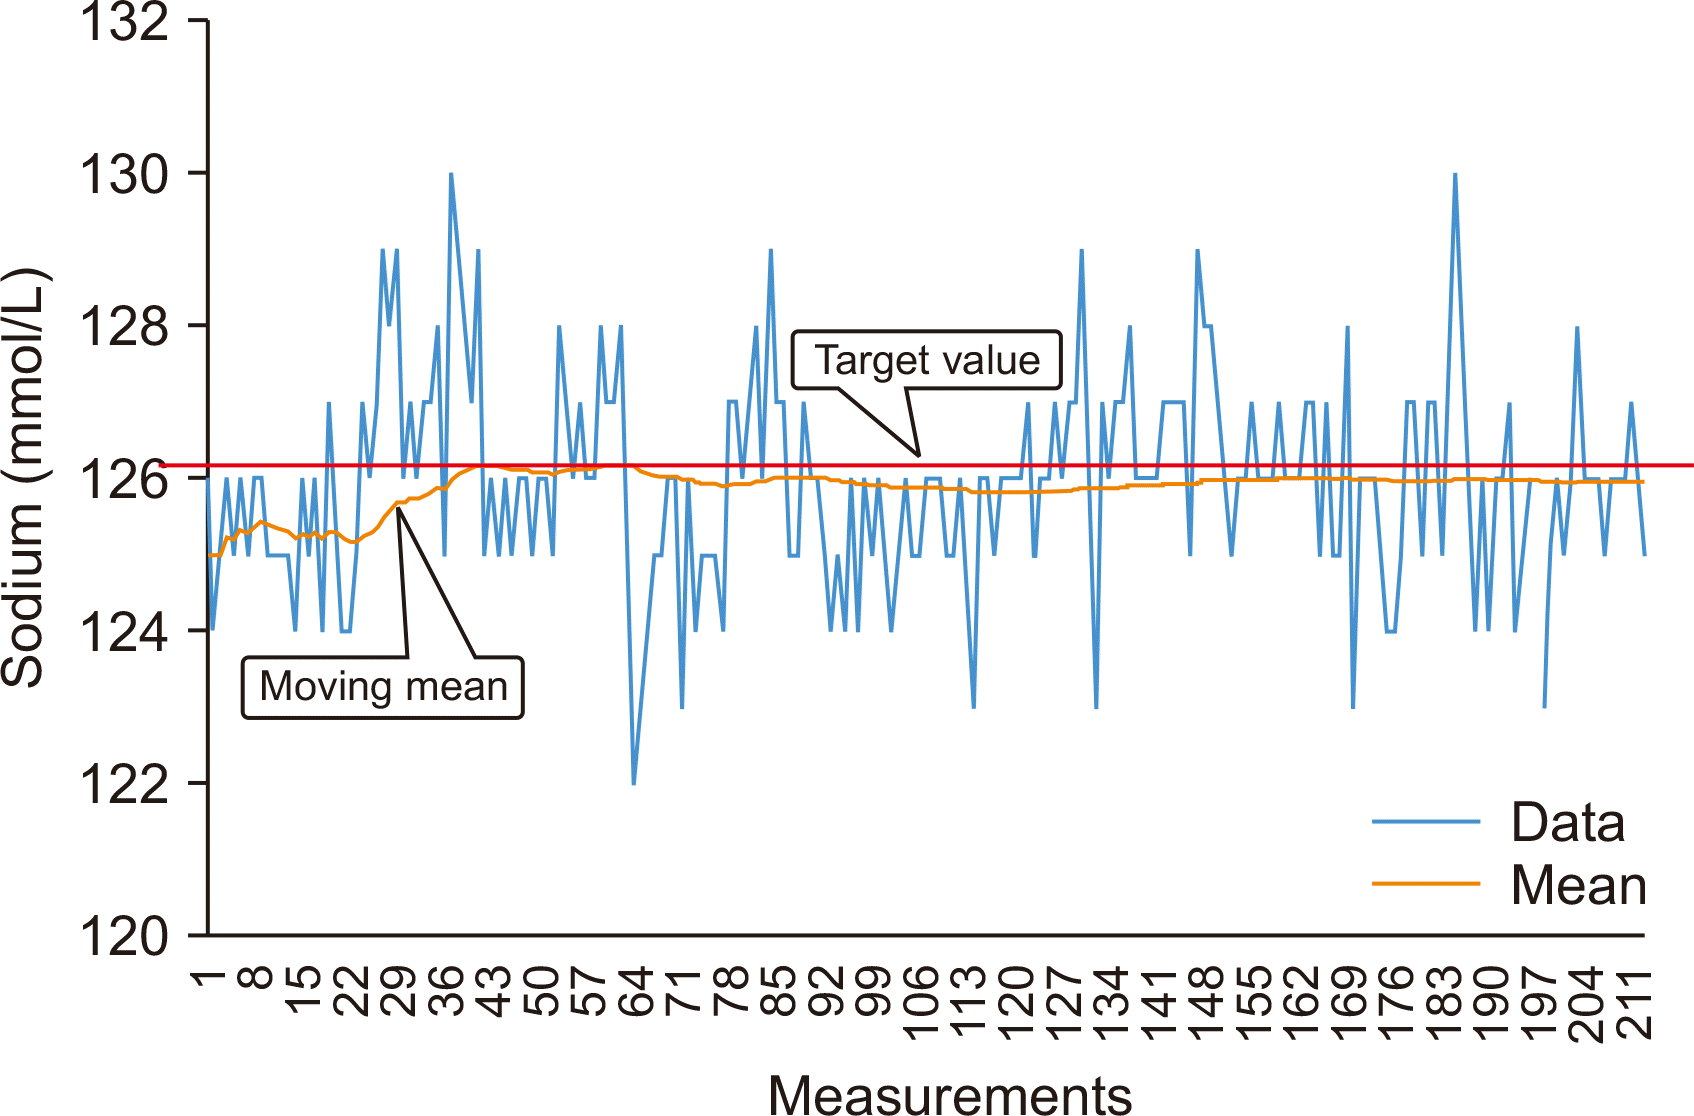
Short- and long-term biases
In routine practice, clinical laboratories use different consumables, QC samples, calibrators, and reagents with different lot numbers. The accuracy of measurement results is generally monitored using QC materials, and if the measurement result of QC materials is not within acceptable limits, the instruments/measurement system is calibrated. Calibration may correct a shift from the target value; consequently, any measurement system that is frequently calibrated may show bias patterns around the mean value (Fig. 3). Therefore, the characteristic of bias changes over time [12], and the bias pattern estimated from repeated measurement results obtained under repeatability conditions is expected to differ from that estimated from data collected under intermediate precision or reproducibility conditions.
Bias and external quality assessment schemes
Although it is recommended to estimate bias using CRM and reference methods from a metrological perspective, this is not practically achievable in clinical laboratories. Modern clinical laboratories analyze thousands of measurands in different sample types; therefore, procedures to assess the quality and performance of measurement procedures should be practical and cost-effective, rather than purist and theoretical. Numerous laboratories use assigned values from EQAS to estimate bias. However, this does not represent the real bias that is determined using CRMs and reference methods. Bias calculated from EQAS data is performance bias. Since performance of a laboratory is evaluated using data from other laboratories, bias in the laboratory reflects the position of the laboratory within the peer group. The assigned value or mean of the peer group does not reflect the actual value of the analyte measured using CRMs and a reference method. EQAS programs are not aimed at estimating bias and EQAS samples are generally not commutable [42-44]. Therefore, bias estimated using EQAS data may not represent the actual bias in patients’ laboratory test results.
Commutability and bias
According to the VIM, commutability of a reference material is defined as the “property of a reference material, demonstrated by the closeness of agreement between the relation among the measurement results for a stated quantity in this material, obtained according to two given measurement procedures, and the relationship obtained among the measurement results for other specified materials” [13]. In other words, for commutability, the analytical response of tested materials obtained from measurement procedures should be the same as that of patient samples [45]. Therefore, commutable materials can represent fresh patient samples for method comparison [81-83].
In clinical laboratories, human samples (whole blood, serum, plasma, urine, and other body fluids and samples) are analyzed. Therefore, the samples used to evaluate quality indicators must represent human samples. However, in practice, commercial QC samples are used to evaluate quality indicators. As commercial QC samples are used for a long period, they must be stable. To increase the stability of QC materials, lipids are removed and the samples are lyophilized, resulting in a matrix that differs from that of the fresh patient samples. Although fresh patient samples are commutable, they are unstable and cannot be used for long periods. Because of the lack of commutability, commercial QC samples do not represent the patient samples, and therefore, the bias and imprecision estimated from commercial QC and fresh patient samples may be different. Ideally, the reference materials and/or commercial QC samples should be commutable with patient samples. The commutability of samples can be estimated according to CLSI guidelines [84,85]. An estimate of the bias observed between reference and routine methods is required to evaluate sample commutability [86]. Consequently, commutability can be estimated using correctly designed bias experiments and bias can be estimated correctly using commutable materials [87-89].
Bias and MU
As MU is an inseparable part of all types of measurements, accurate calculation of MU has long been a research focus in metrology [90-92].
Various methods for MU calculations have been suggested; however, a global consensus has not been reached, particularly for use in daily practice. Numerous parameters, including instruments, reagents, methods, laboratory environments, and technical staff, affect the MU of analytes. The number of parameters and their contribution to MU vary depending on the analytes and laboratory. To overcome this problem, two major methods to calculate the MU of analytes have been proposed: bottom-up (Type A) and top-down (Type B) methods [93-96].
In the bottom-up method, all possible sources of MU are included in the calculation of the total MU [92]. This method is generally applied to newly developed methods, in-house methods, and measurement procedures that have multiple components. However, this method is time-consuming and requires a detailed road map analysis before MU calculations. It may not be possible to determine all possible sources of MU, particularly in automated measurement systems. In the top-down method, QC data collected in a laboratory, such as internal QC or EQAS data, are used to calculate the total MU [97,98]. This method is more practical and pragmatic for calculating the MU of analytes in medical laboratories, particularly for auto-analyzers.
MU is applied in nearly all industrial sectors but not effectively in medical laboratories. Unlike other calculations, the MU calculation has not been standardized in medical laboratories. Although International Organization for Standardization (ISO) guidelines 15189 [99] recommend the MU calculation for each analyte in medical laboratories, there is no explanation of how to make these calculations. Some guidelines recommend using the bottom-up method to calculate MU, whereas ISO guidelines to calculate the MU of analytes in medical laboratories were not available until 2019 with the release of guidelines ISO/TS 20914:2019 [100], recommending the inclusion of three major parameters to calculate MU: precision, bias, and calibration uncertainty. Different approaches are suggested depending on the availability of MU components as follows.
If all components (i.e., imprecision, bias, and calibration uncertainty) are available, the following equation can be used to estimate the MU of analytes.
If bias or calibration uncertainty is not available, these components can be excluded from the MU equation as follows:
Although the guidelines suggest the inclusion of long-term imprecision, the long-term data collected under intermediate precision conditions or reproducibility conditions also include bias. As mentioned above when discussing short- and long-term biases, for frequently calibrated instruments, the long-term bias becomes a random variation. The graph of data collected under reproducibility conditions (Fig. 3) shows that bias cannot be evaluated as a separate parameter, and the imprecision calculated from the dataset collected under reproducibility conditions covers all known variations, including bias. The data shown in Fig. 3 contains all measurement results collected from an instrument that was frequently calibrated. Based on the EQAS evaluation, instrument performance was acceptable in comparison with that in the peer group. There was no reason to expand the variation in these data by including additional parameters.
However, the guidelines do not provide a strict framework for these parameters. In ISO/TS 20914:2019 [100], imprecision is calculated from the internal QC data, bias is calculated from EQAS data, and calibration uncertainty is obtained from the manufacturers.
Details on how to obtain these parameters are unclear because the imprecision of the measurement procedure can be calculated from the data collected under repeatability, intermediate precision, or reproducibility conditions [39]. The imprecision is expected to be the lowest for data collected under repeatability conditions and the highest for data collected under reproducibility conditions. Bias can also be calculated using CRMs and reference methods or EQAS data; however, the significance of bias should be evaluated before further calculations.
Laboratory data are not exact and have various degrees of variation depending on several factors, including methods and samples, resulting in differences in numerical data, which may be significant or insignificant [101]. As bias is the difference between reference data and the mean of repeated measurements, the significance of bias must be addressed before using a bias in further calculations. Using bias without evaluation of its significance in MU calculation can artificially increase the total MU.
MU should include the most influential factors affecting patients’ test results rather than numerous insignificant components. Estimating MU from data collected under reproducibility conditions is a practical method for medical laboratories [39]. Because bias is a component of data collected under reproducibility conditions, it should not be included in the MU calculation as a separate parameter.
Another issue is the treatment of bias in the MU calculation. As shown in Equation 9, bias is generally included in MU calculations as a quadratic parameter similar to imprecision. In mathematical terms, it is not valid to sum a variance with a linear parameter; therefore, only the variances of variables can be added together [102].
In conclusion, (1) the inclusion of bias in MU calculation, particularly if the imprecision is calculated from data collected under reproducibility conditions, artificially increases the total MU; (2) it is mathematically incorrect to treat bias as variance; and (3) the significance of bias should be considered before further calculations [39, 40, 103].
Bias and Six Sigma
Six Sigma is a widely accepted standard methodology for total quality management [104] in the new millennium. The performance of processes can be evaluated objectively using the Sigma scale [105, 106]. If a process has a level of 6 sigma, it produces only 3.4 defects per one million opportunities (DPMO), which can be considered the gold standard [107]. The SM of a process can be calculated using equation 12:
where TL is the tolerance limit (from the upper to lower limit) of the process and SD is the standard deviation of the process.
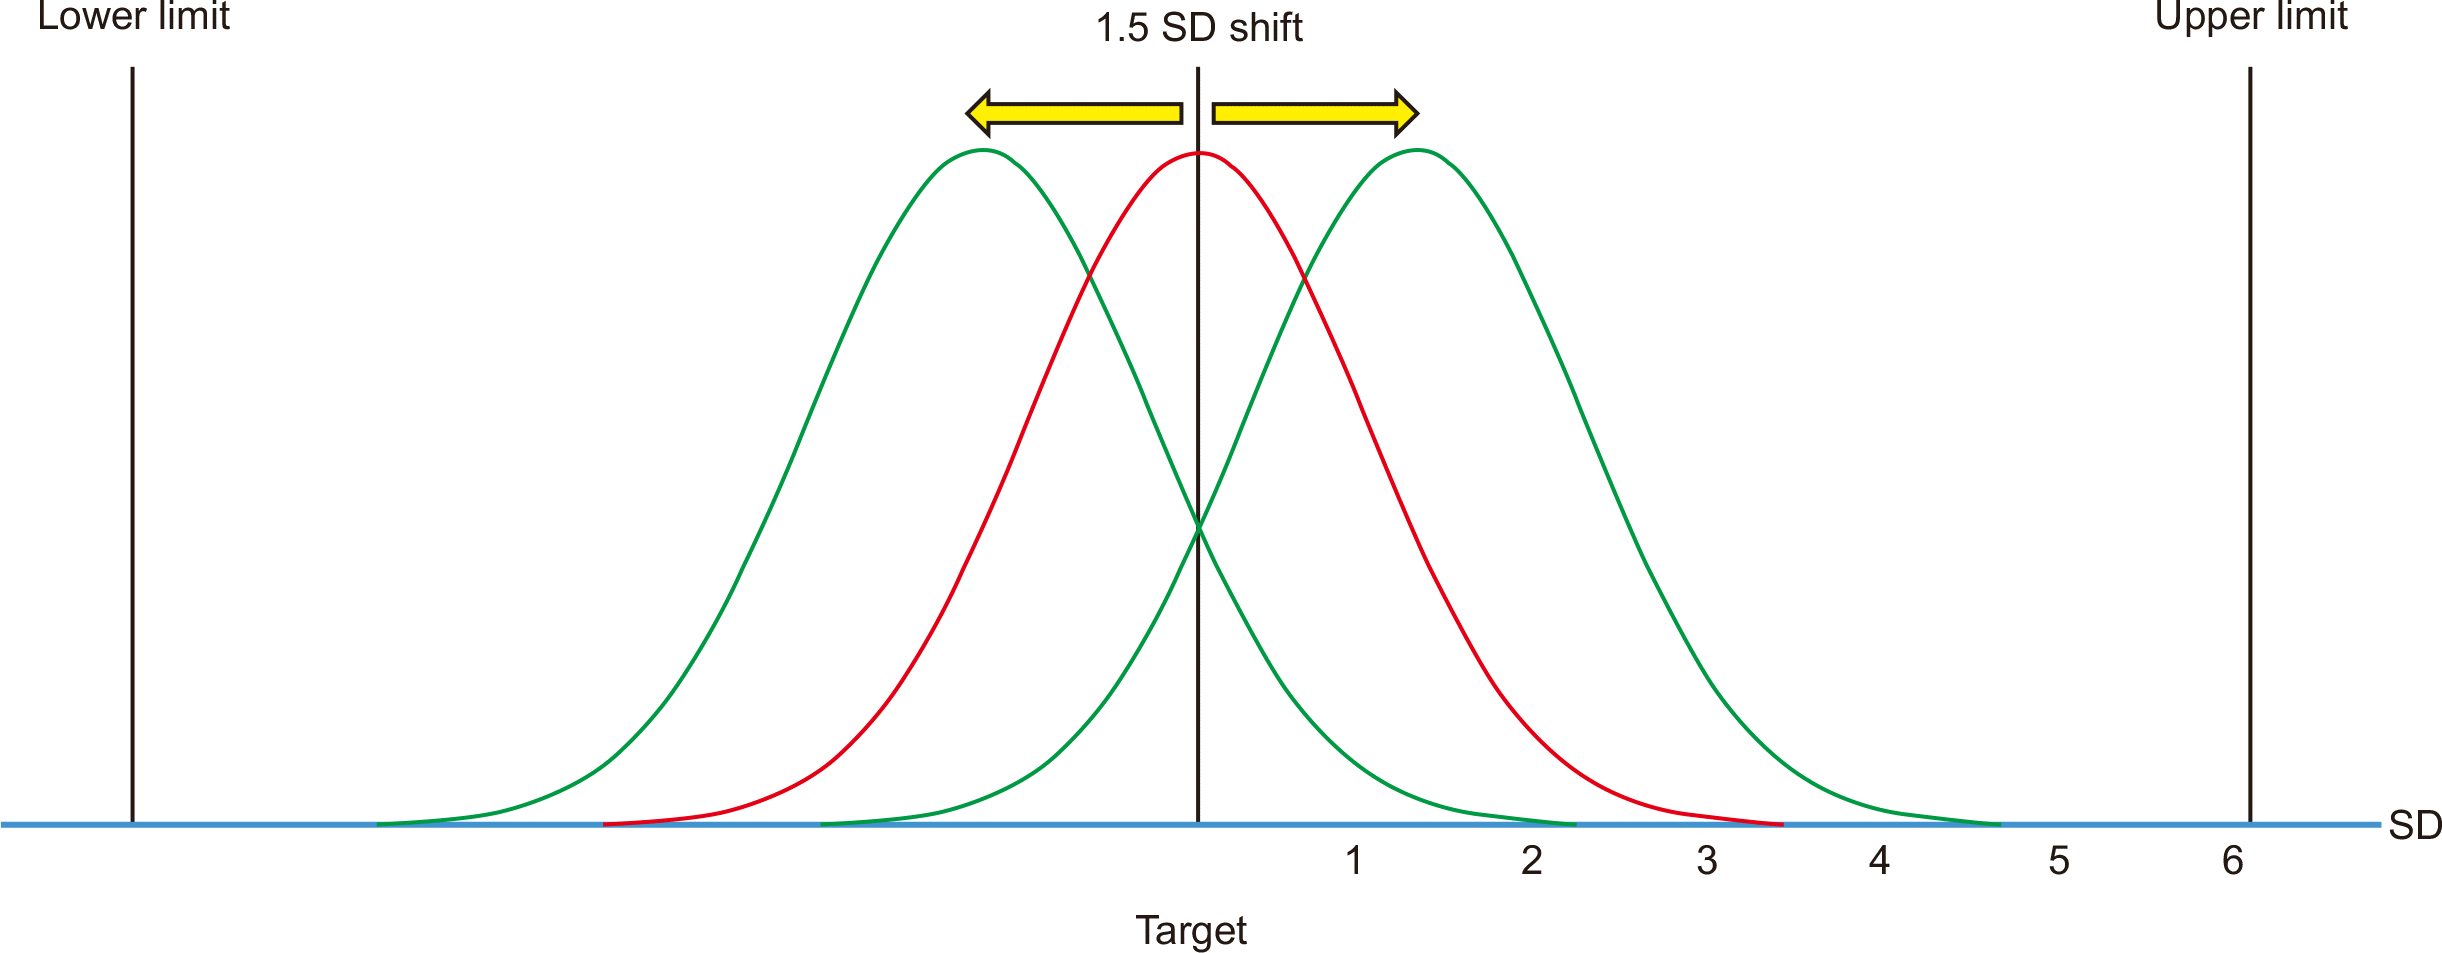
In the 1980s, Bill Smith and engineers at Motorola Inc. developed the Six Sigma methodology. Because the SM is considered the number of SDs between the mean and the UL/LL of the process, the mean of the process can be centered, which is the same as the target of the process. In practice, the situation is different, and a shift can be observed between the mean and the target of the process. Based on long-term observation, this shift is approximately 1.5 SDs (Fig. 6) [108].
In Equation 12, bias is not directly included in the SM calculation. However, the Six Sigma methodology does not neglect bias but rather treats it correctly. If bias is detected, it should be eliminated; including bias even if it can be eliminated is not pragmatic. However, if the system does not provide real-time monitoring (as is the case in most medical laboratories), we cannot be certain that bias does not exist. In daily practice, bias is the dark side of the moon. To overcome this problem, a 1.5 SD bias is included in all calculations related to the SM, and a table of conversion of DPMO to SM and vice versa is prepared accordingly. Therefore, 6 sigma corresponds to 3.4 DPMO. However, if we neglect bias, it corresponds to 0.002 DPMO.
In medical laboratories, the process performance is calculated using a modified equation proposed by Westgard:
Equation 13 differs from Equation 12 in that it includes bias. This method has two main disadvantages. First, incorporating bias in the equation is mathematically incorrect, and the SM obtained from Equation 13 dramatically underestimates the process performance [103, 109, 110]. Second, 1.5 SD bias is included in the DPMO tables and the SM calculated using Equation 13 can significantly underestimate process performance. Because bias is included twice in the calculations (once in Equation 13 and once in the 1.5 SD bias inclusion), the performance of numerous medical instruments and laboratory tests has been calculated as 3–4 SM [111-114]. This implies that the quality of medical laboratory instruments is lower than that of industrial instruments, which is not true. The low-quality level calculated for medical laboratory instruments is due to the incorrect equation and is unrealistic. In reality, medical laboratory analyzers are high-technology products of the same quality as industrial analyzers.
In statistics, various distributions, such as normal, t, and chi-square distributions, are used in different situations [75,76]. The mathematics of the SM are based on the normal distribution [115], which is geometrically bell-shaped and mathematically asymptotic to the X-axis (Fig. 6). A shift of the normal distribution curve to the right or left will change the AUC within the TL; however, this change will not be linearly proportional to the shift [103, 109, 110]. The relationship between bias and the AUC can be calculated using the normal distribution equation (Equation 5). However, Equation 5 is very complex and cannot be used in daily practice. Instead, it is practical to use standard tables that show how performance changes with bias [107].
The second important point is that the bias included in the calculation rarely reflects the real bias. In medical laboratories, bias is calculated from EQAS data, and its significance requires confirmation.
Correction of bias
Before initiating the correction procedure, it is essential to evaluate the significance of a bias and confirm its existence. Correcting statistically insignificant or clinically unimportant bias would be a waste of time and money [12, 116]. For a significant bias, a root-cause analysis should be conducted, and if the cause is unknown, correction is not recommended. In this case, bias should be accepted and the bias of the analyte should be considered in all reported information. If a bias is significant and clinically important, it can be eliminated by modifying the methods. If elimination is not possible, a correction procedure should be initiated.
DIAGNOSTIC PERSPECTIVE OF BIAS
Diagnostic accuracy is directly related to the clinical performance characteristics of the measurands. Sensitivity, specificity, positive and negative predictive values, likelihood ratios, and ROC curves are used to describe the relationship between test results and diagnostic accuracy [117-120].
The sensitivity of a test reflects the fraction of patients with a specific disease correctly predicted by the test and can be calculated using the following equation:
where TP represents the true positives (patients with a disease with a correct diagnosis based on the test result) and FN represents the false negatives (patients with a disease with an incorrect diagnosis based on the test result).
In contrast to sensitivity, the specificity of a test reflects the fraction of individuals without a specific disease correctly predicted by the test, which can be calculated using the following equation:
where TN represents the true negatives (individuals without diseases who are correctly predicted by the test result) and FP represents the false positives (individuals without diseases who are incorrectly predicted by the test result).
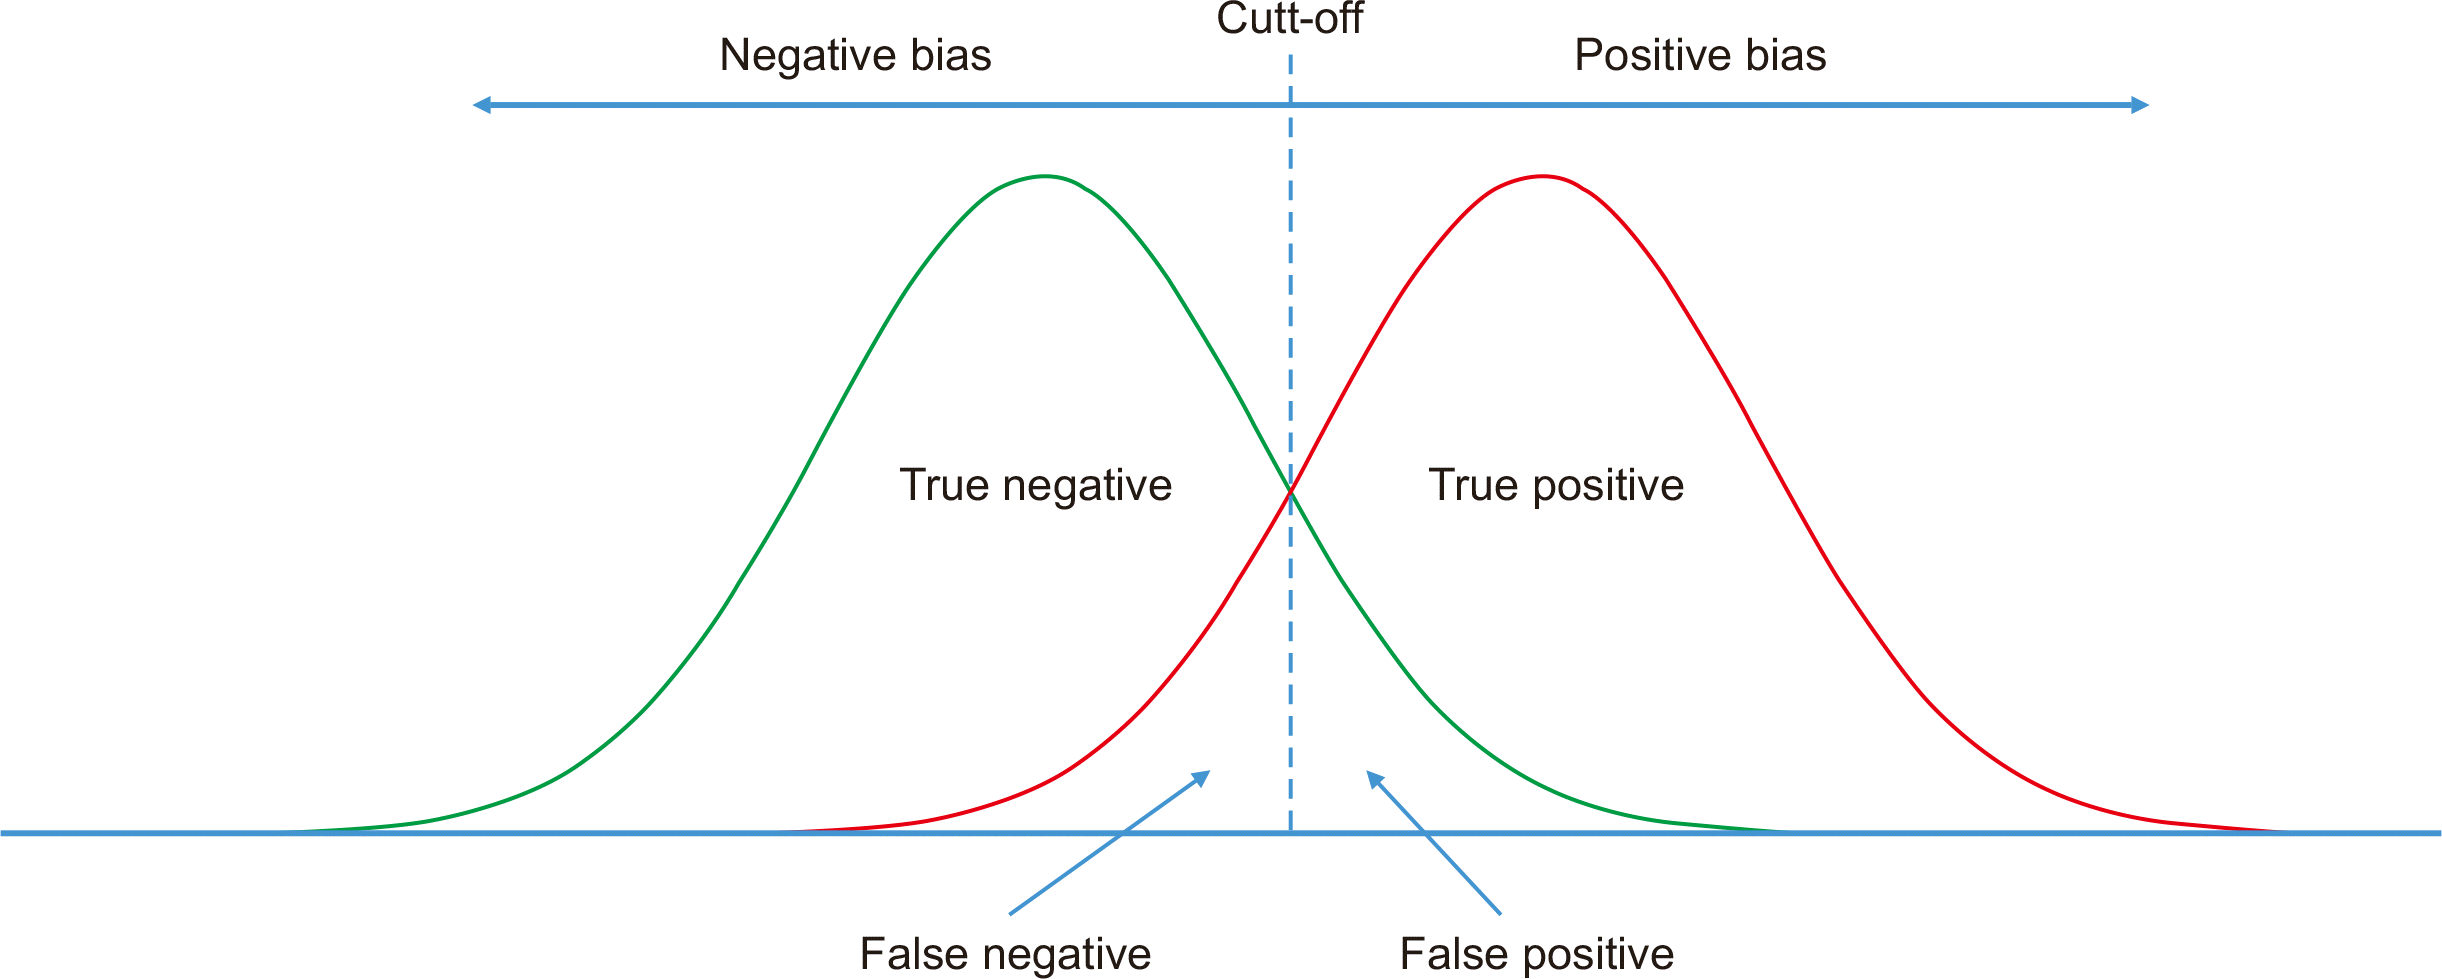
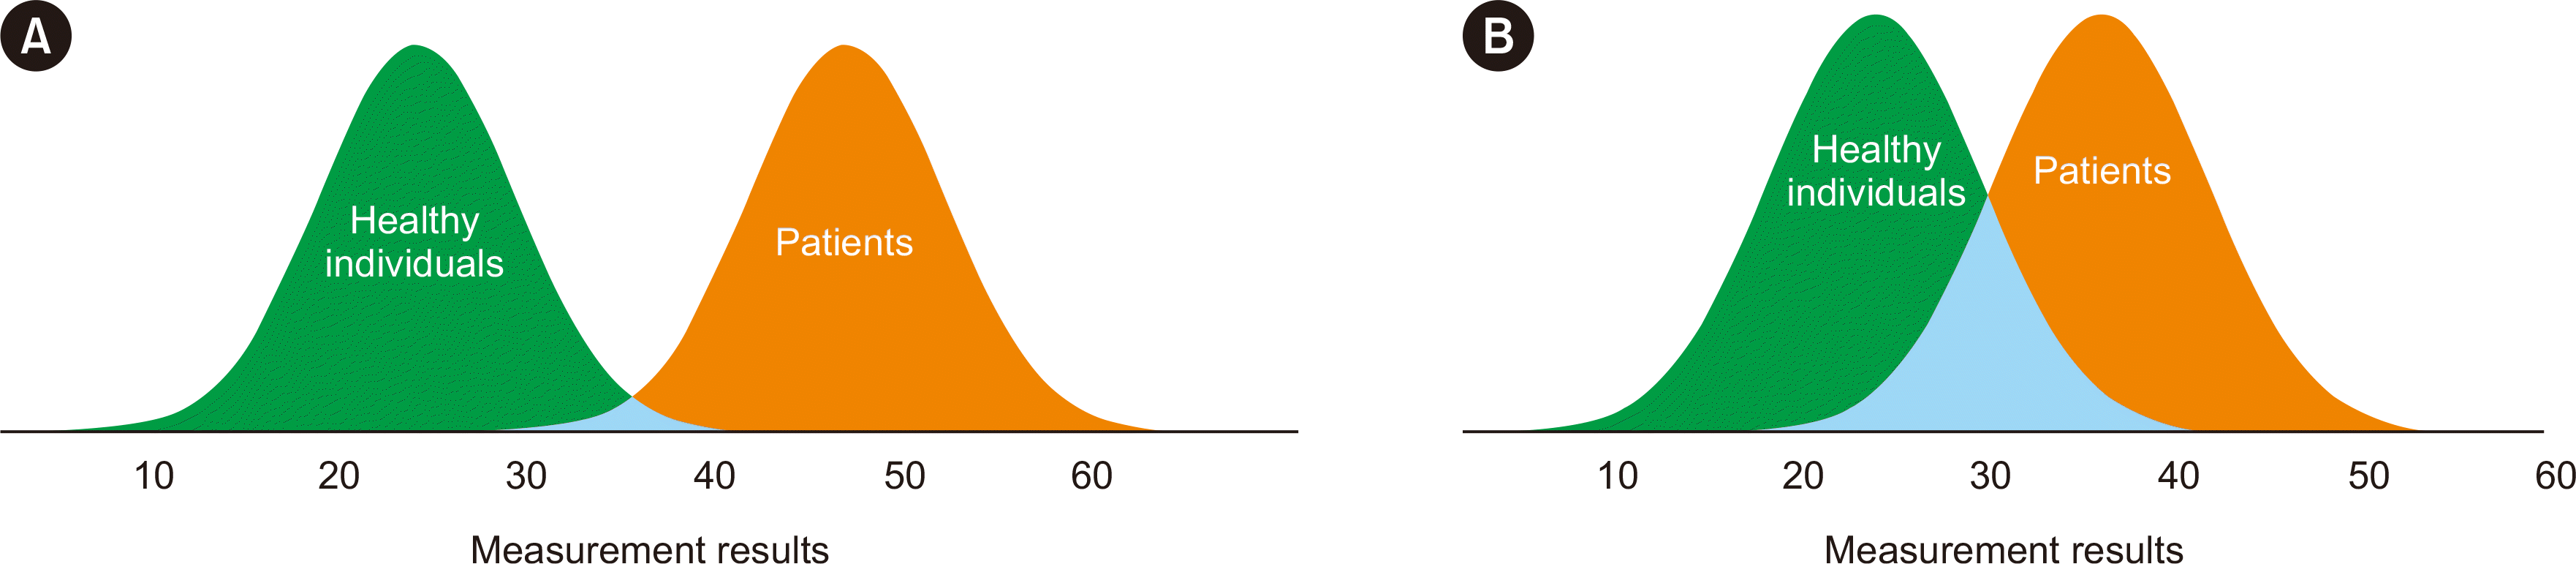
Sensitivity and specificity are key components of method performance, and the correct estimation of both metrics is affected by bias (Fig. 7) [121,122].
Predictive values (positive and negative) are functions of sensitivity, specificity, and the disease prevalence and can be formulated as follows:
The predictive value of a negative test result (PV–) is the fraction of healthy individuals with negative test results, whereas the predictive value of a positive test result (PV+) is the fraction of patients with a disease and positive test results.
The odds ratio shows the prevalence of a disease in a population and is expressed as the ratio of the probability of the presence of the disease to the probability of its absence, as follows:
Significant bias will decrease the diagnostic accuracy of laboratory tests (Fig. 8).
CONCLUSIONS
Bias is the systematic deviation of measurement results from the true value, and it has a significant effect on the information produced from laboratory medicine. However, bias is rarely handled correctly. While imprecision is estimated based on repeated measurements, bias is estimated based on both repeated measurements and a reference/target value. Additionally, the significance of bias should be evaluated and confirmed. In clinical laboratories, bias is the dark side of the moon, and its estimation should be based on appropriate experimental design, data collection, statistical evaluation, and commutable samples. Treating bias appropriately reduces laboratory errors, improves patient safety, and significantly reduces healthcare costs. Statistically significant and medically important biases should be eliminated or corrected. Medical laboratories should develop policies to eliminate the impact of bias on data reported to patients. Future studies are required to illuminate the dark side of the moon, i.e., to eliminate the negative impact of bias on medical decisions and healthcare costs.
SUPPLEMENTARY MATERIALS
Supplementary materials can be found via https://doi.org/10.3343/alm.2024.44.1.6
 XML Download