

 PDF
PDF Citation
 Print
Print


INTRODUCTION
The worldwide prevalence of anemia in 2010 was approximately 32.9%, and a large proportion of these cases were caused by iron deficiency (ID), termed iron deficiency anemia (IDA). This was shown in a large-scale analysis including data collected between 1990 and 2010 from 187 countries and 20 age groups, including men and women.1 IDA is a consequence of chronic blood loss which is associated with pathological conditions such as malignancies and gynecological disorders resulting in heavy menstrual bleeding. IDA is correlated with increased perinatal mortality,2 cognitive impairment in infants3 and the elderly,4 and decreased physical performance and work productivity in adults.5 The World Health Report from 2002 by the World Health Organization (WHO), therefore, named IDA a major health problem and a global burden.6 The actual prevalence of ID and IDA is not well documented as a result of the high cost of biochemical tests and a lack of standard methods to diagnose ID and IDA. Owing to this lack of proper diagnosis, anemia is also often falsely referred to as ID or IDA. The prevalence of anemia varies depending on age, sex, and country. According to a report released by the WHO, between 1993 and 2005, the highest proportion (47.5–67.6%) of individuals with anemia were in Africa, followed by America (17.8–29.3%) and Europe (19.0–21.7%). The demographic group with the highest prevalence of anemia was preschool-aged children (47.4%), followed by pregnant women (41.8%), non-pregnant women (30.2%), school-aged children (25.4%), the elderly (23.9%), and men (12.7%).7 Similarly, ID was frequently reported in preschool children (40%), menstruating girls and women (30%), and pregnant women (38%).8
Causes of anemia vary between regions and, therefore, different intervention strategies might be required to prevent anemia in different countries. In developing countries, ID and IDA usually result from insufficient dietary intake or blood loss due to parasitic infections. In contrast, in developed countries, a vegetarian diet, diet restrictions, and pathological conditions leading to chronic blood loss or malabsorption are the most common causes of IDA.9 Between 1995 and 2011, the global prevalence of anemia decreased by 4–5% in high-risk groups in low-income regions but decreased less in high-income regions.8 This was due to prevention programs and dietary modifications. According to the WHO, the prevalence of anemia in developed countries has been constant at around 9.1%.7 A similar prevalence of under 9% has been reported over the past 10 years by the 7th Korean National Health and Nutrition Examination Survey (KNHNES-VII).10 This suggests that the prevalence of IDA is more difficult to reduce in developed countries than in under-developed or developing countries. In order to develop an appropriate intervention plan, a large-scale population-based IDA survey is needed to target the susceptible population.
The 5th Korean National Health and Nutrition Examination Survey (KNHNES-V) was the first nationwide population survey containing data about serum iron levels, total iron binding capacity, and serum ferritin levels as well as hemoglobin levels in South Korea. According to KNHNES-V, anemia occurs more frequently in women (12.6%) than in men (2.4%). In women aged 15–55 years, the prevalence of anemia (7.9–14.7%) was significantly higher than that in men (0–3.0%) of the same age group. However, the prevalence of anemia in men and women in other age groups was comparable. The prevalence of IDA was 11.5% in premenopausal women in Korea. When compared to the prevalence of IDA in 18–49-year old men, the relative risk (RR) of IDA was high in lactating women, non-pregnant premenopausal women, and pregnant women, at 35.6, 42.8, and 95.5, respectively.11 Heavy menstrual bleeding (HMB) is strongly associated with IDA in non-pregnant premenopausal women and HMB is caused by diseases such as adenomyosis, leiomyoma of uterus.12 Although the volume of menstrual bleeding is a major determinant of IDA in premenopausal women,13 KNHNES-V did not include this information. A limitation of the KNHNES-V is therefore that it does not allow to associate the volume of menstrual bleeding with the risk of developing anemia.
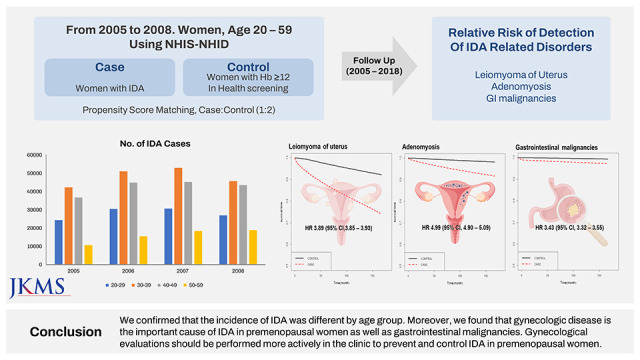
The goal of public health screening programs is to detect and prevent disease early and to thereby reduce the disease burden and the associated social cost.14 Anemia is a significant health burden both in developing and developed countries.7 Therefore, anemia, ID, and IDA are relevant targets for public health screening and should be directed at the high-risk population such as that of premenopausal women. In order to control anemia effectively, anemia screening should be complemented by administration of iron supplements to improve ID and IDA. The aim of this study was to estimate the nationwide prevalence of IDA and to investigate the risk factors of IDA in premenopausal women, a particularly high-risk group of IDA, using the National Health Insurance Service - National Health Information Database (NHIS-NHID).
METHODS
Data source
The NHIS-NHID was used in this study. The NHID is a public database on health care utilization, health screening, socio-demographic variables, and mortality for the whole population of South Korea, formed by the NHIS. The NHIS-NHID includes information including medical treatment, health screening records, and eligibility data from an existing database system.15 It also includes information about citizens including healthcare qualifications and premiums, health examination results, medical history, long-term medical care insurance materials for the elderly, current status of medical treatment, registration information for cancer and rare intractable diseases, and many more. It is an extensive data set with 1.3 trillion entries.
Study population
Women aged 20–59 years who were diagnosed with IDA between January 2002 and December 2008 were initially extracted from NHID. After the wash-out period from 2002 to 2004, women aged 20–59 years who were newly diagnosed with IDA between 2005 and 2008 were identified as the case group. To identify IDA patients, we used the classification code ICD-10 and we included individuals with IDA (code D50), other nutritional anemias (code D53.9), or other anemias (code D64.9), who were additionally prescribed iron supplements (Supplementary Table 1). Patients with previous history of malignancies except gastrointestinal tract malignancies and patients under hemodialysis were excluded from the case group. A 10-year follow up of the study population was determined to evaluate outcome variables in newly diagnosed IDA patients. Data of the control group were extracted from the NHIS-NHID between January 2005 and December 2008. Individuals with a healthy hemoglobin level of 12 g/dL or higher were chosen. Patients with previous history of anemia and iron replacement therapies were excluded in this study. To define the control group, we used propensity score matching. Individuals in the control group were age-matched (using a logistic regression model) and, per IDA patient, two controls were included (ratio, 1:2).
IDA-related disorders (IRDs) were defined as disorders resulting in chronic blood loss in premenopausal women. The IRDs included in this study were gynecological disorders that result in menorrhagia, such as leiomyoma of uterus (LM, ICD-10 code: D25) and adenomyosis (AM, ICD-10 code: N80), and gastrointestinal malignancies (GIMs, ICD-10 code: C15-C21). These IRDs were also identified in the NHID. Women in the case and control groups were followed up for IRD detection from the first day of IDA diagnosis until the data cut-off day of the study or death. The date of data cut-off of IRDs follow up was 31 December 2018.We extracted data of 535,249 women who were diagnosed with IDA and of 1,070,498 women for the control group.
Statistical analysis
The incidence of IDA was calculated by dividing the number of newly diagnosed IDA cases by the total number of Korean women per year. The age-specific incidence rate of IDA was calculated by dividing the number of newly diagnosed IDA cases observed in a certain age group by the total number of same-aged Korean women per year. The χ2 test was performed for the descriptive statistics. Time from the initial diagnosis of IDA to the initial diagnosis of IRDs was calculated using the Kaplan–Meier estimator for the 10-year-follow-up period. The Cox proportional hazard model was implemented to estimate the RR of IRDs and 95% confidence intervals (CIs). All statistical analyses were performed using SAS 9.4 version (SAS Institute Inc., Cary, NC, USA) and the R version 2.13.
Ethics statement
This study was approved by the Institutional Review Board (IRB) of National Health Insurance Service Ilsan Hospital (IRB No: NHIMC-2019-06-017). Obtaining participants’ informed consent was waived due to the retrospective nature of this study by the IRB of National Health Insurance Service Ilsan Hospital. All methods were performed in accordance with the Declaration of Helsinki.
RESULTS
Incidence of IDA in different age groups
Between 2005 and 2008, a total of 535,249 women with newly diagnosed IDA were identified in the NHID database. The total number of IDA cases and the incidence of IDA per 100,000 women increased from 2005 to 2007 and started to decrease in 2008 (Table 1). The annual incidence of IDA per 100,000 population in each age subgroup is summarized in Table 1. Fig. 1 shows the total number of IDA cases by age group between 2005 and 2008. Throughout the whole study period, women aged 30–39 years had the highest incidence of IDA (35.7%), followed by women aged 40–49 years (31.6%), 20–29 years (20.9%), and 50–59 years (11.8%), and there was little difference in the proportion of each age group every study year. As shown in Table 1 and Fig. 1, the total number of newly diagnosed IDA cases increased steadily in the oldest age group, while it started to decrease in the other age groups. The incidence of IDA per 100,000 population followed the same trend in all age groups.
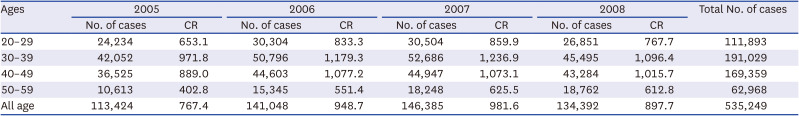
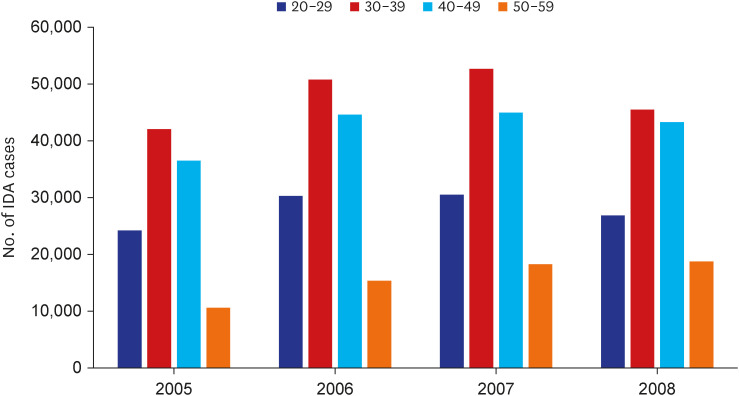
Table 1
Number of iron deficiency anemia and crude incidence rate of iron deficiency anemia
![]()
The risk of IRDs was higher in premenopausal women with IDA
To identify the risk of IRDs, we compared IRD incidence in IDA patients with that in the control group. IRDs were more common in the case group than in the control group. LM was diagnosed in 20.8%, AM in 5.6%, and GIM in 2.6% patients in the case group. In the control group, 6.9% were diagnosed with LM, 1.6% with AM, and 0.7% with GIM. The risk of detection (ROD) of LM, AM, and GIM was 3.89 (95% CI, 3.85–3.93), 4.99 (95% CI, 4.90–5.09), and 3.43 (95% CI, 3.32–3.55), respectively (Table 2, Fig. 2). The ROD was higher in all age groups of the case group than in those of the control group (Table 3). The ROD of LM and AM were 3–4 times and 5–6 times higher, respectively, in all age groups of the case group than of the control group. In contrast, the ROD of GIM (4.729; 95% CI, 4.378–5.109) was the highest in the age group 50 years and older, while the RR of GIM of other age groups of the case group were only 2–3 times higher than that in the control group.
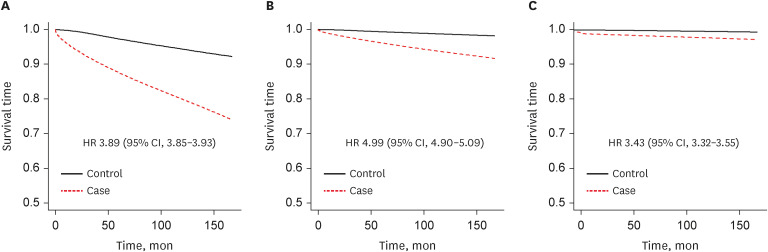
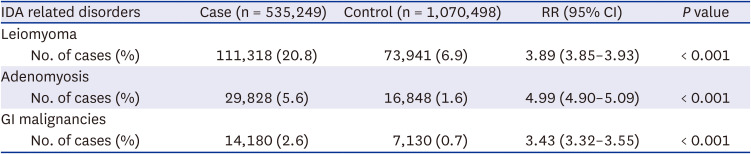
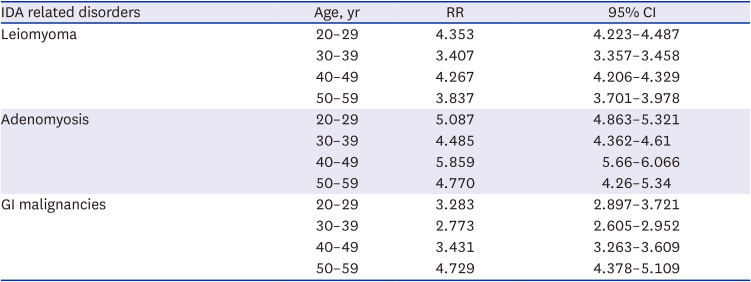
Fig. 2
The relative risk of detection of IDA related disorders. The relative risk of detection of IDA related disorders were calculated. (A) Leiomyoma of uterus. (B) Adenomyosis. (C) Gastrointestinal malignancies.
HR = hazard ratio, CI = confidence interval.
![]()
Table 2
The relative risk of detection of iron deficiency anemia related disorders
![]()
Table 3
The relative risk of detection of IDA related disorders in patients with IDA by age groups
The relative ROD was higher in each age group of the case group than in that of the control group.
IDA = iron deficiency anemia, RR = relative risk, CI = confidence interval, GI = gastrointestinal.
![]()
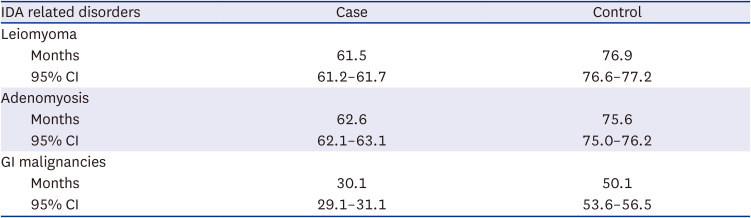
The median follow-up duration in the case and control groups was 143 months (interquartile range [IQR], 131–155) and 133 months (IQR, 109–148), respectively. During the follow-up period from 2005 to 2018, the mean time to detect IRDs was significantly shorter in the case group than in the control group regardless of IRD subtypes (Table 4). The mean time to detect leiomyoma of uterus (LM, 61.5 vs. 76.9 months) and adenomyosis (AM, 62.6 vs. 75.6 months) was > 60 months in the case and control groups, but the mean time to detect malignancies in the gastrointestinal tract (GIM, 30.1 vs. 50.1 months) was shorter than that of the other IRDs in both the case and control groups.
The risk of IRDs in premenopausal women with IDA varied with age
The ROD of IRDs in the case group revealed that the ROD of each IRD varied between age groups (Table 5). The ROD of LM in the case group increased in age groups 30–39 years (RR 2.33), 40–49 years (RR 3.09), and 50–59 years (RR 1.19) compared with that in the age group 20–29 years. The ROD of AM increased in the age groups 30–39 years (RR 1.53) and 40–49 years (RR 1.25) compared with that in the 20–29 years age group. In contrast, the relative ROD of AM in the age group 50–59 years decreased to 0.26 compared with that in the 20–29 years age group. In the case group, the ROD of GIM increased in all age groups compared with that in the 20–29 years age group. Unlike the ROD of the gynecological disorders such as LM or AM, the ROD of GIM increased by more than 5 times in the 50–59 years age group compared with that in the 20–29 years age group.
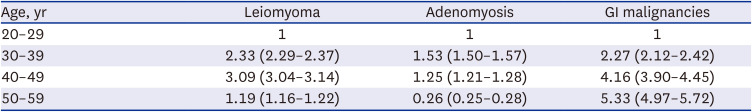
Table 5
The relative risk of detection of iron deficiency anemia related disorders by aging
![]()
DISCUSSION
In this study, we confirmed that the annual incidence of IDA was different by age group, and we found that LM, AM, and GIM were more frequently detected in premenopausal women with IDA than in premenopausal women without IDA. In addition, gynecologic disease such as LM and AM is the main cause of IDA in premenopausal women. Although it seems like there was no significant difference in the distribution of anemia by age group from 2005 to 2008, the trend of developing IDA by age group changed slowly during the study period. Taking a closer look at the pattern of IDA distribution and IDA cases, we found subtle changes in the total number of newly diagnosed IDA cases. The total number of newly diagnosed IDA cases in women aged 20–49 years increased from 2005 to 2007 but had started to decrease by 2008. However, the total number of newly diagnosed IDA cases in women aged 50–59 years increased continuously during the study period owing to the continuous increase of the total population aged 50 years and older.16 This could be an early sign of the social aging process in South Korea. The incidence of IDA was the highest in the 30–39 years age group, followed by the 40–49 years age group. Women within the 20–29 years age group frequently visit the clinic owing to pregnancy and childbirth, which were the most important risk factors of IDA. The relatively higher incidence of IDA in women aged 40–49 years was interpreted as a result of the national health screening program provided by the NIHS of South Korea, which is only accessible to women aged 40 years and older.17
From 2005 to 2018, IRDs were more frequently detected in the case group than in the control group. This means that the undisclosed preexisting IRDs were discovered during the follow up period for IDA. LM, AM, and GIM were reported in 20.8%, 5.6%, and 2.6% of all IDA patients, respectively. Depending on the study population and diagnostic methods, the worldwide prevalence of LM and AM has been reported to be between 5.4% and 77%18 and 5% and 70%,19 respectively. In South Korea, the prevalence of LM increased from 0.96% in 2002 to 2.43% in 2013 in women of reproductive age (15–54 years) selected from the NHIS sample cohort dataset.20 The prevalence of AM in women of all age groups selected from the Health Insurance Review and Assessment (HIRA) database was 12.4–13.5%.21 In this study, LM was found in 20.8% of premenopausal women with anemia and 6.8% in premenopausal women with normal hemogram results. This finding suggests that LM is associated with the development of anemia in premenopausal women. The prevalence of AM was also found to be higher in premenopausal women with IDA (5.6%) than in the control group (1.6%). Although its prevalence (12–13%) was not as high as that of LM, AM is also thought to be related to the pathogenesis of anemia in premenopausal women. The mean time from initial IDA diagnosis to the detection of LM and AM was approximately 5 years. The ROD of IRDs was higher in patients with anemia. Especially the ROD of LM and AM in the 20–29 years case group were 4–5 times higher than that in the 20–29 years control group. In general, gynecological disorders such as LM and AM are not common at young age (20–29 years) and in individuals with normal hemogram results. The prevalence of these gynecologic disorders is therefore increasing with age and begins to decrease after the age of 50. Most young women are facing difficulties visiting a gynecology clinic for screening these IRDs resulting in heavy menstrual bleeding even in women with IDA. Cultural background,22 age, educational level, income level, accessibility to clinic and many socioeconomic factors are associated with non-screening status of gynecological conditions of Korean adult women.23 Therefore, proactive screening tests for IRDs and campaigns aimed at encouraging visits to gynecology clinics on a regular basis should be considered to control IDA in premenopausal women in Korea including women aged 20–29 years.
The ROD of LM was higher in the older age groups (30–50 years) than in the younger age group (20–29 years). AM, in contrast, was most frequently found in the age group 30–39 years of women with IDA, and then its prevalence gradually decreased, and the ROD of AM in women aged 50 years or older was significantly lower than that in the 20–29-year olds. These differences in the ROD between LM and AM are thought to be due to differences in clinical manifestations.24 To understand the precise mechanism behind these differences, further investigations are required.
GIM were found in 2.6% and 0.7% of women in the case and control group, respectively, and the average time to diagnosis was 30 months. According to the Korean cancer statistics in 2019, GIM were found in 0.07% of women in age of 35–64 years.25 The ROD of GIM in this study was higher than that in other reports of the prevalence of malignancies in all premenopausal women (1.6%).26 In addition, the ROD of GIM in the case group was 2–3 times higher in women aged 20–40 years and 4 times higher in 50–59 years age group than that in the control group. While the ROD of GIM was lower than that of LM or AM, considering the huge clinical impact of GIM on patients‘ survival, the importance of endoscopic evaluation even in premenopausal women with anemia cannot be overemphasized.
Owing to the nature of the NHIS data, there are some limitations in this study. First, it was not possible to analyze detailed information on the type or severity of anemia. Second, we used some working definitions of IDA and premenopausal women to overcome the limitations of the NHIS data. Based on the results of the previous study (KNHNES-V), 90% of anemia of premenopausal women was categorized as IDA.11 As the NHIS data do not contain information on the menopausal state, the study participants were limited to women with specific ICD-10 codes and certain age groups.
A number of studies have demonstrated that gastrointestinal bleeding is a common cause of IDA. The number of studies evaluating the relationship between IDA and gynecological disorders resulting in uterine bleeding in premenopausal women is limited. This study revealed the incidence of IDA and the association between IDA and gynecologic disease such as LM and AM in premenopausal women. It also showed the frequency and pattern of the ROD of IRDs after the initial diagnosis of IDA. The time from the initial IDA diagnosis to IRD detection varies depending on the access to health care service of an individual. Until August 2019, the cost of gynecological ultrasonography was not reimbursed by Korean NHIS, and many women had difficulty to visit a gynecology clinic owing to financial issues. In addition, since January 2019, national health screening service was made available to women aged 20 years and older. To confirm the impact of these kinds of changes in health care service accessibility on IDA control in South Korea, a more comprehensive population-based study will be necessary. This study would have significance in health care service by showing the importance of routine gynecologic screening in premenopausal women in developed countries as well as South Korea.
 XML Download