Journal List > J Korean Med Sci > v.38(34) > 1516083853

Han, Jung, Jeong, and Hong: Are We Truly Safe? Unfolding the Final Chapters of COVID-19 Walk-Through Booths

Abstract

This research proposes a safety strategy for coronavirus disease 2019 (COVID-19) walk-through booths to optimize pandemic preparedness. These booths, designed for respiratory sample collection during the COVID-19 pandemic, effectively reduce infection risk and personal protective equipment-related fatigue among healthcare workers. However, inadequate disinfection and glove management could escalate infection transmission. Using computational fluid dynamics simulations, we analyzed droplet dispersion on booth surfaces and gloves under various wind conditions. Our findings suggest that when setting up COVID-19 walk-through booths, their location should be strategically chosen to minimize the effects of wind. All surfaces of booth gloves must be thoroughly disinfected with a certified disinfectant after nasopharyngeal swab collection. It is also recommended to wear disposable gloves over booth gloves when changing between patient examinations. In wind-affected areas, individuals nearby should not solely rely on the 2-meter distancing rule due to potential droplet spread from walk-through booths. We strongly recommend consistent and proper mask use for effective droplet blocking. Adherence to these guidelines can significantly enhance the safety and efficiency of walk-through booths, particularly in potential future pandemics.

Graphical Abstract

jkms-38-e290-abf001.jpg

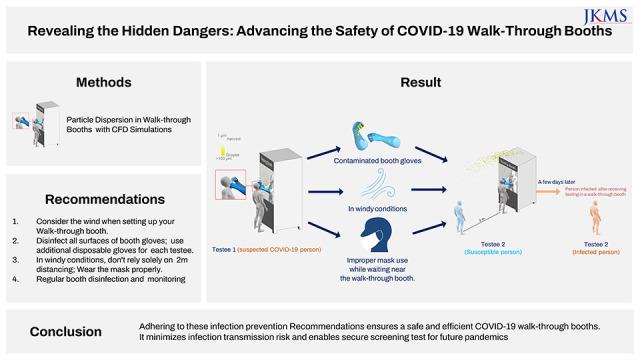
Throughout the coronavirus disease 2019 (COVID-19) pandemic, booth-type screening clinics served as a critical tool in mitigating infection risks during nasopharyngeal swab testing.123 These booths significantly reduced direct contact between healthcare professionals and patients, thus alleviating the fatigue associated with the frequent donning and doffing of personal protective equipment. There are two primary booth designs: negative pressure booths for those being tested and positive pressure booths for medical personnel. However, booths with integrated gloves can potentially become contamination sources if proper disinfection procedures aren't followed or if gloves aren’t replaced after each swab collection. Given that coronaviruses can persist on various surfaces for up to 9 days4 and aerosols produced from coughing or sneezing during testing can lead to cross-contamination,56 thorough and systematic disinfection and proper glove replacement protocols are crucial. Despite the relatively low risk of airborne transmission outdoors due to air circulation, it is important to consider wind effects.
Addressing the concerns of potential contamination, we conducted a study utilizing computational fluid dynamics (CFD) simulation—an alternative to physical experiments under challenging or uncontrollable environmental conditions—to investigate droplet dispersion on the surfaces and integrated gloves (hereafter referred to as ‘booth gloves’) of walk-through booths during nasopharyngeal swab collection. ANSYS CFX 2020 R2 software was used for this analysis. The shear stress transport turbulence model was used for the air turbulence, and Lagrangian particle tracking was used for the droplet transport and trajectories.789 During the simulation, the testee stood in front of the booth, and medical staff inside the booth, with positive pressure formed, wore gloves attached to the booth while collecting nasopharyngeal swab samples. In the cough discharge scenario, we simulated the particle discharge for infectious particles by considering the testee coughing during nasopharyngeal swab collection. This scenario represents a worst-case situation due to the high concentration and varied sizes of droplets.1011 We investigated this scenario under five wind conditions: no wind, east, west, south, and north, with the wind velocity, temperature, and relative humidity set to 2.3 m/s, 12.5°C, and 69%, respectively, reflecting the annual average climate conditions of Korea. According to the previous studies that investigated the velocity of respiratory activities, the average of initial velocity of speaking and coughing was 2.31–4.07 m/s and 10.6–15.3 m/s.121314 Another previous study showed that the size of the expelled droplets from speaking and coughing ranged from 1 to 10 μm, and 1 to 1,000 μm.1516171819 The number of particles expelled during speaking and coughing was 2,600 per second and 947–4,897.13162021 A single cough with a peak air velocity of 13 m/s was considered. Droplets sized under 50 μm stayed airborne for a significant enough time to be inhaled and transported through the air over long distances with the wind.2223 Droplets larger than 100 μm tend to fall near the emission source due to gravitational sedimentation.2324 Therefore, the droplets in the range of 1–100 μm with the number of 4,800 were considered to investigate the airborne transmission.242526 All particles contacted with the surface were considered to be deposited.23
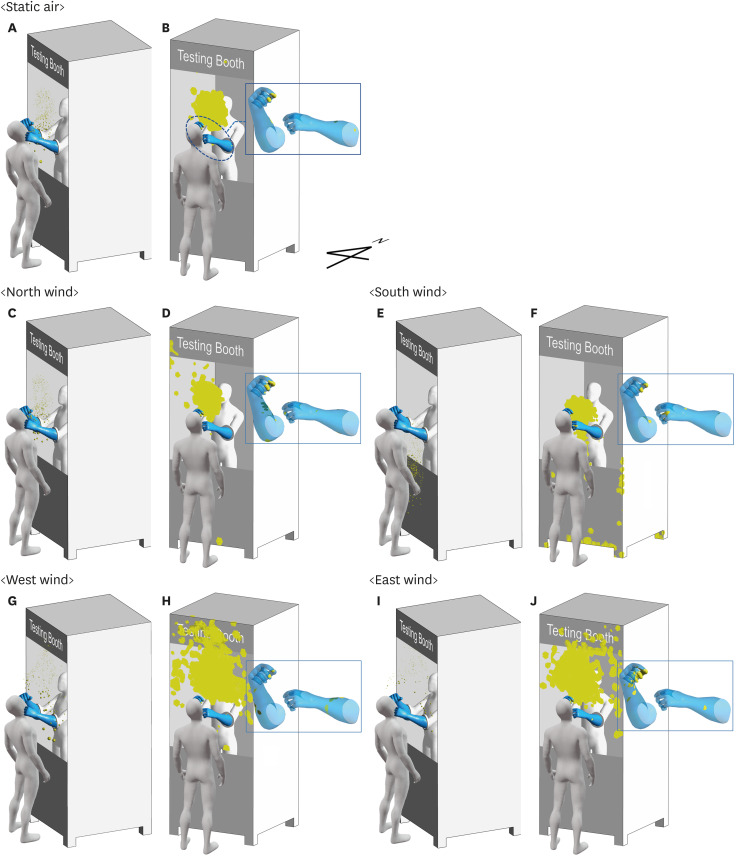
The results are presented as follows: Fig. 1A illustrates the particle dispersion (shown in yellow) 1 second after the testee coughed during the collection of the respiratory sample in a windless condition. Fig. 1B shows the droplet deposition pattern on the booth and the gloves. Large droplets (≥ 50 μm) tend to descend, while smaller droplets exhibit an upward dispersion pattern near the testee. The majority of droplets were found to deposit on the front surface of the walk-through booth and the right gloves of medical staff situated close to the testee’s mouth.
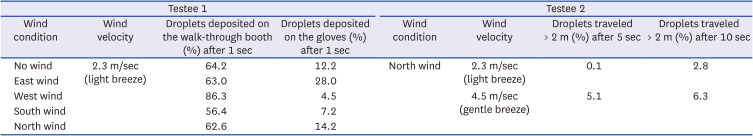
Fig. 1C-J shows the dispersion and deposition patterns of droplets according to the wind direction. Droplets moved upward with the north wind and moved downward with the south wind. The east wind scenario showed the highest deposition rate (28.0%), probably because the medical staff collected the sample with their right hand, and the west wind scenario showed a relatively low deposition rate (4.5%) (Table 1). Table 1 provides the detailed ratios of droplets that deposited on the booth and gloves, as well as the ratios of droplets that traveled more than 2 meters from testee 1.
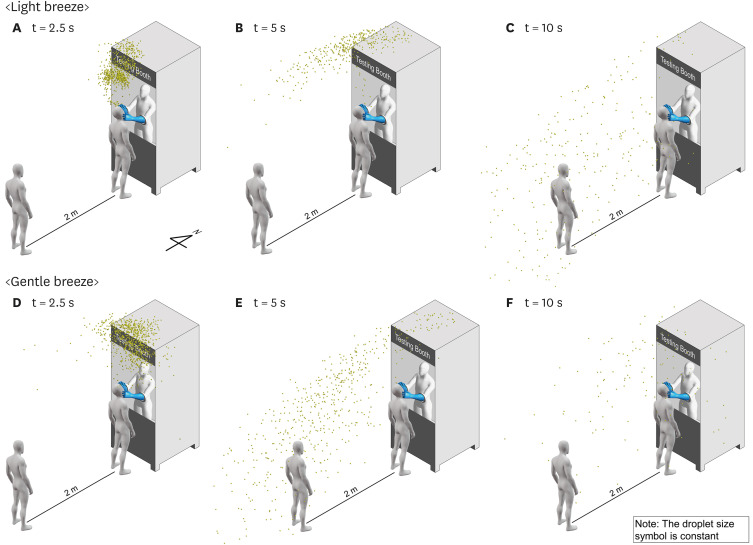
Fig. 2 demonstrates the particle dispersion when another testee (testee 2) stood 2 meters behind testee 1 during respiratory sample collection. Wind conditions corresponding to the Beaufort wind force scale, specifically “light breeze” (wind speed of 2.3 m/s) and “gentle breeze” (wind speed of 4.5 m/s), were considered for this analysis. The CFD simulation revealed that droplets that traveled more than 2 meters from testee 1 were predominantly in the size range of 50 μm or smaller. For a light breeze, droplets that traveled more than 2 meters accounted for approximately 0.1% and 2.8% of the total expelled droplets at 5 seconds and 10 seconds, respectively. For a gentle breeze, droplets that traveled more than 2 meters accounted for approximately 5.1% and 6.3% of the total expelled droplets at 5 seconds and 10 seconds, respectively. These findings indicate that relying solely on a 2-meter physical distancing measure during respiratory sample collection is not sufficient to ensure safety. Instead, it is crucial to wear respiratory protective equipment to effectively block droplet transmission during such procedures.
Based on the considerations outlined above, we suggest several infection control measures for the safe use of walk-through booths.
When setting up a COVID-19 walk-through booth, it is important to consider a location that will minimize the effects of wind. Minimize contamination during the test process by providing only essential items for nasopharyngeal swab collections, avoiding placing clean medical items outside the booth. For nasopharyngeal swab tests, it is recommended to thoroughly disinfect all booth glove surfaces with a certified disinfectant and to wear additional disposable gloves over the booth gloves. This allows for easy glove change between patient examinations, reducing cross-contamination risks. Due to the potential for droplet spread from these booths, bystanders should not rely solely on a 2-meter distance but on proper use of masks. Regular surface disinfection of walk-through booths and continuous safety monitoring are paramount to minimizing the risk of contamination. By following these infection prevention measures, the operation of the COVID-19 walk-through booth can be made safe and efficient.
Furthermore, in situations where multiple walk-through booths are arranged in a linear configuration or respiratory sample collection is conducted outdoors without booths, we propose a follow-up study to suggest strategies through the implementation of measures such as barrier installation or alternative solutions. This approach not only minimizes the risk of infection transmission but also enables secure screening while preparing for potential future epidemics.

Notes

Disclosure: The authors have no potential conflicts of interest to disclose.

Author Contributions:

  • Conceptualization: Han SH, Jung M.

  • Data curation: Jung M.

  • Formal analysis: Jung M, Hong J.

  • Investigation: Han SH, Jung M.

  • Methodology: Jung M, Hong J.

  • Project administration: Hong J.

  • Validation: Han SH.

  • Visualization: Jung M.

  • Writing - original draft: Han SH, Jung M.

  • Writing - review & editing: Han SH, Jeong HJ.

References

1. Kwon KT, Ko JH, Shin H, Sung M, Kim JY. Drive-through screening center for COVID-19: a safe and efficient screening system against massive community outbreak. J Korean Med Sci. 2020; 35(11):e123. PMID: 32193904.
crossref
2. Kim SI, Lee JY. Walk-through screening center for COVID-19: an accessible and efficient screening system in a pandemic situation. J Korean Med Sci. 2020; 35(15):e154. PMID: 32301300.
crossref
3. Lee J. COVID-19 screening center: how to balance between the speed and safety? J Korean Med Sci. 2020; 35(15):e157. PMID: 32301302.
crossref
4. Kampf G, Todt D, Pfaender S, Steinmann E. Persistence of coronaviruses on inanimate surfaces and their inactivation with biocidal agents. J Hosp Infect. 2020; 104(3):246–251. PMID: 32035997.
crossref
5. Cismaru CA, Chira S, Cismaru GL, Nutu AM, Netea MG, Berindan-Neagoe I. Assessment of the frequency of coughing and sneezing triggered by nasopharyngeal swabbing in the pandemic setting. Sci Rep. 2022; 12(1):1–8. PMID: 34992227.
crossref
6. Wang H, Liu Q, Hu J, Zhou M, Yu MQ, Li KY, et al. Nasopharyngeal swabs are more sensitive than oropharyngeal swabs for COVID-19 diagnosis and monitoring the SARS-CoV-2 load. Front Med (Lausanne). 2020; 7:334. PMID: 32626720.
crossref
7. Menter FR, Kuntz M, Langtry R. Ten years of industrial experience with the SST turbulence model. Hanjalić K, Nagano Y, Tummers MJ, editors. Turbulence, Heat and Mass Transfer. Ankara, Turkey: International Centre for Heat and Mass Transfer;2003. p. 625–632.
8. Hathway EA, Noakes CJ, Sleigh PA, Fletcher LA. CFD simulation of airborne pathogen transport due to human activities. Build Environ. 2011; 46(12):2500–2511. PMID: 32288014.
crossref
9. Zhang Z, Chen Q. Experimental measurements and numerical simulations of particle transport and distribution in ventilated rooms. Atmos Environ. 2006; 40(18):3396–3408.
crossref
10. Aliabadi AA, Rogak S, Green SI, Bartlett KH. CFD Simulation of human coughs and sneezes: a study in droplet dispersion, heat, and mass transfer. In : Proceedings of the ASME 2010 International Mechanical Engineering Congress and Exposition. Volume 7: Fluid Flow, Heat Transfer and Thermal Systems, Parts A and B; November 12-18, 2010; Vancouver, BC, Canada. New York, NY, USA: American Society of Mechanical Engineers;2010. p. 1051–1060.
11. Gupta JK, Lin CH, Chen Q. Flow dynamics and characterization of a cough. Indoor Air. 2009; 19(6):517–525. PMID: 19840145.
crossref
12. Kwon SB, Park J, Jang J, Cho Y, Park DS, Kim C, et al. Study on the initial velocity distribution of exhaled air from coughing and speaking. Chemosphere. 2012; 87(11):1260–1264. PMID: 22342283.
crossref
13. Chao CY, Wan MP, Morawska L, Johnson GR, Ristovski ZD, Hargreaves M, et al. Characterization of expiration air jets and droplet size distributions immediately at the mouth opening. J Aerosol Sci. 2009; 40(2):122–133. PMID: 32287373.
crossref
14. VanSciver M, Miller S, Hertzberg J. Particle image velocimetry of human cough. Aerosol Sci Technol. 2011; 45(3):415–422.
crossref
15. Gralton J, Tovey E, McLaws ML, Rawlinson WD. The role of particle size in aerosolised pathogen transmission: a review. J Infect. 2011; 62(1):1–13. PMID: 21094184.
crossref
16. Duguid JP. The size and the duration of air-carriage of respiratory droplets and droplet-nuclei. J Hyg (Lond). 1946; 44(6):471–479. PMID: 20475760.
crossref
17. Yang S, Lee GW, Chen CM, Wu CC, Yu KP. The size and concentration of droplets generated by coughing in human subjects. J Aerosol Med. 2007; 20(4):484–494. PMID: 18158720.
crossref
18. Smith SH, Somsen GA, van Rijn C, Kooij S, van der Hoek L, Bem RA, et al. Aerosol persistence in relation to possible transmission of SARS-CoV-2. Phys Fluids. 2020; 32(10):107108.
crossref
19. Tang JW, Nicolle A, Pantelic J, Koh GC, Wang LD, Amin M, et al. Airflow dynamics of coughing in healthy human volunteers by shadowgraph imaging: an aid to aerosol infection control. PLoS One. 2012; 7(4):e34818. PMID: 22536332.
crossref
20. Fitzgerald DW, Sterling TR, Haas DW. Mycobacterium tuberculosis. Mandel GL, Bennett JE, Dolin RD, editors. Mandell, Douglas, and Bennett’s Principles and Practice of Infectious Diseases. 8th ed. Philadelphia, PA, USA: Elsevier;2015.
21. Stadnytskyi V, Bax CE, Bax A, Anfinrud P. The airborne lifetime of small speech droplets and their potential importance in SARS-CoV-2 transmission. Proc Natl Acad Sci U S A. 2020; 117(22):11875–11877. PMID: 32404416.
crossref
22. Vuorinen V, Aarnio M, Alava M, Alopaeus V, Atanasova N, Auvinen M, et al. Modelling aerosol transport and virus exposure with numerical simulations in relation to SARS-CoV-2 transmission by inhalation indoors. Saf Sci. 2020; 130:104866. PMID: 32834511.
crossref
23. Jung M, Chung WJ, Sung M, Jo S, Hong J. Analysis of infection transmission routes through exhaled breath and cough particle dispersion in a general hospital. Int J Environ Res Public Health. 2022; 19(5):2512. PMID: 35270214.
crossref
24. Feng Y, Marchal T, Sperry T, Yi H. Influence of wind and relative humidity on the social distancing effectiveness to prevent COVID-19 airborne transmission: a numerical study. J Aerosol Sci. 2020; 147:105585. PMID: 32427227.
crossref
25. Yang L, Li X, Yan Y, Tu J. Effects of cough-jet on airflow and contaminant transport in an airliner cabin section. J Comput Multiph Flows. 2018; 10(2):72–82.
crossref
26. Ooi CC, Suwardi A, Ou Yang ZL, Xu G, Tan CK, Daniel D, et al. Risk assessment of airborne COVID-19 exposure in social settings. Phys Fluids. 2021; 33(8):087118.
crossref
Fig. 1

Droplet dispersion and deposition on the booth and the gloves after 1 seconds of coughing for different incoming wind directions of (A, B) static air; (C, D) north wind; (E, F) south wind; (G, H) west wind; (I, J) east wind.

jkms-38-e290-g001
Fig. 2

Droplet dispersion when the wind blows from the north. (A-C) Depicting the dispersion of droplets at 2.5 seconds, 5 seconds, and 10 seconds after coughing under the influence of a light breeze. (D-F) Illustrating the dispersion of droplets at 2.5 seconds, 5 seconds, and 10 seconds after coughing with a gentle breeze. For visualization purposes, the particle size has been kept constant.

jkms-38-e290-g002
Table 1

The ratio of the droplets that deposited on the walk-through booth and booth gloves and the ratio of the droplets that traveled more than 2 m

jkms-38-e290-i001
Testee 1 Testee 2
Wind condition Wind velocity Droplets deposited on the walk-through booth (%) after 1 sec Droplets deposited on the gloves (%) after 1 sec Wind condition Wind velocity Droplets traveled > 2 m (%) after 5 sec Droplets traveled > 2 m (%) after 10 sec
No wind 2.3 m/sec (light breeze) 64.2 12.2 North wind 2.3 m/sec (light breeze) 0.1 2.8
East wind 63.0 28.0
West wind 86.3 4.5 4.5 m/sec (gentle breeze) 5.1 6.3
South wind 56.4 7.2
North wind 62.6 14.2
TOOLS
Similar articles