

 PDF
PDF Citation
 Print
Print


INTRODUCTION
In Korea, waste disposal methods currently include landfill, recycling, and incineration.1 In 2019, the amount of waste treated by incineration accounted for approximately 5.2% of the total, but the proportion is gradually increasing due to difficulties in securing a landfill site and health problems associated with landfilling.23
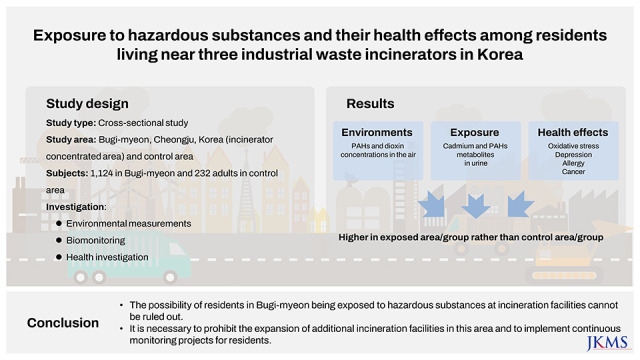
Incineration facilities, one of the avoidance facilities, are concentrated and distributed in a specific area rather than evenly distributed throughout the country for a variety of reasons, including economic feasibility. Cheongju-si, Chungcheongbuk-do, located in the center of South Korea, is one of the highly representative areas with waste incineration (WI) facilities, as waste transportation costs can be reduced due to geopolitical advantages. In particular, three commercial industrial WI facilities are clustered within a 3-km radius of Bugi-myeon, a small town with a registered population of approximately 5,000 (Proportion of elderly (≥ 65 years), October 2019: 35.3%) in Cheongju-si, Chungcheongbuk-do, and these three plants can process approximately 540 ton of waste per day.34 Of these, the first incinerator, with two combustion chambers, began operations in 1999 and has a capacity of 99.84 ton per day, while the second, with three combustion chambers, began operations in 2001 and has a capacity of 352.8 ton per day. In 2010, a third incinerator with one combustion chamber began operation, with a capacity of 91 tons per day.3 Some of them were involved in legal lawsuits with the city of Cheongju over the illegal expansion of incineration facilities. Residents living near incinerators asked the South Korean government for an epidemiological investigation in 2019, claiming that they were exposed to pollutants from WI facilities.
Pollutants generated from WI facilities include persistent organic pollutants, dioxins, heavy metals, and polycyclic aromatic hydrocarbons (PAHs), which vary greatly depending on waste type, combustion conditions, and incineration facility type.5678 The incineration process emits harmful substances into the environment through the release of incineration gases into the atmosphere, the ash and slack remaining after incineration, and the release of used cooling water.8 Of these, ash, slag, and cooling water contamination can be relatively well controlled through appropriate methods, but emissions to the atmosphere are the most common pathways through which people can be exposed.9 In terms of health effects, particulate matter, dioxins, furans, PAHs, and heavy metals are attracting more attention among the harmful substances emitted into the atmosphere.5678
Chronic incinerator particle exposure is known to increase mortality, particularly from cardiovascular, cerebrovascular, and respiratory diseases, whereas acute incinerator particle exposure is known to primarily affect cardiopulmonary function, even leading to death from cardiac arrest or respiratory disease.7101112 Many studies have found that being exposed to hazardous substances from incineration facilities increases the risk of cancer. Among them, the most commonly reported cancer cases are soft tissue sarcoma1314 and non-Hodgkin lymphoma,1516 presumably associated with the dioxin exposure from incineration facilities. Although numerous studies have been conducted on the health effects of incinerators, few have been conducted in Korea. This study aimed to evaluate exposure to various hazardous substances and the health effects of incineration facilities for residents of Bugi-myeon, Cheongju-si, which has three of these facilities. This is Korea’s first large-scale epidemiological study, and it was conducted at the request of local residents living near the incinerator.
METHODS
Study subjects
In this study, Bugi-myeon, Cheongju-si, where three WI facilities are located, was selected as the exposed area, whereas Miwon-myeon, Cheongju-si, and Iwol-myeon, Jincheon-gun, 16 km and 23 km away from the exposed area, respectively, were selected as control areas. The subjects from the exposure area were all residents who had lived in the area for more than 10 years, while those who had lived in the control areas for more than 10 years were recruited on a first-come, first-served basis. A total of 1,224 adults from the exposed area in Bugi-myeon participated in the survey, whereas 232 adults from the control areas, Miwon-myeon and Iwol-myeon, with similar living environments to Bugi-myeon, comprised the control group. Among them, 1,112 adults (926 in the exposure area and 186 in the control area) participated in health checkups and biomonitoring. Among the biomarkers, the concentrations of heavy metals and 8-OHdG were measured in all 1,126 subjects, but the concentrations of dioxins and PAH metabolites were measured only in 212 volunteers due to the limited budget. The level of urinary metabolites were corrected by the creatinine concentration; however, individuals (n = 99) with urinary creatinine concentrations outside the range of 0.3–300 mg/dL were excluded from the analysis. All participants were limited to those who had lived in the area for more than 10 years. Individuals with work experience at incinerators were excluded from the analysis. Face-to-face interviews were conducted by experienced interviewers using a structured questionnaire that included demographic questions as well as questions about history of smoking, alcohol consumption, work, food consumption, and disease. Questionnaire, health checkups, and biosampling were conducted between July 2020 and October 2020.
Determination of pollutant levels in the environment
Hazardous substance concentration in the air and soil were measured in the area around the incinerator facility and in the control area. Air samples were collected for three days each in spring, summer, and autumn, and the average value was used for the analysis, whereas, the soil and agricultural products were measured once during summer. The sampling points were marked on the map (Fig. 1). Harmful substances included six heavy metals, namely lead (Pb), chromium (Cr), arsenic (As), nickel (Ni), cadmium (Cd), mercury (Hg), and 16 PAHs (naphthalene, acenaphthylene, acenaphthene, fluorene, phenanthrene, anthracene, fluoranthene, pyrene, benzo [a]anthracene, Chrysene, Benzo[b]fluoranthene, benzo [k]fluoranthene, benzo [a]pyrene, indeno (1,2,3-cd)pyrene, dibenzo [a,h]anthracene, and benzo [ghi]perylene). Heavy metals were quantified using atomic absorption spectroscopy (AAS) after each pretreatment process, and PAHs were analyzed using gas chromatography/mass spectroscopy (GC/MS). All measurements were conducted according to the standard methods for the examination of environmental pollution by the Ministry of Environment, Korea. A total of 17 Polychlorinated dibenzo-p-dioxins and polychlorinated dibenzo-p-furans (PCDD/Fs) was measured in air and soil, and the detailed substances were as follows: 2,3,7,8-TeCDD, 1,2,3,7,8-PeCDD, 1,2,3,4,7,8-HxCDD, 1,2,3,6,7,8 -HxCDD, 1,2,3,7,8,9-HxCDD, 1,2,3,4,6,7,8-HpCDD, OCDD, 2,3,7,8-TeCDF, 1,2,3,7,8-PeCDF, 2,3,4,7,8-PeCDF, 1,2,3,4,7,8-HxCDF, 1,2,3,6,7,8-HxCDF, 2,3,4,6,7,8-HxCDF, 1,2,3,7,8,9-HxCDF, 1,2,3,4,6,7,8-HpCDF, 1,2,3,4,7,8,9-HpCDF, and OCDF. PCDDs/Fs were analyzed using high-resolution gas chromatography-high-resolution mass spectrometry (HRGC-HRMS). Instrumental analysis was conducted by Eurofins Scientific Korea and Donga University, who cooperated with our teams for quality assurance/quality control (QA/QC).

Health Survey and biological sample collection
The health survey included physical examination, including body mass index (BMI) and blood pressure, general hematology, renal function, liver function, lipid levels, thyroid index,and 8-OHdG as an oxidative damage marker. We used Patient Health Questionnaire-9 (PHQ-9) and Korean Dementia Screening Questionnaire- Cognition (KDSQ-C) as psychiatric tests, which are in public domain. Urinary 8-OHdG levels were determined using a commercial enzyme-linked immunosorbent assay kit (Japan Institute for the Control of Aging, Nikken SEIL, Shizuoka, Japan), following the manufacturer’s instructions. The biomonitoring process was managed with quality control protocols: A blood collection system (Becton–Dickinson Vacutainer, Plymouth, UK), blood specimens collected in ethylenediaminetetraacetic acid (EDTA) tubes, serum separation tubes, and heavy metal EDTA tubes. The urine specimens collected were spot urine samples (conical tubes). The specimens were transported by refrigerating them at 4°C and stored at −80°C until analysis.
Determination of pollutant levels in biological samples
Pb in blood, Cd in blood and urine, and As in urine were analyzed using AAS (Pb and Cd in blood: GFAAS, Thermo Inc., Cambridge, UK; Cd in urine: GF-AAS220, Victoria Inc., Varian, Australia). Hg in blood was analyzed with a direct Hg analyzer (Gold Amalgamation Direct Mercury Analyzer, NIC-3000, Nippon Instruments Corporation, Japan) using the gold amalgam method. Urinary concentrations of 1-hydroxypyrene (1-OHP), 2-naphthol, 1-hydroxyphenanthrene (1-OHPHE), and 2-hydroxyfluorene (2-OHF) were measured using GC-MS. Final concentrations are presented as corrected for urinary creatinine concentrations. Diluted or concentrated urine samples based on urinary creatinine concentrations (creatinine < 0.3 g/L and > 3 g/L) were excluded from the final analysis. PCDD/Fs analysis in serum was performed using the same equipment for the same items as the environmental sample analysis. The final concentration was used after correcting for blood lipid concentration.
Statistical analysis
The chi-square test was used to compare categorical demographic or lifestyle variables such as age group, gender, education, household income, smoking status, alcohol consumption, and physical activity between the exposure and control areas. Age, height, weight, BMI, and soil and air levels were expressed as arithmetic means and standard deviations. As the distribution was right-skewed, the levels of biomarkers of pollutants (i.e., heavy metals, PAHs, and dioxins) were log-transformed and presented as the geometric mean (GM) and geometric standard deviation. Statistical comparisons of the continuous variables mean were performed using the Student’s t-test. Multivariate logistic regression analyses were used to examine the association between incineration exposure (or living near an incinerator) with health effects (i.e., abnormality of the physical examination, laboratory tests, psychological tests, self-reported symptoms, and doctor-diagnosed chronic diseases). Multiple linear regression analysis was performed to examine the association of the biomarker levels of pollutants with incineration exposure (or living near an incinerator) after controlling for various potential confounding factors, including age, gender, smoking, alcohol drinking, physical activity, and urinary creatinine level. The level of statistical significance was set at P < 0.05. Statistical analyses were performed using SPSS Statistics Version 25.0 (IBM Corp., Armonk, NY, USA).
RESULTS
Demographic data
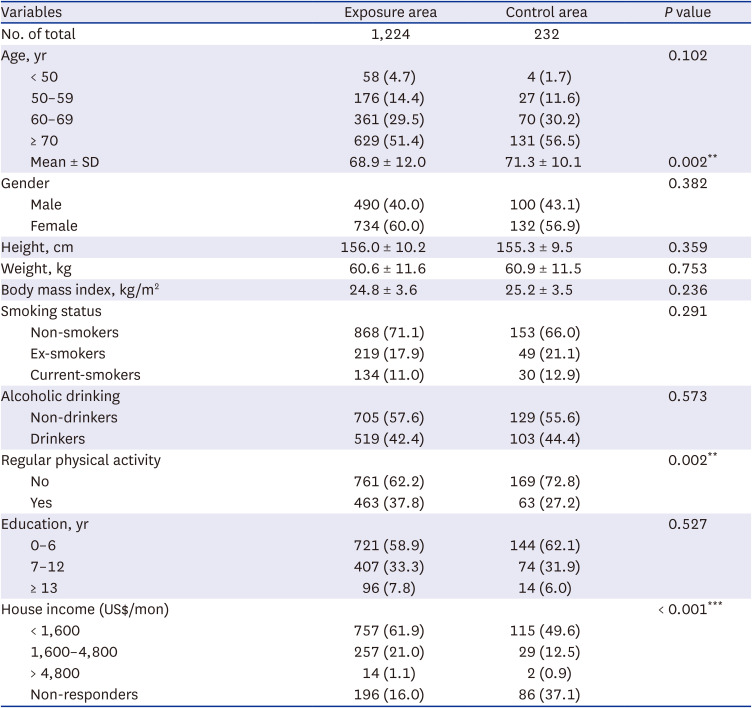
More than half of the participants were over 70 years old in both the exposure and control groups, and the distribution by age group revealed no statistical significance between them. However, the mean age was 68.9 ± 12.0 years in the exposure group and 71.3 ± 10.1 years in the control group, showing a statistically significant difference between the two groups.
No significant differences between the two groups were found in gender, height, weight, BMI, smoking and drinking history, and education. However, the proportion of individuals who exercised regularly was significantly higher in the exposed group. Household income also showed a significant difference between the two groups; however, this seems to be due to the difference in the proportion of people who did not respond (Table 1).
Table 1
General characteristics in the study population
Environmental exposure
The concentrations of the six heavy metals in air did not show statistically significant differences between the exposed and control areas. Hg was not detected in any area. The sum of PAHs and that of PCDD/Fs concentrations showed statistically higher mean values in the exposed area than in the control area. However, the concentration of hazardous substances in the soil was measured only in one place in the control area; thus, statistical testing could not be performed (Table 2).
Table 2
Heavy metals, PAHs, and PCDD/Fs levels in the soil and air of the study area
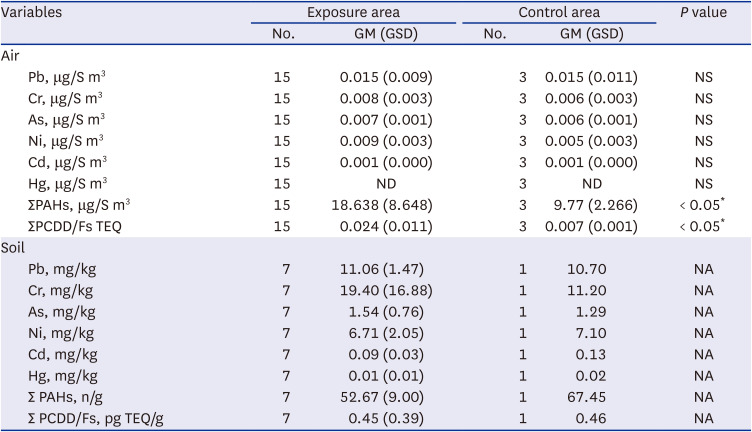
PAHs = polycyclic aromatic hydrocarbons, PCDD/Fs = polychlorinated dibenzo-p-dioxins and polychlorinated dibenzo-p-furans, GM = geometric mean, GSD = geometric standard deviation, Pb = lead, NS = not significant, Cr = chromium, As = arsenic, Ni = nickel, Cd = cadmium, Hg = mercury, ND = not detected, TEQ = toxic equivalents, NA = not applicable.
*P < 0.05.
Biomarker levels in the subjects
The GM concentrations of Pb and Cd in the control group were significantly higher than those in the exposure group (Blood Pb; 1.55 vs. 1.68 μg/dL, blood Cd; 0.97 vs. 1.21 μg/L). The GM concentration of blood Hg did not differ significantly between the two groups. In the case of urinary total As, the GM in the exposed group was significantly lower than in the control group (69.19 vs. 89.63 μg/L). In contrast, the GM concentration of urinary Cd was found to be significantly higher in the exposure group than in the control group (2.66 vs. 2.25 μg/L), but the creatinine-adjusted GM was not statistically significant. Overall, the GM concentrations of the four PAH metabolites were higher in the exposure group than in the control group. In particular, the GM concentration of the 2-naphthol and sum of the PAH metabolites showed a statistically significant difference. The sum of the weighted average concentrations of 17 serum PCDD/Fs was 3.13 in the exposure group and 2.74 pg WHO-TEQ/g lipid in the control group, slightly higher in the exposed group; however, the differences were not statistically significant. The GM concentration of 8-OHdG in urine, a marker of oxidative stress, was found to be significantly higher in the exposure group than in the control group (Table 3).
Table 3
Concentrations of biomarkers for heavy metals, PAHs, dioxins, and oxidative stress in the study population
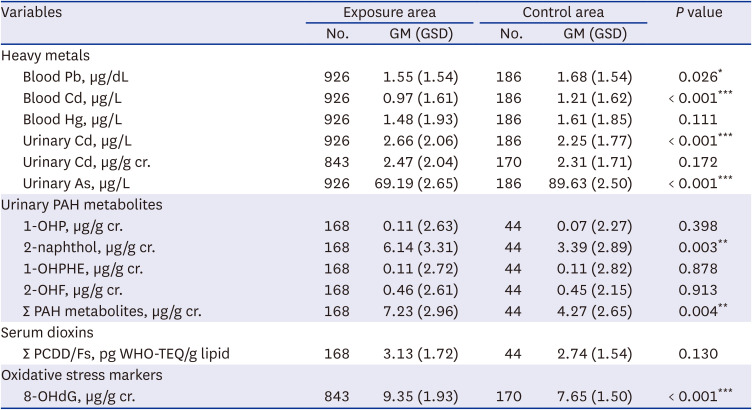
PAHs = polycyclic aromatic hydrocarbons, GM = geometric mean, GSD = geometric standard deviation, Pb = lead, Cd = cadmium, Hg = mercury, As = arsenic, OHP = hydroxypyrene, OHPHE = hydroxyphenanthrene, OHF = hydroxyfluorene, WHO-TEQ = WHO toxic equivalents, 8-OHdG = 8-hydroxydeoxyguanosine.
*P < 0.05, **P < 0.01, ***P < 0.001.
Prevalence of symptoms
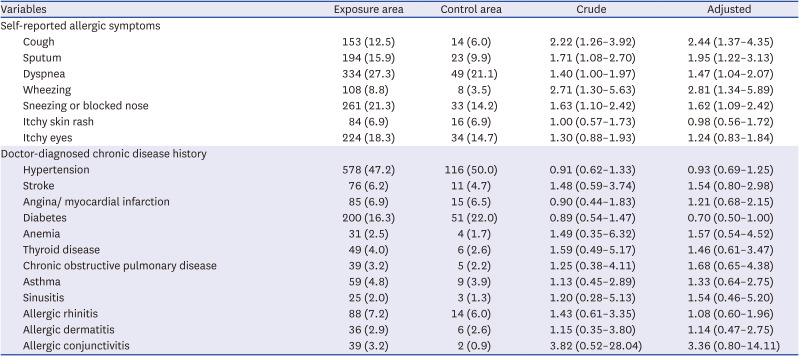
A comparison of the prevalence of self-reported symptoms after adjusting for confounding variables, including gender and age revealed that cough and sputum, dyspnea, wheezing, and eye-itch were significantly higher in the exposure group than in the control group. In particular, the prevalence of wheezing and cough in the exposure group was 2.81 and 2.44 times higher, respectively, than that in the control group. However, no significant differences were observed in the prevalence of acute and chronic diseases diagnosed by doctors after visiting the hospital between the two groups (Table 4).
Table 4
Comparison of self-reported symptoms and doctor-diagnosed chronic disease prevalence
Abnormalities in health checkup items
Among the physical examination items, the proportion of blood pressure abnormalities was 41.8% in the exposure group and 58.6% in the control group, which was significantly higher in the control group (odds ratio [OR] = 0.49). Among the laboratory test items, the ratio of blood urea nitrogen (BUN) abnormalities was 3.49 times higher than that of the control group, and the ratio of ALT abnormality, a marker of liver function abnormality, was significantly lower in the exposure group than in the control group (OR = 0.57). No other test items showed significant differences between the two groups. The proportion of people with a high depression index was 2.64 times higher in the exposure group than in the control group among the MMSE test. The proportion of individuals with cognitive impairment was 1.35 times higher in the exposure group than in the control group, but the difference was not statistically significant (Table 5).
Table 5
Physical examination, laboratory tests, and psychological tests in the study population

Values are presented as number (%) of odds ratio (95% confidence interval).
BMI = body mass index, SBP = systolic blood pressure, DBP = diastolic blood pressure, M = male, F = female, AST = aspartate transaminase, ALT = alanine transaminase, GTP = gamma glutamyl transferase, HDL = high-density lipoprotein, FBS = Fasting blood glucose, T4 = thyroxine, TSH = thyroid stimulating hormone, CRP = C-reactive protein, PHQ-9 = Patient Health Questionnaire-9, KDSQ-C = Korean Dementia Screening Questionnaire-Cognition.
Adjusted for age = sex = smoking = alcohol consumption = education level = and physical activity.
Multiple regression models
The determinants of urinary Cd, 2-naphthol, and the sum of PAH metabolites and 8-OHdG levels were examined by means of multiple linear regression analyses. In the model, age, gender, educational level, smoking and drinking status, physical activity, urinary creatinine levels, and group were independent factors. Age, gender, educational level, and group were significant factors for urinary Cd levels. In the models for urinary 2-naphthol and sum of PAH metabolites, age, gender, smoking status, and group were statistically significant factors. For urinary 8-OHdG, age, gender, and group were significant factors (Table 6).
Table 6
Multiple regression models for urinary cadmium, 2-naphthol, and sum of PAHs and 8-OHdG
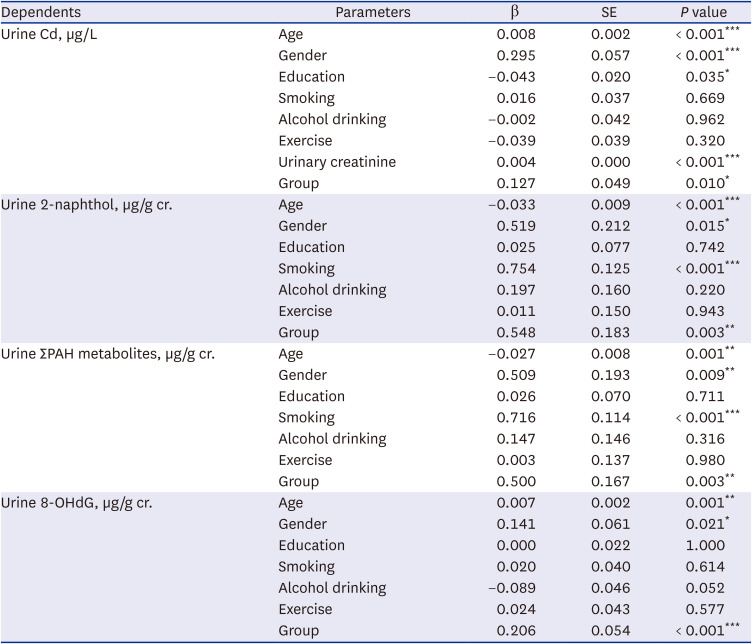
All categorical variables are referenced to 0. Age (years); gender (men: 0, women: 1); education (no school: 0, elementary school: 1, middle school: 2, high school: 3, college: 4, university: 5, graduate school: 6); smoking(non-smoker: 0, smoker: 1); alcohol drinking (non-drinker: 0, drinker: 1); exercise (no: 0, yes: 1); group (control: 0, exposed: 1).
PAHs = polycyclic aromatic hydrocarbons, 8-OHdG = 8-hydroxydeoxyguanosine, SE = standard error, Cd = cadmium.
*P < 0.05, **P < 0.01, ***P < 0.001.
DISCUSSION
This study was aimed to evaluate the impact of pollutants emitted from WI facilities in Bugi-myeon, Cheongju, and Chungcheongbuk-do, Korea, on the local environment and on the health of residents. Particularly, this study aimed to answer the following questions: 1) “What are the pollutant levels in the environment around the incinerator in Bugi-myeon?”; 2) Are the residents living near WI facilities exposed to hazardous air pollutants?; and 3) Did exposure to hazardous substances cause adverse health effects in residents living near incinerators?
Regarding the first question (“What are the pollutant levels in the environment around the incinerator in Bugi-myeon?”), the environment PCDD/Fs and PAHs concentration around WI facilities were significantly higher than those in the control area. Especially, the average concentration of PCDD/Fs around the incineration facilities was 0.025 pg I-TEQ/Sm3, lower than the annual average environmental standard of 0.60 pg I-TEQ/Sm3, which is ~ 4 times higher than the annual average of 0.006 pg I-TEQ/Sm3 from the Persistent Organic Pollutant Monitoring Network (Ministry of Environment, Korea) measured in 2018.17 However, the concentration of heavy metals in the air did not show a significant difference from the control area. Furthermore, the concentrations of heavy metals, PCDD/Fs, and PAH in the soil did not exceed the reference value or show higher levels than the control area. Cd concentration in agricultural products (red pepper) was also two times higher than those in the control area (data not shown). The possibility that the results of this study may have been underestimated because of voluntary reduction efforts by incinerators during the survey period cannot be ruled out. An incineration plant in Bugi-myeon began operations in 1999.3 Especially, some incinerators have received administrative measures in the past because of excessive incineration or exceeding the hazardous substances emission standards. In addition, there are currently not enough facilities to prevent harmful substances from entering these incinerators. Moreover, hazardous substances management standards have become stricter than in the past.17 All together, these data imply that hazardous substance exposure concentrations in the vicinity of the incinerator were higher as they are now. This study, however, had a limitation, in that it was unable to assess cumulative exposure from the past.
Regarding the second question (“Are residents living near WI facilities exposed to hazardous air pollutants?”), the biomonitoring revealed that residents of Bugi-myeon area exhibited significantly higher urinary PAHs metabolites and Cd concentrations than those in the control area. Considering that the half-life of PAHs metabolites in the human body is relatively short,18 PAH exposure is currently assumed to be increasing. This finding is also supported by the increased environmental PAHs levels around the Bugi-myeon area.
Urinary Cd concentration was significantly higher in Bugi-myeon residents than in the control group, whereas blood Cd was found to be significantly higher in the control group. Given that blood Cd reflects recent Cd exposure and urinary Cd concentrations reflect past cumulative exposure,19 these findings imply that residents in the Bugi-myeon area had higher Cd exposure in the past than they did when the study was conducted. This is also supported by the similar environmental Cd concentrations in the exposed and the control areas.
The GM concentration of blood PCDD/Fs was slightly higher in the exposure group than in the control group, but the difference was not statistically significant. However, the frequency of individuals with high blood PCDD/F levels (> 4.18 pg TEQ/g lipid, a value corresponding to 95 percentile of the control group) in the exposed group was 5.47 (95% confidence interval: 1.23–24.44, data not shown) times higher than that in the control group. This fact suggests the possibility that residents of Bugi-myeon were exposed to relatively high TCDD/Fs concentrations.
Finally, regarding the third question, (“Did exposure to hazardous substances cause adverse health effects for residents living near incinerators?”), harmful substances such as dioxins, PAHs, and heavy metals, which are the main emissions from WI facilities, can cause oxidative genetic damage, which is closely related to the mechanism of occurrence of various diseases, including cancer.202122 In this study, self-reported respiratory allergy symptoms, including cough, sputum, dyspnea, and wheezing were significantly higher in residents of Bugi-myeon than in residents of the control area, and the frequency of depression was also significantly higher in the exposure group than in the control group. Of note, a retrospective cohort study on residents in the Bugi-myeon area also reported that the cancer incidence in Bugi-myeon residents was relatively higher compared to residents in other areas.23 These facts suggest the possibility that oxidative stress may be increased in residents living near incinerators in Bugi-myeon due to exposure to harmful substances, possibly leading to some harmful health effects, including cancer.
This study is the first large-scale epidemiological study regarding residents living near WI facilities in Korea, which has recently become a national issue. Nevertheless, this study had some limitations. First, this was a cross-sectional study; therefore, detailed information on past exposures was not obtained. Although this is a major drawback in identifying a causal relationship, it is an unavoidable choice due to budget or time constraints. Second, it is difficult to affirm that the harmful substance concentrations on the body are derived from the incinerator, as the harmful substances emitted from the incinerator can also be generated from nearby factories or automobile exhaust gases. In addition, exposure to some harmful substances such as dioxins and heavy metals through food is possible; however, in this study, these were not adequately controlled. Nevertheless, we tried to minimize these confounding factors by selecting control areas with factories and similar lifestyles to those of the Bugi-myeon area.
Consequently, it is difficult to conclude that the poor health of the residents of Bugi-myeon is uniquely due to the presence of WI facilities nearby. However, there is insufficient evidence to affirm that there were no health consequences derived from the incinerator. It is clear that the current health state of Bugi-myeon residents is extremely poor compared to that of residents in other areas. Therefore, it seems necessary for local governments and the Ministry of Environment to conduct continuous monitoring and health promotion programs for residents separately from the identification of the cause. In addition, the construction of additional incinerators in Bugi-myeon should no longer be allowed to prevent further exposure of the residents to hazardous substances.
 XML Download