

 PDF
PDF Citation
 Print
Print


Living liver donors (LLDs) are carefully evaluated for transmissible diseases and other chronic medical morbidities that might influence the donor’s health and the viability of the donated liver graft.123 Thus, short-term outcomes following a donation in LLDs are generally excellent.3 Recently we reported that the mortality of LLDs is higher than in highly selected healthy control groups.2 LLDs are thoroughly evaluated before donation and are generally young and healthy, thus one may expect that cancer risk will not increase after donation, but this has not been studied at all. Our previous study showed that the incidence of malignancy in LLDs was significantly higher than in the healthy control group (incidence rate ratio [IRR] for malignancy among LLDs = 1.74 [range, 1.47–2.06]).2
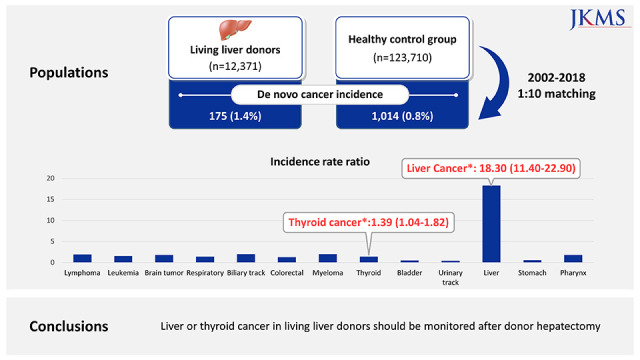
We investigated whether there was a difference in malignancy incidence according to the organ site between LLDs and matched healthy control groups from the general Korean population using data from the Korean National Health Insurance Services (NHIS).
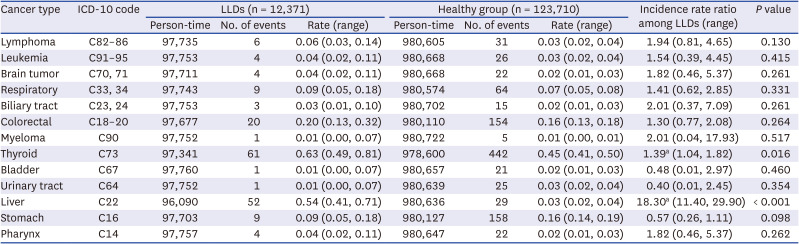
A total of 12,372 LLDs who donated a liver graft between 2002 and 2018 were registered in the Korean Network for Organ Sharing. They were compared to a matched healthy control group selected from the Korean NHIS. The matched healthy group consisted of sex- and age-matched individuals without abnormal aspartate transaminase or alanine transaminase (> 40 IU/L), > 3 positive in dipstick urine albumin excretion test, high systolic blood pressure (BP) (> 140 mmHg) or high diastolic BP (> 110 mmHg), and fasting blood glucose over 125 mg/dL. Malignancy was defined using C codes in International Classification of Diseases 10th Revision (C14–16, C18–20, C22–24, C32–34, C64, C67, C70, C71, C73, C82–86, C90–95). We excluded extremely rare cancers and sex-specific cancers (C40, C41, C43–49, C50–58, C60–63, C69–72, C76–80). Malignant disease was subdivided according to the site of cancer. If a living liver donor was diagnosed with multiple cancers after donor hepatectomy, only the first cancer was considered because nearly all LLDs had no prior history of cancer. Person-year defines the total sum of the number of years that each member of a study population has been under observation.
Death data were not affected by follow-up loss because the Korea National Statistical Office published death statistics annually from 2002 to 2019. Thus, the last date of follow-up was defined as December 31, 2019 for a person who did not die during the follow-up period.
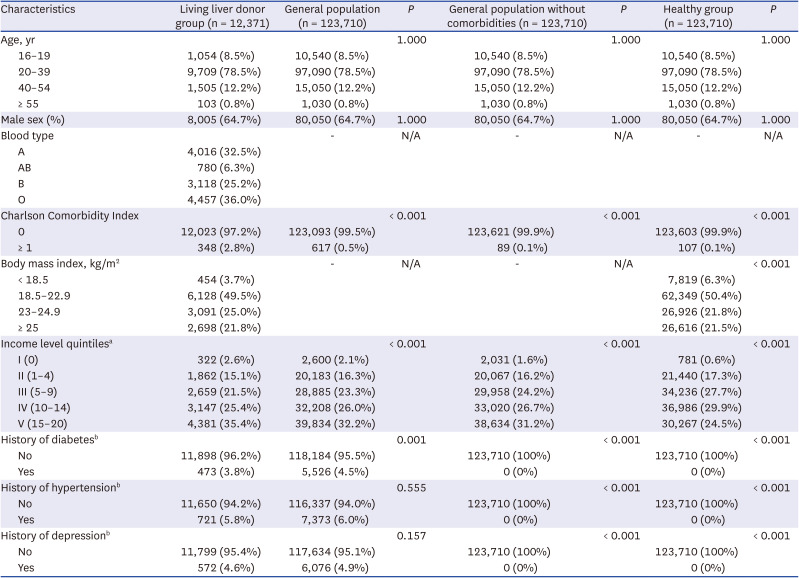
Baseline characteristics are summarized in a previous study.2 As shown in Table 1, cancer diagnosis was identified in 175 LLDs (1.4%) and 1,014 controls (0.8%). The incidence of liver cancer in the LLD group is much higher than in the healthy control group (IRR, 18.3; range, 11.4–29.9). In addition, the incidence of thyroid cancer in the LLD group was significantly higher than in the healthy control group (IRR, 1.39; range, 1.04–1.82) (Table 2). The incidence of 11 specified cancers was not different between the two groups.
Identification of health problems resulting from living liver donation provides information to potential liver donors and allows for planning of appropriate pre- and post-donation management. In our study, we identified cancer incidence in a large sample of LLDs. We observed a significant increase in the incidence of liver and thyroid cancer in the LLDs compared with the matched healthy control group. However, the incidence of other types of cancer in the LLDs was not different from the matched healthy control group.
The cancer risk for living kidney donors was generally reduced compared to the general population.4 Compared with the selective participants as a surrogate for ‘healthy’ controls, living kidney donors showed that the adjusted IRR of colorectal cancer and kidney cancer increased to 2–3 at 7 years after donation, but had a similar incidence of liver cancer, breast cancer, melanoma, and non-Hodgkin lymphoma.4
In our study, there is no biologic mechanism that clearly explains the reason for the increase in liver cancer and thyroid cancer after living liver donation. Non-causal explanations of the increased risk of liver cancer and/or thyroid cancer should be considered but seem less likely. First, liver cancer and/or thyroid cancer may be overdiagnosed due to frequent medical evaluation because screening ultrasonography is popular in Korea, which could be the lead time bias. Another possibility may be the possibility of a genetic liver disease that increases liver cancer and/or thyroid cancer between recipient and donor because 85.9% of all LLD is a blood-related family member of the recipient.5
Cancer screening approaches are usually based on absolute risk measures. Since most cancers in LLDs are lower than in healthy control groups, cancer screening may be unnecessary except for liver cancer and thyroid cancer after donation. However, the excess cancer incidence 7 years after living kidney donation is 6.2 and 23.4 per 100,000 person-years for kidney cancer and colorectal cancer, respectively. Thus, the cancer incidence of LLDs should be regularly monitored for detection of an abrupt increase of cancer after a long period.
If a potential recipient does not have an alternative donor, an individual risk-benefit assessment should be performed, especially in regions where deceased donor liver transplantation is not common. The potential harm to donors undergoing cancer screening tests and procedures, and the physical and psychosocial stress of undergoing cancer treatment after liver donation, need to be carefully balanced against the prognosis of recipients without living donor liver transplantation using a double-balance concept.6
LLD consultations on short-term and long-term risks are an important part of the assessment process, but we need to transform population-level data into personalized information as individuals. The presence of developing cancer should encourage targeted counseling, but should not deny donation opportunities. Although it is premature to recommend more frequent cancer screening or targeted screening for liver cancer and/or thyroid cancer, adherence to the National Cancer Screening Program should be strongly encouraged. Better long-term follow-up data on cancer risk, along with comprehensive historical links between registries and/or patient-reported outcome keys, are needed. Encouraging smoking cessation, weight loss, and exercise are essential to attenuate modifiable lifestyle factors for cancer. This series of events demonstrates why it is so important to understand the long-term clinical sequelae of living liver donation. The transplant community has an obligation to clearly identify the undue long-term risks associated with LLD and should always consider this a top priority.
Our study has several limitations. First, caution must be taken in interpreting the data. Cancer incidence rates can be skewed among LLD cohorts without an underlying pathophysiology due to reverse causation, detection bias, and/or confounding bias. Data also cannot be extrapolated directly to other countries. Second, the incidence rate of Hürthle cell carcinoma or thyroid cancer in Korea is among the highest globally. This shows differences in cancer epidemiology and/or cancer management between countries. National cohort studies with specific population levels are needed to validate these findings, but are currently lacking. Third, when LLDs are diagnosed with malignancy, we cannot get any information about their liver transplant recipient. Thus, we do not know the exact relationship of cancer transmission from LLD to the recipient such as hereditary disease, family history, and viral status. Future studies of LLD require appropriate controls for prospective enrollment and stratification of donors. Data on multiple outcomes, including cancer and cardiovascular disease, should be integrated.
In conclusion, there were elevated risks of liver and thyroid cancers after donor hepatectomy when LLDs were compared with a cohort of healthy matched individuals. It is reassuring to note that we did not observe an increased risk of cancer among LLDs except liver and thyroid cancer, compared with the matched healthy control group. Outpatient follow-up is difficult in most LLDs for more than 1 year after donor hepatectomy. The present study suggests that LLD after donor hepatectomy may require medical surveillance, especially for liver cancer.
 XML Download