

 PDF
PDF Citation
 Print
Print


INTRODUCTION
Lead has been a health hazard historically. In the early 20th century, deaths caused by acute encephalopathy were a major health effect of lead exposure.1 Wide use of the lead storage battery then led to high exposure of workers to lead in this industry.2 Use of leaded paint and leaded gasoline has also been widely adopted, resulting in a catastrophe for the general population as well as workers. Threats to the neurological development of children3 and the fertility of adults4 from occupational and environmental exposure to lead have been reported. In addition, exposure to lead has resulted in elevated risks of cardiovascular diseases.5 According to an estimate by the World Health Organization, lead exposure accounts for 30% of the global burden of idiopathic intellectual disability, 4.6% of the global burden of cardiovascular diseases, and 3% of the global burden of chronic kidney diseases.6
National and international efforts have been implemented for control of lead exposure; for example, leaded paint and leaded gasoline have been phased out of most countries.78 However, lead itself is an essential element in certain industries and products, thus, wide use of lead remains unavoidable. In 2016, Korea was the world’s third-ranked producer of refined lead, after China and the United States, accounting for approximately 8% of world production.9 Accordingly, monitoring of lead exposure has been adopted and reinforced.
In the current study, our goal was to examine the temporal trends in lead exposure in Korean lead workers. Measurements of airborne lead related to occupational exposure were collected from various data sources and data were combined for estimation of temporal trends. In this study, we report on the estimates of temporal trends in occupational exposure to lead across industries and in the storage battery manufacturing industry in Korea over 30 years.
METHODS
Data sources
Three data sources were used in the current study. In Korea, mandatory occupational exposure surveillance and occupational health surveillance systems are employed nationwide. For implementation of an occupational exposure surveillance system, annual workplace monitoring should be conducted in every workplace having an association with 192 designated hazards, which is person-based monitoring conducted by work environment monitoring institutions (WEMIs) designated by the Ministry of Employment and Labor (MOEL).10 Electronic compilation of the results of monitoring has been conducted by the Korea Occupational Safety and Health Agency (KOSHA) since 2002. The workplace measurement database is known as the work environment measurement database (WEMD).11 Airborne lead measurements were extracted from the WEMD and used as basic data for subsequent analyses.
Measurements from a WEMI (Severance Hospital Occupational Health Center, SOHC) were also used.12 An electronic database system (based on FoxPro™) for compiling results of workplace monitoring was adopted by the SOHC in 1994, one of the earlier cases where a database system was employed among WEMIs. Workplace monitoring data includes information about the company (i.e., industry code, number of workers, and main products) and measurements (sampling date, work process, sampling site, sampling time [start, to], time-weighted average, occupational exposure limit [OEL], and sampling and analytical methods). Data from the SOHC for the period between 1994 and 2001 were used for analysis, and measurements performed after 2001 were included in the WEMD.
In addition, summary measurements extracted from a paper reviewing articles relevant to occupational lead exposure in Korean workers were used for estimation of a temporal trend over an extended period before 1994 for the storage battery industry.13 The extracted data included both personal and area measurements across several industries, and personal measurements ranging from 1987–2006 in the storage battery industry were selected for subgroup analysis.
Evolution of the WEMD
The KOSHA has been electronically compiling data from workplace measurements sent from hundreds of WEMIs since 2002. Until the introduction of the Health and Environment Monitoring System (HEMS) in 2009, data from the KOSHA was managed using Microsoft Access™. Using the HEMS online data collection system, data sent from WEMI were compiled automatically in the system. However, the adoption of a new online system resulted in certain problems; thus, an advanced KOSHA to Business (K2B) system was introduced in 2012. Since then, the K2B system has been widely employed nationwide.
Because WEMIs used the same format designated by relevant regulations, there has been little change in the variables of the data format of the WEMD. However, some significant changes in WEMD have been indicated. First, a complete change in the codes for hazardous materials was implemented in 2005 (i.e., inorganic lead: 14001 to 22005). Second, changes in the standard industrial code were implemented in 2009 and 2017, respectively. Korea Standard Industrial Classification (KSIC)-8 based on the International Standard Industrial Classification (ISIC, based on ISIC Rev3.) was used before 2009. KSIC-9 (based on ISIC Rev4.) was used from 2009, and KSIC-10 (based on ISIC Rev4.) has been used since 2018. Some overlaps of industrial codes occurred between different versions during change periods. Third, a major change in the standard process code (SPC) occurred in 2009 (3-digit SPC to 4-digit SPC). In addition, in 2020, WEMIs were permitted to generate their own SPC, which resulted in a substantial increase in the number of SPCs.14
Data cleaning and treatment
During the early period after establishment of the WEMD, there was a greater focus on collection and accumulation of data rather than quality control. As a result, many outliers were discovered in earlier periods, particularly in 2006 and 2007. In our examination of the causes of the occurrence of outliers, we found that the outliers’ OELs (data-line of each measurement includes information on OEL) were substantially different from that of lead (0.05 mg/m3, working time adjusted OEL: 0.03-0.1 mg/m3). This error might originate from unknown data structural issues. Measurements with different OELs were removed in order to mitigate this type of error. However, some outliers remained. Therefore, we assumed that measurements showing more than ten times OEL of lead might be erroneous, thus they were removed from subsequent analyses. However, in 2007, the OELs of all measurements were coded as 0.05 mg/m3, indicating ad hoc correction of OEL, irrespective of the presence of outliers. The problem was not completely resolved by removal of measurements more than ten times OEL; therefore, all 35,491 measurements recorded in 2007 were removed from data analyses. In addition, measurements with industrial code errors and no information about the number of workers in the company were also excluded from analyses, which was a trivial number.
KSIC-10 code was assigned to lead measurements in the WEMD throughout the study periods; measurements coded with KSIC-8 and KSIC-9 in the WEMD were aligned with the KSIC-10 code. The SOHC data were coded according to the KSIC-8 code, and aligned with the KSIC-10 code. The standard industrial classification (SIC) code for data extracted from the review paper13 was also aligned with the KSIC-10.
Data regarding sampling time (from, to) were not included for the period between 2002 and 2004 in the WEMD; this information became complete without omission in 2013 with implementation of strict quality control through the K2B system. Personal workplace monitoring should be conducted for 6 hours or longer in Korea.15 However, for some reason, short or long-term sampling has been conducted. The number of measurements sampled for less than 4 hours or more than 10 hours accounted for only 0.63% in 2015. Therefore, sampling time was not considered in the process of data cleaning.
A large proportion of lead measurements in the WEMD were coded as ‘0,’ indicating that lead was not-detected (ND). The limit of detection (LOD) might differ according to institution and performance of monitoring. The WEMD does not include information about the LOD. Therefore, a single LOD of 1.8 µg/m3 was assigned to measurements less than the LOD or ND.16
Statistical analysis
Summary statistics including arithmetic mean, standard deviation (SD), geometric mean (GM), geometric standard deviation (GSD), 1st quartile, median, 3rd quartile, and 95th percentile were computed by year. To that end, measurements below the LOD of 1.8 µg/m3 were assigned half of the LOD (simple replacement method).17 Measurements less than LOD accounted for 78.5% (348,554/444,296) of the data. In addition, the maximum likelihood estimation (MLE) method using the ‘EnvStats’ package18 of the statistical software R (R Foundation, Vienna, Austria) was also used for estimation of summary statistics. Using the MLE method, analyses were restricted to industries with at least two non-missing, non-censored, distinct levels.
For evaluation of temporal trends in occupational exposure to lead, multiple imputation technique1920 was used for measurements less than LOD. Lead measurements were log-transformed and imputation was then performed for retrieval of five complete datasets. A mixed-effects regression model integrating log-transformed lead measurements as the dependent variable and treating year as an independent fixed effect and 3-digit industry as a random effect was then developed. The mixed-effects model was chosen over the fixed-effects model because, in a fixed-effects model, substantial weights tend to be assigned to industries with a large number of measurements, while small industries would essentially be ignored.21 By application of a mixed-effects model, we attempted to mitigate the imbalanced distribution of the number of measurements across industries. The model was fitted for five complete datasets respectively using the restricted maximum likelihood method. Analyses were performed using the ‘lme4’ package22 of the statistical software R. Computation of pooled estimates of regression parameters across results from five datasets was performed using the ‘mitml’ package.23
For subgroup analysis of the storage battery industry, measurements with 5-digit SIC code ‘28202 (manufacture of accumulators)’ were selected from the WEMD. Summary statistics extracted from the review paper were also used.13 Monte Carlo simulation was performed five times using the distribution parameters of GM and GSD extracted from the review paper, which integrated into five complete datasets generated from the WEMD using multiple imputation technique.19 A linear regression model was developed with integration of log-transformed lead measurements as a dependent variable and year was treated as an independent variable. To obtain stable estimates of regression coefficients, the model was fitted for five complete datasets, and pooled estimates were then computed across five results.24
RESULTS
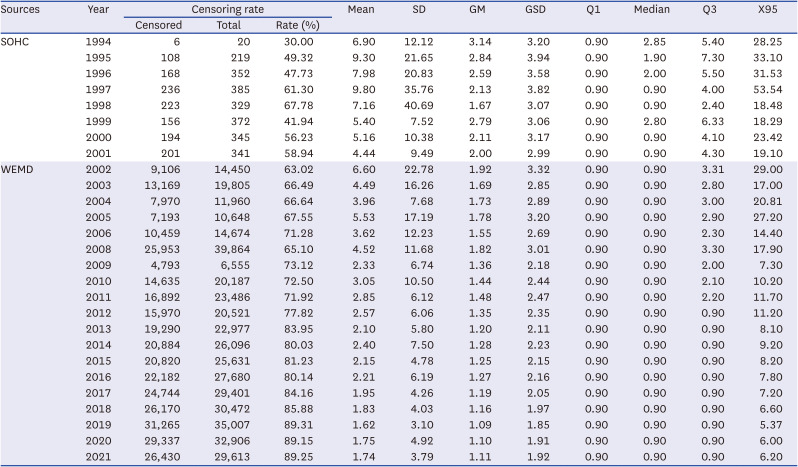
A total of 444,296 airborne lead measurements including 441,933 measurements from the WEMD and 2,363 measurements from the SOHC were collected. The total numbers of measurements, summary statistics by data source, and monitoring year across industries are shown in Table 1. Summary exposure levels decreased between 1994 and 2021 with a decline of approximately 3-fold; in 1994, GM was 3.14 µg/m3, however, GM was 1.11 µg/m3 in 2021.
Table 1
Summary statistics of airborne lead measurements by data source and year in all industries (unit: µg/m3)
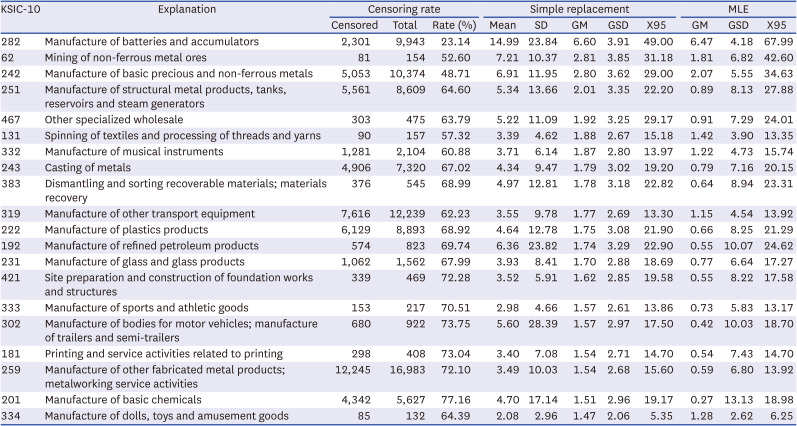
The top 20 industries with high levels of lead exposure based on GM (n > 100) are shown in Table 2. The highest level of exposure was observed for the ‘manufacture of batteries and accumulators (SIC: 282)’ industry based on GM (6.6 µg/m3). The number of measurements according to year and industry and summary statistics for exposure levels according to industry are shown in Supplementary Tables 1 and 2, respectively.
Table 2
Top 20 industries with high lead exposure based on GM (number of measurements > 100) (unit: µg/m3)
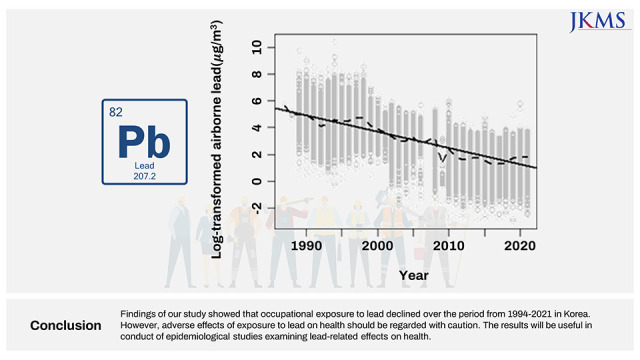
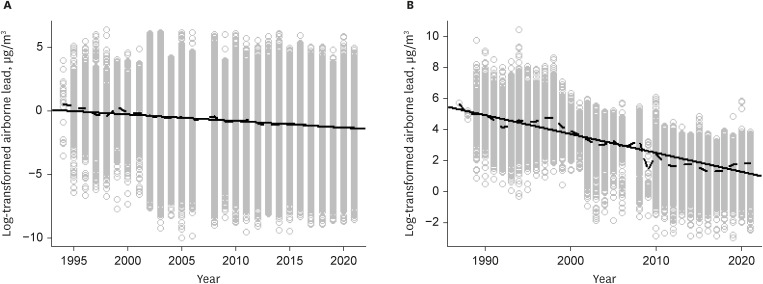
Assessment of the declining trend was performed using the results of the mixed-effects regression model across industries, resulting in an annual decrease of −5.83% ((exp(−0.06) − 1) × 100) (95% confidence interval [CI], −5.93, −5.73) between 1994 and 2021 (Table 3). Intra-class correlation, the proportion of variance accounted for by the industry (0.1896) to the total variance (3.8092), was 0.05. The declining trends are also graphically represented by both the linear regression line and the smoothing spline25 line shown in Fig. 1.
Table 3
Pooled regression parameters for all industries and the storage battery industry
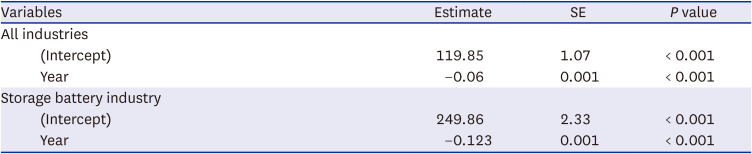
| Variables | Estimate | SE | P value | |
|---|---|---|---|---|
| All industries | ||||
| (Intercept) | 119.85 | 1.07 | < 0.001 | |
| Year | −0.06 | 0.001 | < 0.001 | |
| Storage battery industry | ||||
| (Intercept) | 249.86 | 2.33 | < 0.001 | |
| Year | −0.123 | 0.001 | < 0.001 | |
Fig. 1
Graphs of temporal trends in occupational exposure to lead. The solid line represents the linear regression line and the dashed line represents the smoothing spline. (A) All industries. (B) Storage battery industry.
For the storage battery industry, a total of 15,712 airborne lead measurements including 9,634 measurements from the WEMD and 6,078 measurements from the review paper13 were collected. The numbers of measurements and summary statistics by data source and year in the storage battery industry are shown in Table 4. Measurements extracted from the review paper were derived from three original articles. Summary measurements were derived from literature covering the period from 1987–2006 and the WEMD covering the period from 2002–2021 with no measurement from the SOHC data for the period between 1994–2001.
Summary exposure levels declined by approximately 45-fold between 1987 and 2021; GM was 291 µg/m3 in 1987, however, the level showed a decline to GM of 6.34 µg/m3 in 2021. The levels of exposure have shown a decline of −11.57% ((exp(−0.123) − 1) × 100) per year (95% CI, −11.78, −11.38) over time. The declining trends in the storage battery industry are also shown graphically by both the linear regression line and the smoothing spline25 line shown in Fig. 1.
Table 4
Summary statistics from airborne lead measurements by data source and year in the storage battery industry (unit: µg/m3)

WEMD = work environment measurement database, GM = geometric mean, GSD = geometric standard deviation, NA = not attributable.
aStudy ID: Reference numbers given in Supplementary Table 1 of Choi et al. (2022)13
DISCUSSION
Lead exposure, similar to asbestos, represents a noteworthy public health concern within the domains of occupational and environmental fields. Lead poisoning is characterized by a range of symptoms, including abdominal pain, fatigue, and muscle and joint pain. Exposure to lead has been linked to hypertension and renal damage. Studies indicate that when blood lead levels surpass 50 µg/dL, distinct functional and pathological alterations, such as proteinuria, can occur. Neurological toxicity manifests in mild changes like fatigue and lethargy, as well as predominantly motor symptoms like wrist drop.26 Lead exposure has been found to potentially impact male fertility, with sperm abnormalities observed when blood lead levels exceed 40 µg/dL.26 Furthermore, the endocrine system may also be affected, leading to decreased levels of serum thyroxine and impaired release of thyroid-binding hormone when blood lead levels reach 30-40 µg/dL.26
The significant concern regarding IQ loss and behavioral impairment in children due to lead exposure prompted the US Centers for Disease Control and Prevention to lower the reference level from 10 µg/dL to 5 µg/dL in 2012.27 In the United States, the general population exhibited blood lead levels as high as 17 µg/dL in 1976. However, with the removal of leaded gasoline and leaded paint, blood lead levels steadily declined, reaching 4 µg/dL in the early 1990s and further dropping to 2 µg/dL in the early 2000s.27 Nonetheless, it is important to highlight that the World Health Organization emphasizes that no level of blood lead is considered safe for children.28
Lead toxicity can manifest through two primary mechanisms.26 First, lead exhibits a strong affinity for sulfhydryl (-SH) groups, leading to the inhibition of enzymes that rely on these groups. For instance, lead can inhibit delta-aminolevulinic acid dehydratase and ferrochelatase, resulting in anemia due to the inhibition of heme synthesis. Second, lead metabolism shares similarities with that of calcium, enabling it to competitively inhibit the action of calcium at critical sites such as synapses.
In the early 20th century, detection of lead poisoning by doctors was based only on signs and symptoms of intoxication.29 However, as a result of advancements in measurement technology, standardized and precise monitoring of lead exposure has been implemented in workplaces where high exposure to lead had previously occurred. In addition, with the introduction of various control measures for protection of workers′ health, exposure levels have shown a general decline over time.21 In the current study, temporal trends in occupational exposure to lead were estimated using multiple sources of data on Korean workers.
Levels of lead exposure in Korean lead workers have declined over time by approximately −6% per year, consistent with previous studies.3031 A study conducted in the US reported a 5–10 fold decline in occupational exposure to lead according to inspection data from the Occupational Safety and Health Administration (OSHA) for the period between 1984 and 1997.30 The proportion below LOD or non-detected was 78.45% in WEMD data recorded from 2002–2021, greater than that of 41% from US OSHA inspection data recorded from 1984–1997.30 In China, inspection data from Shanghai Center for Disease Control and Prevention showed a 20–50 fold decrease during the period from 1965–2000 (approximately 7–9% per year).31 The declining trends observed for Korean lead workers are supported by a decline in blood lead levels between 2003 and 2011 using the nationwide special health examination database (SHED).32
Declining trends differ by industry. A study using published literature to examine temporal trends in lead exposure in US workplaces reported declines of 2–24% across different industries.21 This difference was evaluated in the storage battery industry in Korea, which showed a decline of approximately −12% per year compared to a decline of −6% in all industries. Examination of temporal trends for each industry respectively might be feasible; however, the effort could be hampered by industries with a small number of measurements. Use of mixed-effects models can be considered as an alternative approach, borrowing strength from a general trend toward those of small industries.33 In mixed-effects models, the random slope may account for the variability of temporal trends according to industry; however, because this random slope and random intercept model did not converge, only the random intercept model was employed.
In Korea, the OEL for exposure to airborne lead was decreased in 1990 from 150 µg/m3 to 50 µg/m3, which has not changed since then.3435 Permissible limits (PLs), the maximum allowable value of workers’ levels of exposure, were established for 13 chemicals including lead in 2009 by MOEL. The value for PL of lead was the same as 50 µg/m3 of OEL.36 Therefore, the OEL of airborne lead might not have an effect on the declining trends between 1994–2021. However, the biological exposure index for blood lead in Korean workers decreased from 40 µg/dL to 30 µg/dL in 2009 (the diagnostic criterion for lead intoxication was also decreased from 60 µg/dL to 40 µg/dL), which could have a significant effect on the declining trend.32 The decreasing trends of lead levels in blood in Korean lead workers were confirmed in a previous study using nationwide SHED.32
The declining trends might also have an association with various factors. First, regulatory efforts by the government and the KOSHA have had a significant influence on the reduction in levels of lead exposure. Second, the ban on use of lead in electronic products in international trades in the mid-2000s facilitated the phase out of lead use in electronics industries.37 Lead has been used in the majority of solders for printed circuit boards in electronic products. However, according to the Directive 2002/95/EC of the European Parliament and of the Council on the restriction of the use of certain hazardous substances in electrical and electronic equipment (RoHS Directive), the use of six types of materials, including lead, in electrical and electronic products has been banned by the European Union since 1 July 2006.38 The Act for Resource Recycling of Electrical/Electronic Products and Automobiles, commonly referred to as Korea RoHS, was enacted by the Korean Government on December 12, 2006.39 Since 2008, the law has required that electrical and electronic products contain less than 1,000 ppm of lead. This regulation would have influenced the reduction of lead exposure levels for workers in the electrical and electronics industry. Third, small-scale industries where a high level of exposure to lead might be a frequent occurrence have relocated to other countries, which resulted in a reduction of mean exposure levels. According to one study, despite the apparent decline in the burden of disease attributable to lead exposure in recent years, it remains a leading public health concern, particularly in regions with a low socio-demographic index such as North Africa and the Middle East region.40 Fourth, with the increased awareness of lead, monitoring of lead in air has been conducted for jobs or workplaces where measurements were not previously performed due to low-level exposure, which has resulted in a reduction of mean exposure levels.
Although the level of occupational exposure to lead tended to decrease, cases of occupational lead poisoning in Korea have still been reported since 2000. Cases of lead poisoning of workers who dissolve lead-coated scrap metal in the workplace were reported.41 In addition, lead smelting and regeneration companies were reported as major industries associated with lead exposure, which can potentially affect the health of residents living near the workplaces.42
To employ WEMD as a surveillance tool for lead poisoning, it is crucial to include lead measurement not only in traditional lead exposure workplaces (such as storage battery manufacturing) but also in diverse occupational settings, including scrap metal recycling.
The SOHC data used in this study did not include high exposure industries such as storage battery factories, which may have led to an underestimation of overall exposure levels between the periods of 1994-2001. However, it is important to note that the SOHC dataset covered a diverse range of industries, and this limitation was partially mitigated by employing a mixed-effects model. Despite this inherent limitation, the SOHC dataset remains a valuable source of information regarding occupational exposure during the 1990s.
Study ID #13, as shown in Table 4, consisted of annual monitoring data from 12 workplaces, which overlapped with the WEMD for the period between 2002 and 2006. Comparing the results of Study ID #13 with the WEMD, it was evident that the maximum values in Study ID #13 were consistently higher than those recorded in the WEMD, except for the year 2003 when both reported a maximum value of 143 µg/m3. The results of Study ID #13 were expected to be included in the WEMD; however, it is suspected that some results were omitted. This suspicion arises from the possibility that data from certain workplaces were not submitted to the KOSHA during the early stages of nationwide workplace monitoring data collection. Alternatively, it is also plausible that certain high measurements were intentionally excluded for unknown reasons. The exact cause for these discrepant results is unknown, but it raises the possibility of underestimation of results within the WEMD.
The utilization of the simple replacement method, particularly when more than 50% of the data falls below the LOD, can lead to biased or imprecise estimates of GM and GSD.17 Hence, in such scenarios, it is advisable to include the reporting of the censoring rate and range of measured samples, as suggested by Hornung & Reed.17 However, if there exists a compelling reason to report a mean concentration level, the use of the simple replacement method (LOD/2) is recommended.17 In our study, we have adhered to this recommendation by providing the censoring rate and X95, and additionally, we employed the MLE method to estimate summary statistics.
This study has several limitations. First, measurement of airborne lead has been conducted in compliance with relevant regulations. Because companies wish to avoid violation of OEL, measured levels tend to be lower than those of ordinary work conditions. Second, summary measurements from the literature originated only from lead-acid storage battery factories, while measurements from the WEMD were collected from broader workplaces coded as ‘SIC: 28202 (manufacture of accumulators),’ which might influence the declining trends. Third, because workplace monitoring is conducted twice a year, capturing variability among various work conditions is not possible. Fourth, the effort to categorize or rank exposure levels by industry is hindered by a high proportion of measurements below LOD. The weakness of the WEMD due to the characteristics of compliance measurements was described in detail elsewhere.16
In summary, temporal trends in occupational exposure to lead in Korean lead workers were examined using a nationwide database for workplace monitoring. Declining trends in occupational exposure to lead were observed for Korean workers across industries during the period from 1994–2021. These findings may be helpful in the effort to protect workers from exposure to lead. They may also be helpful in conduct of epidemiological studies to examine the adverse effects of occupational exposure to lead.
Despite the declining levels of lead exposure, incidents of lead poisoning still persist in workplaces. Therefore, it is crucial to maintain a constant and vigilant focus on the issue of lead poisoning. Ongoing attention and implementation of preventive measures are essential to ensure the protection of workers who are exposed to lead, particularly in light of the decreasing overall exposure levels.
 XML Download