

 PDF
PDF Citation
 Print
Print


INTRODUCTION
The liver is responsible for the synthesis of critical proteins, control of various metabolic processes, and detoxification of drugs and substances harmful to the body. The liver also plays a role in the production of bile acids that help in digestion and has immune cells that remove bacteria and foreign substances.12 Serum enzymes, such as alanine and aspartate aminotransferase (ALT and AST), alkaline phosphatase, gamma-glutamyl transferase, lactate dehydrogenase, bilirubin, albumin, and total proteins, are commonly used in liver function tests.23 Both aminotransferases are highly expressed in the liver. Liver injury results in an increase in the serum concentrations of aminotransferases. Hepatic steatosis and liver fibrosis (FIB) are common pathophysiological processes associated with liver injury. They are often used as indicators of liver damage. For example, liver steatosis is the primary diagnostic criterion for nonalcoholic fatty liver disease (NAFLD).4 Liver FIB is a precursor to liver cirrhosis.5 Therefore, it is worthwhile to identify possible risk factors related to hepatic steatosis and liver FIB that will let us detect liver damage earlier and provide appropriate interventions for prevention and treatment.
Serum uric acid (SUA) is the major end-product of purine metabolism. SUA levels are controlled by the regulation of their production, reabsorption, and secretion by the kidneys and intestines.6 Increased production and decreased excretion of uric acid from the body leads to hyperuricemia.7 Although uric acid is known to act as an extracellular antioxidant,8 it enters cells and may be harmful to the human body. In recent decades, the prevalence of hyperuricemia has increased globally.9 In addition, the prevalence of hyperuricemia is high among male Korean workers.10 Hyperuricemia is a cause of gout and urolithiasis.1112 Previous studies have implicated hyperuricemia in the development of metabolic syndrome,1314 cardiovascular disease,15161718 diabetes mellitus (DM),19 and inflammation.2021 Moreover, not only hyperuricemia but also SUA levels within the normal range were positively associated with metabolic syndrome.18 Hyperuricemia has been found to be associated with NAFLD.2223242526 However, the association between SUA levels and liver damage remains unclear.
There are some reports on the association between SUA and liver enzymes.2425272829 Studies have also been conducted to elucidate the relationship between SUA and liver steatosis and FIB.3031 However, limitations exist in previous studies, such as having a small study population,28 selection bias due to voluntarily participation in health screening programs24 and a lack of consideration of other potential confounding factors on SUA concentration.2527
Despite the high number of individuals experiencing hyperuricemia, an unsolved question regarding the association between SUA and liver damage among the general adult population remains. When a significant association between SUA and liver damage is demonstrated with clinical tests of SUA levels, early diagnosis and intervention of liver damage can be expected. Whether elevated SUA levels contribute to increased liver damage in the general population warrants further investigation. Therefore, the present study aimed to determine whether SUA levels were associated with liver damage.
METHODS
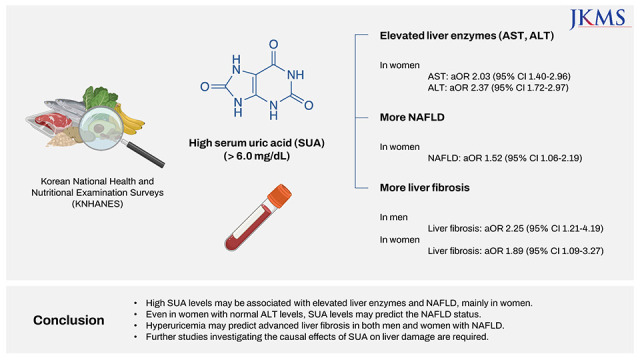
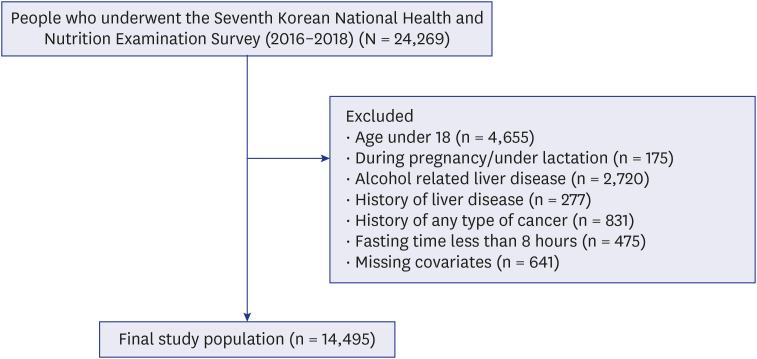
We used data from the seventh (VII) Korean National Health and Nutrition Examination Survey (KNHANES) conducted in 2016, 2017 and 2018. The KNHANES is a nationwide cross-sectional survey database conducted by the Korea Center for Disease Control and Prevention to assess the health and nutritional status of Koreans,32 based on a complex, stratified, and multistage sample that makes the data nationally representative of Koreans. The survey included data on several health examinations, including height, body weight, blood pressure, and laboratory tests of blood. The initial participants of our study were those who participated in NHANES VII (n = 24,269). Among these, those aged < 18 years (n = 4,655), who were pregnant or lactating (n = 175), or with a history of heavy alcohol consumption (n = 2,720) were excluded. Heavy alcohol consumption was defined as alcohol consumption > 30 g/day (men) or 20 g/day (women) in the last 12 months. Patients with a history of liver disease (n = 277), such as liver cirrhosis, chronic hepatitis B, chronic hepatitis C, and liver cancer, or any type of cancer (n = 831) were excluded. Men and women who reported fasting times of less than 8 hours (n = 475) were excluded. Finally, those with missing SUA levels, liver function enzymes, and covariates were excluded (n = 641). Our final study population included 14,495 individuals (6,007 men and 8,488 women) for the analyses (Fig. 1).
Assessment of biochemical data
During KNHANES, the participants’ blood samples, used for analyses, were obtained after fasting overnight. Biochemical data, including SUA, AST, ALT, fasting glucose, high-density lipoprotein cholesterol (HDL-C), total cholesterol (TG) and platelet count were measured using a colorimetric enzymatic method on a Hitachi 7600-210 automatic biochemical analyzer (Hitachi, Tokyo, Japan). Hyperuricemia was defined as an SUA level ≥ 7.0 mg/dL for men and ≥ 6.0 mg/dL for women.33 SUA levels were categorized into four groups.26 In the male group, the groups were divided by SUA levels of ≤ 5.3, 5.3–6.0, 6.0–7.0, and > 7.0 mg/dL. Women were divided into groups of ≤ 4.0, 4.0–4.8, 4.8–6.0, and > 6.0 mg/dL of SUA levels. AST and ALT levels were used to evaluate the liver function status. These were categorized into two groups, normal and elevated, for each sex. The elevated group was defined as > 35 (men) and > 31 (women) IU/L for AST and > 45 (men) and > 34 (women) IU/L for ALT.28
The fasting glucose levels were divided into three groups (< 100, 100–125, > 125 mg/dL). Participants who self-reported taking medications for DM were included in the > 125 mg/dL group. Blood pressure levels were categorized into two groups: normal and high. The high group was defined as individuals with a systolic blood pressure ≥ 130 mmHg and diastolic blood pressure ≥ 85 mmHg, or participants who self-reported taking medication for hypertension. Lipid profile markers were categorized into two groups, normal and abnormal, in each sex respectively. The abnormal group was defined as having met at least one of the following criteria: 1) HDL-C < 40 mg/dL (men) or < 50 mg/dL (women), 2) TG ≥ 150 mg/dL, and 3) taking medication for dyslipidemia.
Assessment of other covariates
Sociodemographic variables were investigated using self-reported questionnaires. Alcohol consumption status was categorized into two groups: never and light. Smoking habits were categorized into three groups (never, ex-, and current). Body mass index (BMI) was assessed and categorized into two groups (< 25 and ≥ 25 kg/m2).
Assessment of NAFLD and liver FIB
NAFLD was defined using the hepatic steatosis index (HSI) in this study; an HSI > 36 was classified as the NAFLD group.34 The HSI is a simple, efficient, noninvasive, and validated screening tool for NAFLD.34 We excluded participants with a history of heavy alcohol consumption and liver disease to allow the HSI to precisely reflect NAFLD. HSI was calculated as follows: 8 × ALT/AST + BMI + 2 (if women) + 2 (if diabetes).
Statistical analysis
One-way analysis of variance for continuous data and χ2 test for categorical data were performed to analyze the differences in characteristics between SUA level groups. Odds ratios (ORs) adjusted for age, alcohol consumption, smoking habit, BMI, fasting glucose, blood pressure, and lipid profile markers were used to analyze the association between SUA levels and liver damage in men and women. Multivariate logistic regression models were used to estimate adjusted odds ratios (aORs) and 95% confidence intervals (95% CIs). To evaluate liver damage, we analyzed liver enzymes (AST and ALT), NAFLD, and liver FIB based on SUA levels.
All statistical analyses were performed using STATA version 17.0 (STATA Corp., College Station, TX, USA). All analyses were conducted using complex sampling weights following the analysis guidelines of the KNHANES.32 Statistical significance was defined as P value < 0.05.
RESULTS
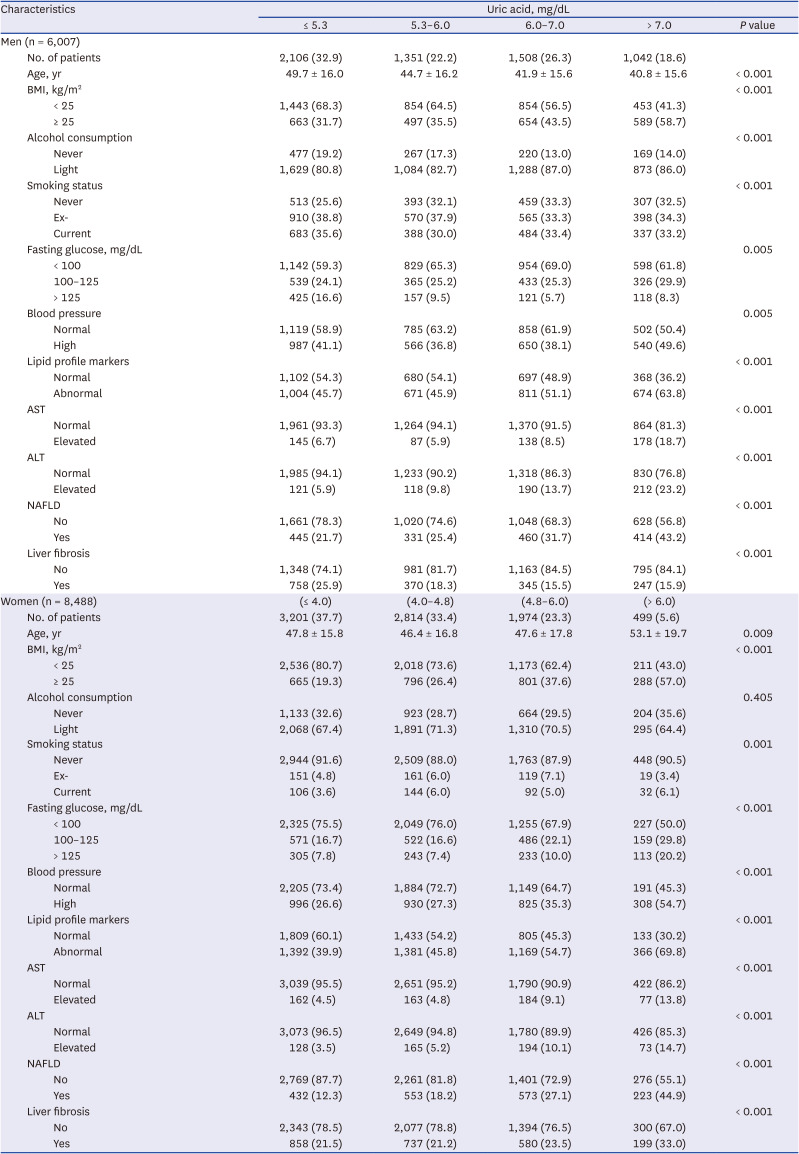
The general characteristics of the 14,495 participants (men = 6,007, women = 8,488) are presented in Table 1. Among men, ≤ 5.3, 5.3–6.0, 6.0–7.0, and > 7.0 mg/dL SUA groups comprised 2,106 (32.9%), 1,351 (22.2%), 1,508 (26.3%), and 1,042 (18.6%) individuals, and the mean (standard deviation) ages were 49.7 (16.0), 44.7 (16.2), 41.9 (15.6), and 40.8 (15.6), respectively. Among women, ≤ 4.0, 4.0–4.8, 4.8–6.0, and > 6.0 mg/dL SUA groups comprised 3,201 (37.7%), 2,814 (33.4%), 1,974 (23.3%), and 499 (5.6%) individuals, and the mean ± standard deviation ages were 47.8 ± 15.8, 46.4 ± 16.8, 47.6 ± 17.8, and 53.1 ± 19.7, respectively.
Table 1
General characteristics of study populations by serum uric acid levels
The association between SUA levels and liver enzymes AST and ALT at the baseline of the lowest SUA level group is presented in Table 2. Among men, > 7.0 mg/dL SUA group showed a higher OR of AST elevation (aOR, 2.40; 95% CI, 1.82–3.18; P for trend < 0.001) than the ≤ 5.3 mg/dL SUA group, in the fully adjusted logistic regression model, Model 2. Among women, 4.8–6.0 and > 6.0 mg/dL SUA groups showed a higher OR of AST elevation (aOR, 1.78 and 2.03; 95% CI, 1.37–2.32 and 1.40–2.96, respectively; P for trend < 0.001) compared to ≤ 4.0 mg/dL SUA group in Model 2. Among men, 5.3–6.0, 6.0–7.0, and > 7.0 mg/dL SUA groups showed a higher OR of ALT elevation (aOR, 1.56, 2.00, and 2.73; 95% CI, 1.13–2.16, 1.48–2.70, and 2.07–3.61, respectively; P for trend < 0.001) compared to ≤ 5.3 mg/dL SUA group in Model 2. Among women, 4.0–4.8, 4.8–6.0, and > 6.0 mg/dL SUA group showed a higher OR of ALT elevation (aOR, 1.35, 2.26, and 2.37; 95% CI, 1.02–1.79, 1.72–2.97, and 1.60–3.50, respectively; P for trend < 0.001) compared to ≤ 4.0 mg/dL SUA group in Model 2.
Table 2
Association between serum uric acid level and elevation of liver enzymes, AST, and ALT
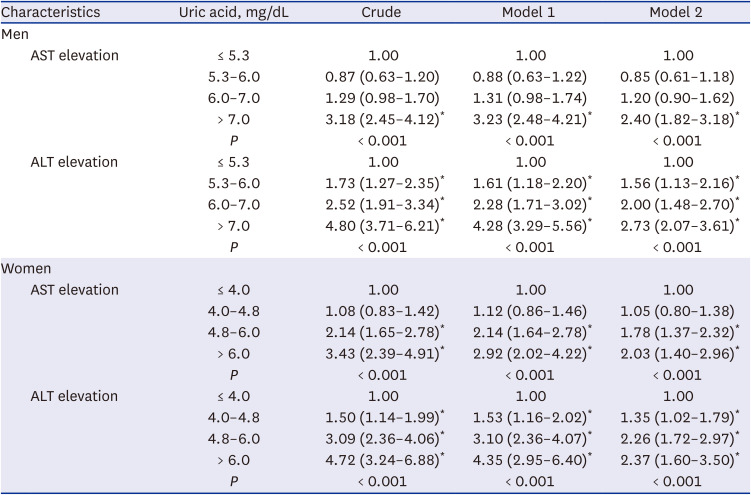
Adjusted odds ratios (95% confidence intervals) were calculated using logistic regression model analysis. The dependent variable was serum uric acid level (mg/dL), and the independent variable was elevation of liver enzymes, AST and ALT. Model 1 adjusted for age. Model 2 was adjusted for Model 1 + alcohol consumption, smoking habits, body mass index, fasting glucose, blood pressure, and lipid profile markers.
AST = aspartate aminotransferase, ALT = alanine aminotransferase.
*P for trends is demonstrated. P value < 0.05.
Supplementary Table 1 shows the association between SUA levels and NAFLD in both men and women. No significant associations were observed in men. However, among women, all groups that were 4.0–4.8, 4.8–6.0, and > 6.0 mg/dL SUA groups showed higher OR of NAFLD (aOR, 1.40, 1.59, and 1.88; 95% CI, 1.13–1.73, 1.27–1.99, and 1.35–2.64, respectively; P for trend < 0.001) compared to ≤ 4.0 mg/dL SUA group with Model 2. The association between SUA levels and NAFLD stratified by ALT status is shown in Table 3. Among women with normal ALT (≤ 34 mg/dL), 4.0–4.8 and > 6.0 mg/dL SUA groups showed a higher OR of NAFLD (aOR, 1.28 and 1.52; 95% CI, 1.01–1.62 and 1.06–2.19, respectively) compared to ≤ 4.0 mg/dL SUA group (Model 2).
Table 3
Association between serum uric acid level and nonalcoholic fatty liver disease assessed by hepatic steatosis index, stratified for ALT
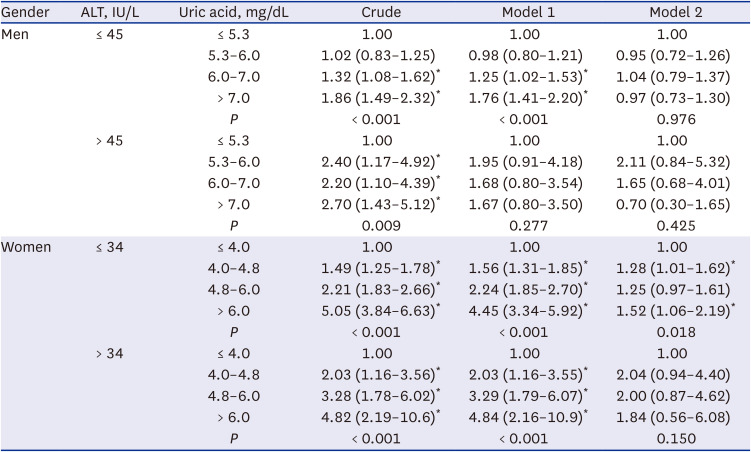
Adjusted odds ratios (95% confidence intervals) were calculated using logistic regression model analysis. The dependent variable was serum uric acid level (mg/dL) and the independent variable was nonalcoholic fatty liver disease (hepatic steatosis index > 36). Model 1 adjusted for age. Model 2 was adjusted for Model 1 + alcohol consumption, smoking habits, body mass index, fasting glucose, blood pressure, and lipid profile markers.
ALT = alanine aminotransferase.
*P for trends is demonstrated. P value < 0.05.
Supplementary Table 2 shows the association between SUA levels and liver FIB in both men and women. The associations stratified according to the NAFLD status are presented in Table 4. Among men with NAFLD, > 7.0 mg/dL SUA group showed a higher OR of advanced liver FIB (aOR, 2.25; 95% CI, 1.21–4.19) compared to ≤ 5.3 mg/dL SUA group in Model 2. Among women with NAFLD, > 6.0 mg/dL SUA group showed a higher OR of advanced liver FIB (aOR, 1.89; 95% CI, 1.09–3.27) compared to ≤ 4.0 mg/dL SUA group (Model 2).
Table 4
Association between serum uric acid level and liver fibrosis assessed by fibrosis-4 index, stratified for NAFLD
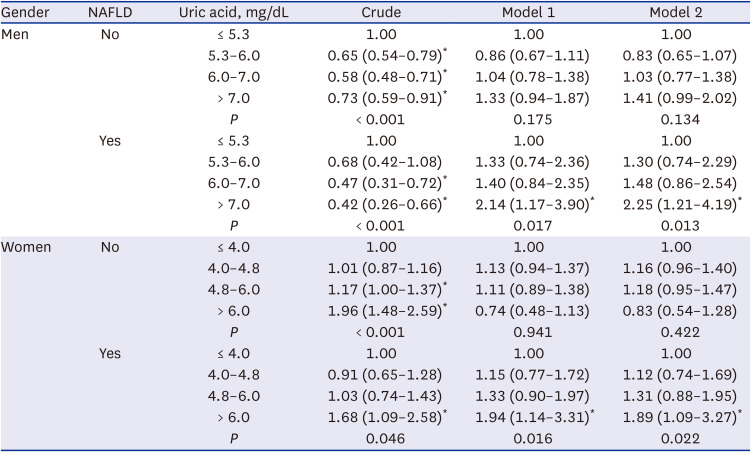
Adjusted odds ratios (95% confidence intervals) were calculated using logistic regression model analysis. The dependent variable was serum uric acid level (mg/dL) and the independent variable was liver fibrosis (fibrosis-4 > 1.3). NAFLD was defined as an hepatic steatosis index of > 36. Model 1 adjusted for age. Model 2 was adjusted for Model 1 + alcohol consumption, smoking habits, body mass index, fasting glucose, blood pressure, and lipid profile markers.
NAFLD = nonalcoholic fatty liver disease.
*P for trends is demonstrated. P value < 0.05.
DISCUSSION
In the present study, the result showed that SUA levels were positively associated with serum AST and ALT levels. This association remained consistent in both sexes even after adjustment for possible confounding factors such as age, alcohol consumption, smoking habit, BMI, fasting glucose, blood pressure, and lipid profile markers. We found that participants within the upper normal range of SUA levels showed a high likelihood of having elevated AST or ALT levels. We also showed that SUA levels were associated with NAFLD in women with normal ALT levels. Additionally, we discovered that hyperuricemia is associated with advanced liver FIB among NAFLD patients in both sexes. This cross-sectional study demonstrated a real-world association between SUA levels and liver damage.
Previous studies have investigated the association between SUA levels and various liver diseases such as NAFLD2437 and liver cirrhosis.25 However, a few studies have suggested a direct association between SUA levels and liver enzymes. Previous findings are consistent with our results that increased SUA levels, even within normal range, are independently associated with elevated serum ALT levels.2738 A recent cross-sectional study in Bangladesh also suggested a positive relationship between SUA levels and ALT levels. However, they found no significant correlation between SUA and AST levels,28 which conflicts with our results. This may be due to the sample size, which was 30 times larger in our study (n = 14,495) than that in the Bangladeshi study (n = 410). Regarding the relationship between SUA and AST, adults with hyperuricemia and gout in the United States have a higher risk of elevated AST.29 To the best of our knowledge, this is the first study to reveal a significant association between SUA and AST elevation in the non-hyperuricemia group.
Some studies have investigated the association between SUA and NAFLD and liver FIB,394041 but few studies have explored the joint association of SUA and ALT with NAFLD. A cross-sectional study in China showed that individuals with low ALT and high SUA levels were more likely to develop NAFLD than those with low ALT and low SUA.42 Our result support this study, but it is noteworthy that we observed an unprecedented linear trend between SUA and NAFLD among the normal ALT group of women. Even within the normal range of ALT levels, women with higher SUA levels had higher odds of developing NAFLD. Furthermore, we found that hyperuricemia was associated with advanced liver FIB among NAFLD patients in both sexes. With nationally representative data, our results support those of previous studies4344 that investigated the relationship between SUA and NAFLD progression. These findings suggest that measuring SUA levels may be useful for screening for liver enzyme elevation, NAFLD, and progression of NAFLD.
The exact mechanism of the association between SUA levels and liver function has not yet been clarified, but several mechanisms have been proposed. In the presented study, the higher the uric acid level, the higher the BMI, which suggests that obesity may be a common cause of hyperuricemia and liver enzyme elevation/fatty liver/FIB (Table 1). Uric acid induces fat accumulation in the liver by inducing free fatty acid influx or directly regulating de novo lipogenesis. Uric acid downregulates adiponectin, an insulin sensitizer, in adipocytes, thereby causing insulin resistance.41 Lipolysis of peripheral adipose tissue and free fatty acid influx into liver are stimulated in the condition of insulin resistance.4546 Excessive fat accumulation in the liver is crucial for the production of lipotoxic lipids, which can cause endoplasmic reticulum stress, oxidative stress, cytokine and/or chemokine release, and liver inflammation.474849 Meanwhile, uric acid can directly stimulate reactive oxygen species production by activating NADPH oxidase.50 Uric acid also stimulates production of C-reactive protein and proinflammatory cytokines, such as intrleukin-1, interleukin-6, and tumor necrosis factor-α, in the liver.49515253 Through these processes, uric acid may contribute to hepatic dysfunction, inflammation, and hepatocellular injury and hepatic FIB. This may be one of reason why there was statistical significance of FIB only in the presence of NAFLD in both men and women with hyperuricemia and further studies are needed.
The major strength of our study was the breadth of nationwide data sources, having a large sample size containing data on abundant possible confounders, which allowed us to analyze precise CIs for the associations between variables. We integrated complex sample data from three different years (2016–2018) and used analysis methods for complex samples that enabled us to generalize our data to the Korean population.
However, our study had several limitations. First, it was based on a cross-sectional design. We could not clearly demonstrate the causality between SUA levels and liver function enzymes. Future studies are needed to clarify causality. Second, some of our confounders were self-reported by participants, which may have caused reporting of inaccurate data. We excluded participants with missing data on covariates and any “I don’t know” answer to overcome it. Third, although our data contained various medication histories, such as anti-hypertensive and anti-diabetic, there was no medication history of uric acid-lowering agents, such as allopurinol and febuxostat. Fourth, we did not consider additional possible confounders such as dietary habits. However, we adjusted for BMI, alcohol consumption, and results of blood tests, which may reflect dietary habits. Fifth, we defined NAFLD and liver FIB with HSI and FIB-4 index, respectively, which are screening tools. Although these indices are widely used and efficient, a liver biopsy is needed for a definitive diagnosis. Sixth, the study population included only Korean adults. Future studies with populations of various ethnicities are required. Finally, we showed the gender difference in the clinical significance of SUA, however the reason for the difference is not clear and we could not explain it through this study. Additional studies are needed in the future.
This is the first study to investigate the association between SUA levels and liver enzymes in the Korean adult population by comparing men and women. Our results showed that high SUA levels were significantly associated with elevated liver enzyme levels after adjusting for possible confounders. High SUA levels are associated with NAFLD in women with normal ALT levels. This implies that it is necessary for clinicians to suspect NAFLD in women with high SUA levels, even if their liver enzymes are in the normal range. Our results also showed that hyperuricemia was associated with advanced liver FIB in the NAFLD group in both sexes. This may give us an indication to check the uric acid level in NAFLD patients to better predict their liver FIB. Our findings suggest the potential importance of SUA in early screening and prevention of liver damage. Future studies are needed to explore the causal relationship between SUA levels and liver damage with careful adjustment for confounders and clarified mechanisms.
 XML Download