

 PDF
PDF Citation
 Print
Print


INTRODUCTION
Implantable cardioverter defibrillators (ICDs) have been used in clinical practice for approximately 40 years.1) Patients with ICDs are at a higher risk for other cardiovascular comorbidities such as long-term hospitalizations and arrhythmias2) Although various monitoring devices are currently used for atrial fibrillation (AF) detection today, these devices have limitations.3) Identifying individuals at high risk of developing AF is very useful in the clinical practice to prevent AF-related complications.
Interatrial block (IAB) and P wave features have recently been proven to be valuable parameters in predicting AF.4)5) Reduced P wave voltage in lead 1 was associated with new-onset AF in patients with coronary artery disease.6) The morphology-voltage-P-wave duration (MVP) electrocardiography (ECG) risk score is calculated using P wave characteristics, and in a single-center study, it was useful in predicting new-onset AF in outpatients referred for coronary angiography in a single-center study.7)
To our knowledge, there are currently no studies evaluating the ability of the MVP ECG risk score’s ability to predict AF in patients with heart failure with reduced ejection fraction (HFrEF) with an implanted ICD. These patients have an important predisposition for AF development.8)9) Early recognition of AF in this high-risk patient group may be clinically important in preventing thromboembolic events and other complications. Our study aims to evaluate the efficacy of MVP ECG risk scores in predicting AF development in the long-term follow-up of patients with an ICDs and HFrEF.
METHODS
Ethical statement
This article does not contain any studies with human participants or animals performed by any of the authors. The study was approved by the ethics committee of Haydarpaşa Numune Training and Research Hospital, University of Health Sciences. (HNEAH-KAEK 2021/262-3487).
Study design
We retrospectively reviewed adult patients (older than 18 years old) with HFrEF who underwent ICD implantation in our hospital between January 2010 and April 2021.
Participants who had an ICDs implanted for pathologies other than HFrEF (such as hypertrophic cardiomyopathy, Brugada syndrome, or long QT syndrome) were excluded. Patients with overt AF diagnoses and patients with AF at first hospitalization were also excluded from this study.
Study population
The patients’ demographic characteristics and clinical findings of the patients were obtained from the hospital database. The patients’ standard 12-lead ECGs (150 Hz filtered, 25 mm/s, and 10 mm/mV) of the patients were evaluated using an EP caliper (EP Studios, Inc., Louisville, KY, USA) application. All ECGs were amplified 10× with 300 dpi scanning and evaluated blindly by 3 independent cardiologists (L.P., S.E., and O.T.) at different times to examine the interobserver variability. To examine the intra-observer variables, the same observer applied the measurements again within one week. The intra-class correlation coefficient was used to evaluate the inter- and intra-observer variabilities. Transthoracic echocardiography was performed in all patients by a cardiovascular imaging specialist using the Vivid 7 (GE Vingmed Ultrasound AS, Horten, Norway) system. HFrEF was defined as patients with a left ventricular ejection fraction ≤40% echocardiographically.10) The MVP ECG risk score was calculated according to previously published criteria.7)
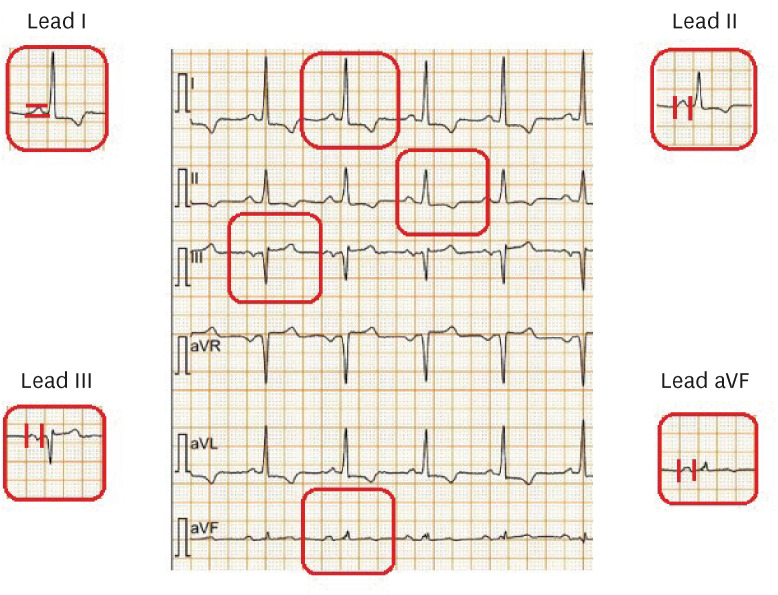
The components of the MVP ECG risk score include P wave morphology in the inferior leads, P wave voltage in lead 1 and P wave duration. The beginning of the P wave was defined as the first upward or downward deviation from the isoelectric line, and the return of the waveform to the isoelectric line was defined as its end.11) In the MVP ECG risk score, partial IAB was defined as a P wave duration of 120 ms or greater while advanced IAB was defined as biphasic (+/−) morphology in the inferior leads alongside this prolongation. In the morphology evaluation, patients with partial IAB were given 1 point, and patients with advanced IAB were given 2 points. In the MVP ECG risk score, a P wave voltage between 0.20 and 0.10 mV in lead 1 is assigned 1 point, and a P wave voltage <0.10 mV is assigned 2 points. The P wave voltage was calculated by measuring the difference between the P wave peak and the isoelectric line from lead 1.11) The P wave duration was measured from leads 2, 3, and the augmented vector foot of the 12-lead ECG. At least 5 consecutive beats were averaged from each ECG. A P wave duration between 120 and 140 ms was given 1 point, and P waves longer than 140 ms were given 2 points.
The patients were divided into 3 groups according to their MVP ECG risk scores. Patients with a total score of 0–2 were included in the low-risk group, those between 3 and 4 in the intermediate-risk group, and those between 5 and 6 were included in the high-risk group. The relationship between long-term AF development and risk groups was investigated. AF diagnoses were made based on records obtained from the health database, ICD recordings, ECG, and Holter monitor results. Since our patients have ICDs, their ECGs taken every six months are recorded in our health database. The current study is an appropriate patient group of ICD patients to be followed more closely. The development of AF was defined as the detection of AF on a 12-lead ECG or ≥30 seconds of AF in Holter or ICD recordings. Atrial high-rate episodes (AHRE) were defined as any sustained episode of atrial tachyarrhythmia greater than 175 beats per minute for more than 5 minutes detected through the atrial lead.12) The diagnosis of AHRE could only be made in patients with dual ICDs, which is 11% of our patient population. If the device recorded AHRE, the patients underwent additional 72-h rhythm Holter monitoring in order to detect AF episodes. This approach was applied when AF could not be detected in serial ECGs. The evaluation of P wave variables in a sample ECG is shown in Figure 1.
Statistical analysis
Baseline characteristics, echocardiographic parameters, laboratory variables and electrocardiographic parameters were compared between groups. Kolmogorov-Smirnov test was used for evaluation of normality. All continuous variables showed skewed distributions and were presented as median (interquartile range; IQR) and compared using the Kruskal-Wallis test. Categorical variables were presented as numbers and percentages. Tukey post hoc test was performed to reveal the statistical difference between the groups. Comparison among categorical variables were performed using Pearson’s χ2 test. Univariate and multivariate Cox-regression analyses were performed to determine the independent predictors of long-term AF diagnosis. Variables with a p value <0.20 in univariate regression were included in the multivariate Cox-regression analysis. The results of regression analysis were presented as hazard ratios (HRs) with 95% confidence intervals (CIs). Further comparison between the three groups was presented using multivariable models. Hierarchical logistic regression analysis was performed for the multivariable analysis to evaluate predictive confounders.
After the follow-up of median 36 (IQR, 31–45) months, the survival rates of the three groups were compared using the Kaplan-Meier survival method. A log-rank test was used to measure the differences between the groups. A forward cox-regression analysis was performed to present the long-term AF diagnosis. The HR presents the relative risk of long-term AF diagnosis. Two models were formed to obtain the effect of potential confounders on the association between the MVP ECG risk score and long-term AF diagnosis. The models were 1) unadjusted, 2) adjusted for age, diabetes mellitus, cerebrovascular accident, left atrium antero-posterior diameter and left ventricle ejection fraction.
A 2-tailed p value of <0.05 was considered as statistically significant, and 95% CIs were presented for all HRs. Cut-off values of MVP ECG risk score and long-term AF diagnosis with the highest sensitivity and specificity were calculated by nonparametric receiver operating characteristics (ROC) curve analysis. Intra-observer and inter-observer variabilities were assessed with the intraclass correlation coefficient (ICC). Analyses were performed using Statistical Package for Social Sciences software, version 20.0 (SPSS; IBM Corp., Armonk, NY, USA).
RESULTS
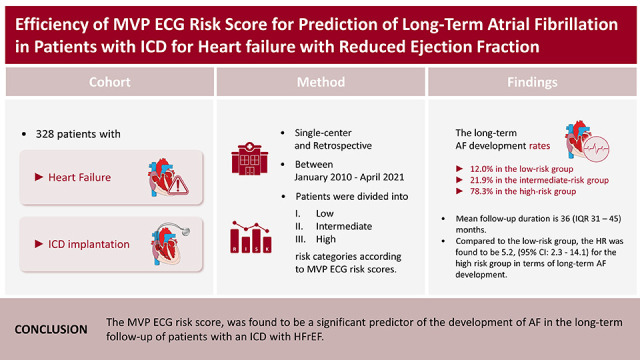
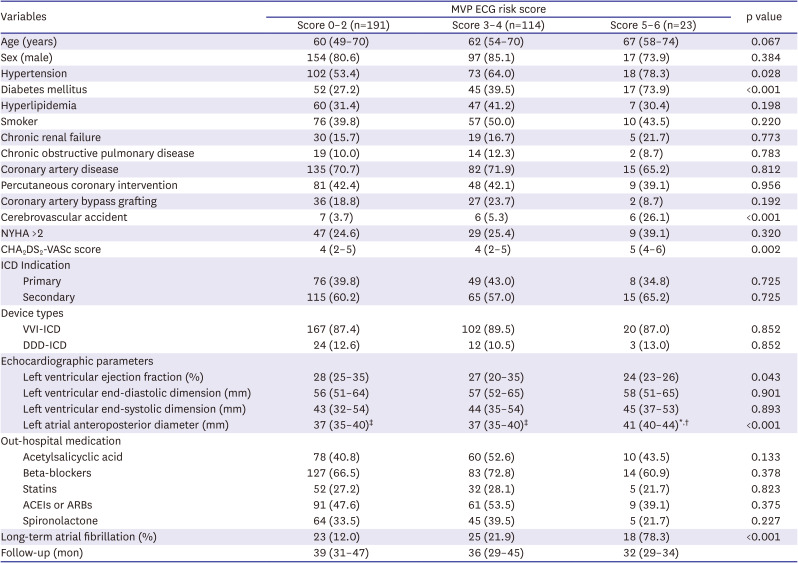
In total, 328 patients were included in the study: 191 were in the low-risk group, 114 were in the intermediate-risk group, and 23 were in the high-risk group. Basic clinical features and echocardiographic findings are shown in Table 1. ICDs were implanted in 133 patients for primary prevention, and 195 for secondary prevention. The left atrium of patients in the high-risk group was more dilated than the left atrium of those in the other 2 groups (p<0.001). In addition, the ejection fraction of the patients in the high-risk group was lower than that in the other groups (p=0.043). The long-term AF development rate was 12% in the low-risk group, 21.9% in the medium-risk group, and 78.3% in the high-risk group. AF was detected in 59 (20.4%) patients with a single ICD and in 7 (17.9%) patients with a dual ICD. In 2 patients, AHRE was detected from the ICD recordings and AF was diagnosed with subsequent 72-hour rhythm Holter monitoring.
Table 1
Basic clinical characteristics and echocardiographic findings according to MVP ECG risk scores
Continuous variables are presented as median (interquartile range); nominal variables presented as frequency (%).
DDD = dual-chamber; ECG = electrocardiography; ICD = implantable cardioverter defibrillator; NYHA = New York Heart Association; MVP = morphology-voltage-P-wave duration; VVI = single-chamber.
*p<0.005, MVP ECG risk score 0–2 (post hoc test); †p<0.005, MVP ECG risk score 3–4 (post hoc test); ‡p<0.005, MVP ECG risk score 5–6 (post hoc test).
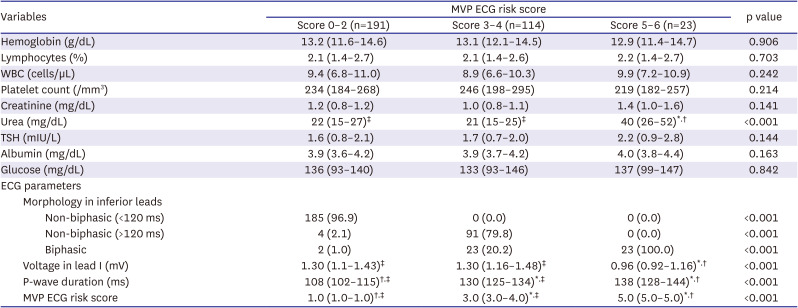
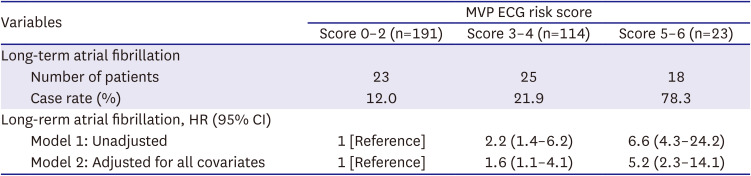
Laboratory variables and electrocardiographic findings according to the MVP ECG risk score of all patients are shown in Table 2. The CHA2DS2-VASc score was significantly different among the groups (p<0.002). The patients in the high-risk group had a higher CHA2DS2-VASc score than that of the patients in the other two groups. Univariate analysis revealed that age, diabetes mellitus, cerebrovascular accident, left atrium antero-posterior diameter, left ventricle ejection fraction, CHA2DS2-VASc score, and MVP ECG risk score were predictors of long-term AF. In the multivariate analysis, age, cerebrovascular accident, left atrium antero-posterior diameter, and MVP ECG risk score (HR, 1.451; 95% CI, 1.206–1.746) were found to be independent variables predicting long-term AF (Table 3). For long-term follow-up, the MVP ECG risk score 5–6 group had a 6.6 times higher risk of long-term AF than the MVP ECG risk score 0–2 group, which was used as the reference group. This persisted after adjustment for confounders demonstrated to independently predict long-term AF; the MVP ECG risk score 5–6 group had 5.2 times higher rates of long-term AF compared to those for the MVP ECG risk score 0–2 group (Table 4). Interobserver ICC results showed that the voltage measurement median value was 0.82 (95% CI, 0.77–0.87), and the P wave duration was 0.79 (95% CI, 0.74–0.83). In addition, intra-observer ICC results revealed that the voltage measurement median value was 0.86 (95% CI, 0.81–0.91), and the P wave duration was 0.83 (95% CI, 0.79–0.89).
Table 2
Laboratory variables and ECG findings of all patients according to MVP ECG risk score
Continuous variables are presented as median (interquartile range); nominal variables presented as frequency (%).
ECG = electrocardiography; MVP = morphology-voltage-P-wave duration; TSH = thyroid-stimulating hormone; WBC = white blood cell.
*p<0.005, MVP ECG risk score 0-2 (post hoc test); †p<0.005, MVP ECG risk score 3-4 (post hoc test); ‡p<0.005, MVP ECG risk score 5-6 (post hoc test).
Table 3
Univariable and multivariable Cox regression analysis for long-term atrial fibrillation prediction
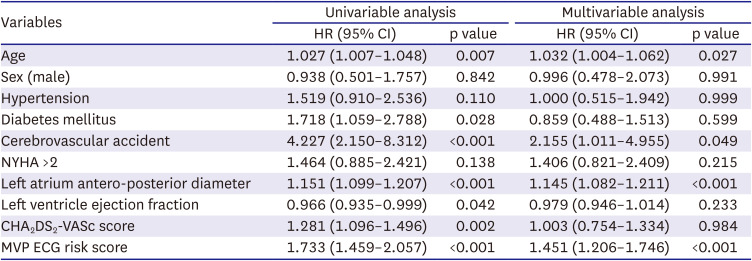
Table 4
Cox- regression models for long-term atrial fibrillation incidence by MVP ECG risk score
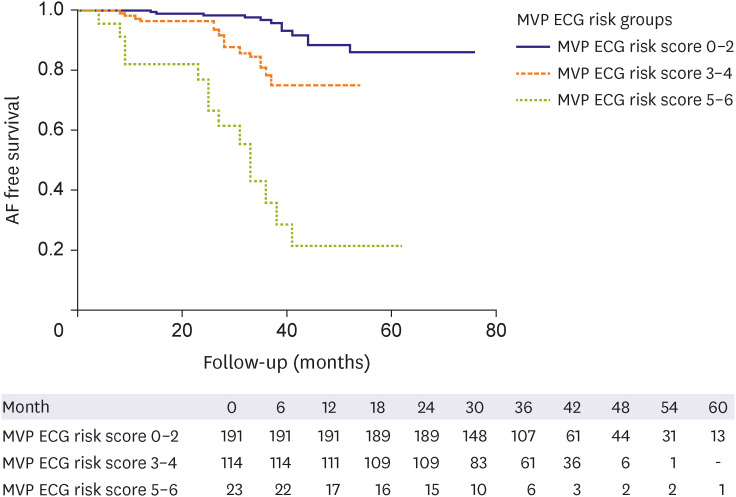
In the ROC analysis, the optimal cut-off value of the MVP ECG risk score to predict long-term atrial fibrillation was 3, with 66% sensitivity and 65% specificity (area under the ROC curve, 0.69; 95% CI, 0.61–0.77; p<0.001) (Figure 2). In addition, Figure 2 shows the ROC curves of left atrium anterior posterior diameter, left ventricular ejection fraction and urea value. Figure 3 illustrates the 6-year Kaplan-Meier survival curve for AF free survival by MVP ECG risk score groups and demonstrated AF free survival rates of 88.0%, 78.1% and 21.7% respectively (log-rank test: 79.46; p<0.001).
Figure 2
ROC analysis showing that the MVP ECG risk score is 3 with an optimal cut-off value of 3 with 66% sensitivity and 65% specificity to predict long-term atrial fibrillation.
CI = confidence interval; ECG = electrocardiography; MVP = morphology-voltage-P-wave duration; ROC = receiver operating characteristics.

DISCUSSION
The MVP ECG risk score was found to be an independent predictor of the development of long-term AF in patients with an ICD implanted and who had HFrEF. The MVP ECG risk score is already considered to have significant value for the prediction of AF in patients with coronary disease, heart failure, ischemic stroke, diabetes mellitus, and hypertension, in which AF is of high clinical importance.13)14)15)16)17) In our study, we included patients with an ICD implanted with HFrEF who had a high probability of experiencing AF.
The frequency of patients implanted with an ICD is increasing.18) Identifying patients who should be followed closely in this vulnerable group with high risk of developing AF is essential. Identifying individuals at higher risk of developing AF may facilitate targeting preventive interventions and screening programs for early AF detection in high-risk subgroups.
The Catheter Ablation for Atrial Fibrillation with Heart Failure (CASTLE-AF) study demonstrated that AF ablation in patients with heart failure reduced all-cause mortality and hospitalizations for worsening heart failure compared to medical treatment.19) In this context, early identification of AF in heart failure patients can be achieved with the MVP ECG risk score so that they can be offered crucial early intervention. Close follow-up of patients in the high-risk group according to the score and early diagnosis of AF may increase the success of ablation therapy. Early rhythm control may be achieved in these high-risk patients as a preventive strategy to avoid AF complications. Additionally, routine evaluation of the MVP ECG risk score in patients who undergo cardioversion for AF and achieve sinus rhythm may help in the identification of patients who should be monitored closely for AF recurrence.
Mortality increases approximately two-fold in patients who receive an inappropriate ICD shock.20)21) The most common cause of inappropriate ICD shock is AF or supraventricular tachycardia with rapid ventricular response, with an incidence of 15–18%.20)22) In addition, heart failure patients with new AF have a higher mortality rate.23)24) Consequently, inappropriate ICD shocks due to AF may be associated with the worsening of heart failure. Using the MVP ECG risk score, it may be possible to reduce inappropriate ICD shocks due to AF through the early treatment of this condition.
Large cohort studies with long follow-up periods are needed to accelerate the transition into using the MVP ECG risk score in routine clinical practice. In addition to its proven efficacy in high-risk patient groups, its effectiveness in the general population should also be investigated. However, since the development of AF in low-risk patient groups takes a long time, the follow-up periods should also be over the long term. The prediction power of the current scoring system can be improved with clinical data, such as weight, blood pressure, and history of smoking, as well as echocardiographic measurements, such as left atrial diameter and epicardial fat thickness. A high MVP ECG risk score may be associated with atrial aging and degeneration. In future studies, the accuracy of this relationship can be evaluated with voltage mapping systems.
In clinical practice, determining which patients need screening for cardiac rhythm disturbances is challenging. To identify patients at a high risk of developing AF, a simple, noninvasive and easily accessible scoring system using variables obtained from an ECG is valuable in terms of monitoring and classifying patients more accurately. Thus, the MVP ECG risk score can help clinicians decide which patients need further monitoring to detect AF. Determining the best predictive risk scores is essential to effective routine clinical practice. In the near future, it may also be possible to calculate risk scores automatically using artificial intelligence. The MVP ECG risk score may further be useful as a tool for investigating the efficacy and safety of anticoagulant therapy in patients without AF who are at high risk according to their MVP score, potentially using randomized, controlled studies with large patient populations.
Our study has several limitations. First, our study is single-center and observational. Since it is a retrospective study, it should be acknowledged that previous records may not all have been assessed. To overcome this limitation, all patients who had an ICD between the specified dates were evaluated. Second, even if patients with previously documented episodes of AF were excluded from the study, patients with previously undocumented episodes were likely to be included. Finally, due to the low number of dual ICDs in our patient population, it is possible that silent AF episodes and all AHRE episodes were not reported in all patients during follow-up.
In conclusion, to best of our knowledge, this is the first study in which the MVP ECG risk score was evaluated to predict AF in patients with an ICD implanted with HFrEF. The MVP ECG risk score, based on the 12-lead surface ECG is a simple and easily accessible test and an independent predictor for the development of long-term AF in this population. This risk score can be used to identify patients who require closer follow-up to prevent AF related complications.
 XML Download