

 PDF
PDF Citation
 Print
Print


INTRODUCTION
The purpose of a school meal service is to provide well-balanced nutrition to promote the growth, development, and proper dietary habits in students. As of February 2022, 11,976 schools in the Republic of Korea (hereinafter referred to as Korea) served at least one meal per day to 5.34 million students. Additionally, 6,277 nutrition teachers had been assigned to 57.4% of 10,712 schools with on-site meal service facilities [1]. The full implementation of the school meal service has been in place since 2003 in Korea, with some schools providing breakfast and dinner in addition to lunch.
The school meal service has a considerable impact on the growth and health of students. The school meals provided over one-third of the Dietary Reference Intakes for Korean (KDRIs) for energy, protein, vitamin A, thiamine, riboflavin, vitamin C, calcium, and iron [2]. The meals offered in all-girls high schools in Gyeonggi-do yielded 820.4 kcal of energy (41.0% of KDRIs), 31.8 g of protein, 289.5 mg of calcium, and 4.4 mg of iron per day, on average [3].
Based on a 2013 study on the reduction of sodium in school meals conducted by the Ministry of Education [2], the target sodium level per school meal was set to 900, 1,000, and 1,300 mg for elementary, middle, and high school students, respectively. The recommended salt content in soups and stews was set to 0.6% and 0.7% for elementary/middle and high school students, respectively. However, the salt content provided in school meals is high [45], and in particular, sodium content was relatively high in one-dish meals or noodles [467]. In middle schools in the Gyeongbuk region, an average sodium amount of 1,736.02 mg/meal was served, while the salt content in soups and stew was 0.69–0.80%, which exceeded the level recommended by the Ministry of Education (0.6%) [5]. Among meals served in elementary/middle and high schools, the sodium content of one-dish meals was 245 and 278 mg, respectively, while that in noodles was 319 and 291 mg, respectively, at least 8–13 times higher than in regular cooked rice [4].
Excessive sodium intake is associated with various diseases such as hypertension, cardiovascular disease, and gastric cancer [89], and various studies have reported that higher sodium intake can increase the excretion of calcium through urine, thereby adversely affecting skeletal health [10111213]. Furthermore, excessive sodium intake can negatively affect reproductive health [14]. Therefore, school-aged children should be encouraged to avoid excessive sodium intake and nurture proper dietary habits.
As Korean school-aged children eat at least one meal from the school meal service and consume high levels of sodium in school meals, it is necessary to reduce the sodium content in school meal service to achieve sodium reduction in the diets of Korean school-aged children. Although the Enforcement Rule of the School Meals Act [15] stipulates that “salt, oils and fats, simple sugars, or food additives should not be used in excessive amount,” specific criteria for sodium reduction are lacking. According to the basic direction of school meal service, schools are recommended to establish their own sodium reduction plans and incorporate low-sodium diets, use a salt meter, implement meal-without-soup days, manage appropriate salt level in soups (0.6–0.7%), and conduct sodium-related education [16].
To reduce sodium, the practices of seasoning soup or stew at the end of cooking or blanching processed meat products such as ham to remove excessive sodium have been implemented [17]. Nearly two-thirds (62.7%) of school nutrition teachers and dietitians in Gyeonggi-do used a salt meter to check the sodium content of soups and stews [18], and 77.4% of schools in the Daegu area served low-sodium meals [19]. Although nutrition teachers and dietitians perceived the importance of reducing the sodium content in school meals [2021], the actual on-site practice of sodium reduction was, nonetheless, not satisfactory.
Numerous studies have been conducted on the practice of sodium reduction in school meal service at the local and regional levels [171819]; however, nationwide research on the status of sodium reduction in school meal service is still lacking. The literature [1718] has focused on ways to reduce sodium primarily in the cooking process. We could not find any investigations on the importance and performance of sodium reduction practices in purchasing, food preparation, serving, and education stage.
This study examined the importance and performance level of sodium reduction practices in purchasing, food preparation, serving, and education for school meal service, as perceived by nutrition teachers and dietitians in kindergartens, elementary schools, middle schools, and high schools in nationwide level. It also analyzed the differences according to school level and placement of the nutrition teacher in providing basic data for sodium reduction in school meals.
Go to : 
SUBJECTS AND METHODS
Participants
Among the 11,082 kindergarten, elementary, middle, and high schools utilizing the NEIS (National Education Information System) meal service system, approximately 10% (n = 1,068) of schools were selected for this study through proportional stratified quota sampling, considering school level (kindergarten, elementary, middle, and high schools), foodservice type (urban, agri-fishery town, and remote island and country), and region (17 cities and provinces). An online survey was conducted among nutrition teachers and dietitians in the selected schools using questionnaires (n = 608, response rate: 57%). All participants provided informed consent, and this study was approved by the Institutional Review Board of Kongju National University (approval number: KNU_IRB_2021-103). The survey was conducted between September 28 and November 12, 2021.
Development of the questionnaire
The questionnaire comprised 11 items related to sodium reduction practice and 13 items concerning participants’ general characteristics, including sex and age, and general characteristics of the schools, such as school type and foodservice type. For the items related to sodium reduction practice, three items about purchasing, five items about food preparation and serving, and three items about education were included based on previous studies [222]. The importance and performance level of each item was measured on a 5-point scale (1 = not important at all/never perform to 5 = very important/always perform). The content validity, clarity, and conciseness of the measurement items were verified with five nutrition teachers.
The importance-performance analysis (IPA) method
This study adopted IPA as the methodological approach to determine the priorities of the factors to be improved in sodium reduction practices. The IPA technique is a basic diagnostic decision tool [23] that facilitates the identification of improvement prioritization [24]. Attributes are compared or classified according to the relative importance and performance ratings. The IPA technique is also categorized into quality attributes in an IPA grid [25], which gives a typology that classifies importance and performance on a scale of low or high into four categories: 1) concentrate here (high importance and low performance), 2) keep up the good work (high importance and high performance), 3) low priority (low importance and low performance), and 4) possible overkill (low importance and high performance).
The IPA has been used in hospitality and tourism research for years since the seminal work by Martilla and James [25]. IPAs are also used as tools to evaluate the importance and performance of the task of dietitians in public health nutrition areas [26] and of sanitation management of cooks in childcare centers [27].
Data analysis
The results were analyzed using SPSS Package Program (version 26.0; IBM Corp., Armonk, NY, USA). All data were compared according to school level and placement of nutrition teacher. Significant differences in distribution were tested by χ2 test or Fisher’s exact test, while the mean difference was tested by t-test or one-way analysis of variance and Duncan’s post-hoc test. Statistical significance was set at < 0.05. An IPA was performed on sodium reduction measures and the difference between importance and performance was tested by paired t-test. For an IPA grid analysis of the importance and performance of sodium reduction practices, the importance of 11 items of sodium reduction practices was put on the x-axis and the performance on the y-axis. Coordinates (x, y) for each item were marked with a dot, and the mean value of importance was set as a reference value of the x-axis while that of performance was set as a reference value on the y-axis for the 2 groups: low and high scores.
Go to :
RESULTS
General characteristics
Table 1 presents the general characteristics of 608 participants from 608 schools (25 kindergartens, 323 elementary schools, 136 middle schools, and 124 high schools). Most participants were female (98.8%), with no significant difference in sex between school levels. The mean age of the participants was 43.4 years; those working in elementary (45.9 years) and middle (43.0 years) schools were significantly older than those working in kindergartens (37.0 years) and high schools (38.4 years; P < 0.05). The mean total work experience as nutrition teachers and dietitians was 16.0 years, appearing in the order of elementary school (18.7 years), middle school (14.8 years), high school (11.8 years), and kindergarten (8.3 years; P < 0.05). The overall placement rate of nutrition teachers was 57.7%, with the highest rate in elementary schools (76.5%) and lowest rate in kindergartens (4.0%; P < 0.001). Nutrition teachers (44.9 years) were older than dietitians (41.4 years; P < 0.001) and had longer work experience (P < 0.001). Most nutrition teachers (70.4%) were assigned to elementary schools, thus indicating a difference from dietitians (P < 0.001).
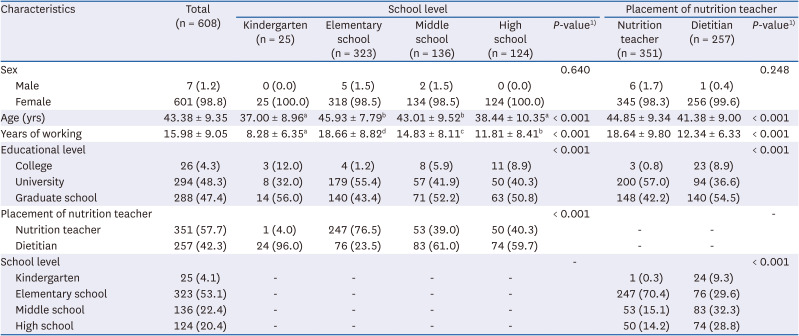
Table 1
General characteristics of the respondents
Values are presented as number (%) or mean ± SD.
1)P-value by χ2 test, Fisher’s exact test, analysis of variance, or t-test.
a-dValues in the same row with different superscripted letters are significantly different at P < 0.05 using analysis of variance and Duncan’s multiple range test.
![]()
Table 2 presents the general characteristics of the 608 schools included in the study. Concerning foodservice type, the results showed 67.9%, 28.0%, and 4.1% for urban, agri-fishery town, and remote island and country types, respectively, demonstrating no significant difference between school levels. Overall, public schools accounted for the highest percentage with 84.4%, and all the kindergartens included in the study were public schools. The percentage of public schools was relatively higher among elementary schools (96.6%), as compared to middle schools (77.2%) and high schools (57.3%; P < 0.001). Concerning the foodservice system, a conventional system accounted for the highest proportion (89.8%), while the percentage of commissary type was relatively high among high schools (16.1%; P = 0.007). Regarding the eating place, most schools had cafeterias (87.2%). There were significant differences according to school level, with the lower school level showing a relatively higher percentage of classroom service type (P = 0.003). Based on lunch service, the number of students served exceeded 500 in elementary, middle, and high schools, which was higher than that in kindergartens (P < 0.05); whereas, the number of meals served per day was the highest in high schools, corresponding to 1.93 meals (P < 0.05).
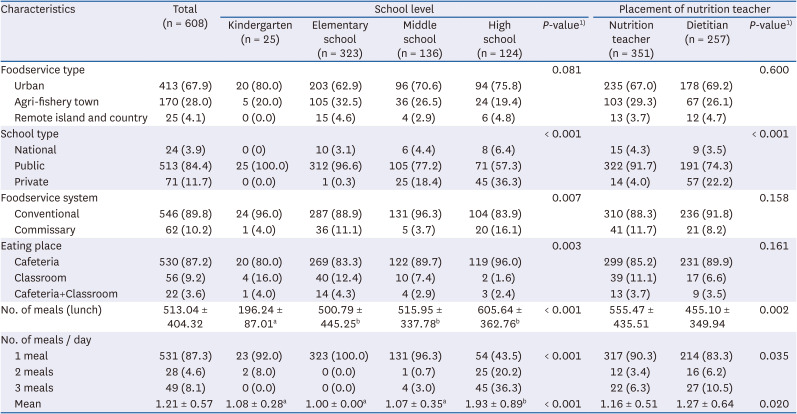
Table 2
General characteristics of the subject schools
Values are presented as number (%) or mean ± SD.
1)P-value by χ2 test, analysis of variance or t-test.
a,bValues in the same row with different superscripted letters are significantly different at P < 0.05 using analysis of variance and Duncan’s multiple range test.
![]()
Concerning differences according to placement of nutrition teacher, most nutrition teachers (91.7%) were working in public schools, thereby indicating a difference from dietitians (P < 0.001). Based on the lunch service, the number of students served was higher in schools with a nutrition teacher with 555 students (P = 0.002), while the number of meals served per day was higher in schools with a dietitian (1.27 meals) than in schools with a nutrition teacher (1.16 meals; P = 0.020).
Importance-performance regarding sodium reduction practice
Table 3 presents the results on the importance and performance of various sodium reduction measures. Overall, “using a salt meter during food preparation” (4.25 points) had the highest importance score, followed in order by “sodium reduction education for students” (4.13 points) and “sodium reduction education for cooks” (4.04 points). Moreover, “purchasing food ingredients by comparing the sodium content in nutrition labeling” had the lowest importance score with 3.62 points. Additionally, “serving precise portions” (3.72 points) and “indicating the amount of seasoning in standard recipes” (3.73 points) had relatively low importance.
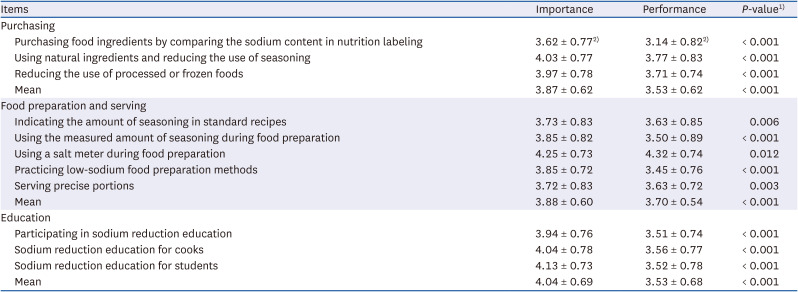
Table 3
Importance and performance levels of sodium reduction practices
Values are presented as mean ± SD.
1)P-value by paired t-test, 2)5-point scale (1 = not important at all/never perform to 5 = very important/always perform).
![]()
Concerning performance, “using a salt meter during food preparation” (4.32 points) had the highest performance score, followed in order by “using natural ingredients and reducing the use of seasoning” (3.77 points) and “reducing the use of processed or frozen foods” (3.71 points). “Purchasing food ingredients by comparing the sodium content in nutrition labeling” had the lowest performance score with 3.14 points.
In the comparison of importance and performance, the mean importance scores were higher than mean performance scores in all categories: purchasing (P < 0.001), food preparation and serving (P < 0.001), and education (P < 0.001). Moreover, there were significant differences between importance and performance for all items. For all items except “using a salt meter during food preparation,” the importance scores were significantly higher than the performance scores, whereas for “using a salt meter during food preparation,” the performance score (4.32 points) was significantly higher than the importance score (4.25 points; P = 0.012).
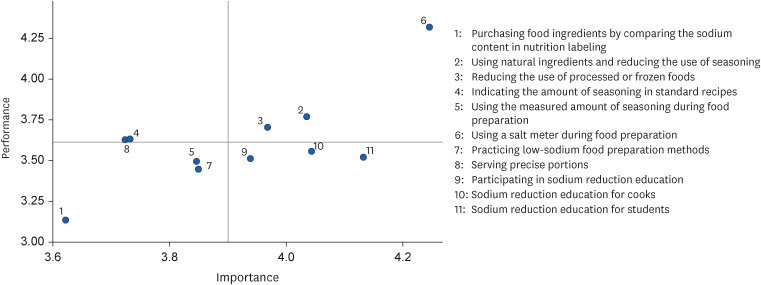
Fig. 1 illustrates the IPA results. “Using a salt meter during food preparation” was assessed to have the highest importance and performance. “Using natural ingredients and reducing the use of seasoning” and “reducing the use of processed or frozen foods” had high importance and performance scores as well. These three attributes were classified as “keep up the good work” that should be maintained. “Purchasing food ingredients by comparing the sodium content in nutrition labeling” was assessed to have the lowest importance and performance (“low priority”), which did not require greater effort than that currently expended. “Using the measured amount of seasoning during food preparation” and “practicing low-sodium food preparation methods” were also classified in this quadrant. Contrastingly, “participating in sodium reduction education,” “sodium reduction education for cooks,” and “sodium reduction education for students” were assessed to have high importance but low performance. These attributes were classified into the “concentrate here” quadrant, thus indicating areas that need urgent improvement. Therefore, there is a need to focus on improving the performance level on these attributes.
Differences in importance and performance according to school level
Table 4 presents the analysis results of the differences in importance and performance according to school level. The results showed significant differences in importance scores in “using natural ingredients and reducing the use of seasoning” (P = 0.002), “reducing the use of processed or frozen foods” (P = 0.002), “using the measured amount of seasoning during food preparation” (P = 0.047), and “sodium reduction education for cooks” (P = 0.018), which were assessed higher in lower school levels. There were significant differences in all items in performance scores according to school level except “indicating the amount of seasoning in standard recipes,” “using a salt meter during food preparation,” and “serving precise portions.” Overall, the performance in kindergartens and elementary schools was higher than that in middle and high schools.
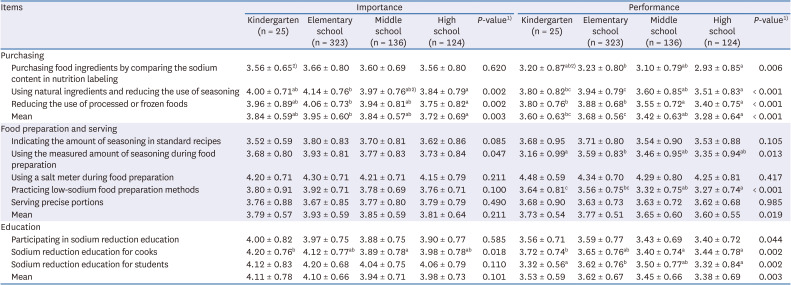
Table 4
Importance and performance levels of sodium reduction practices according to school level
Values are presented as mean ± SD.
1)P-value by analysis of variance, 2)5-point scale (1 = not important at all/never perform to 5 = very important/always perform).
a-cValues in the same row with different superscripted letters are significantly different at P < 0.05 using analysis of variance and Duncan’s multiple range test.
![]()
Differences in importance and performance according to placement of the nutrition teacher
Table 5 presents the analysis results of the differences in importance and performance according to placement of nutrition teacher. In the purchasing category, nutrition teachers assessed “using natural ingredients and reducing the use of seasoning” (P = 0.001) and “reducing the use of processed or frozen foods” (P = 0.007) as having higher importance, as compared with dietitians. The mean importance score in the purchasing category was also significantly higher among nutrition teachers (3.93 points) than among dietitians (3.80 points; P = 0.006). In the food preparation and serving category, there were no significant differences between the mean importance scores of the 2 groups; however, the importance score for “practicing low-sodium food preparation methods” was higher among nutrition teachers (3.90 points) than among dietitians (3.78 points; P = 0.038). In the education category, there were no significant differences in importance scores between the 2 groups.
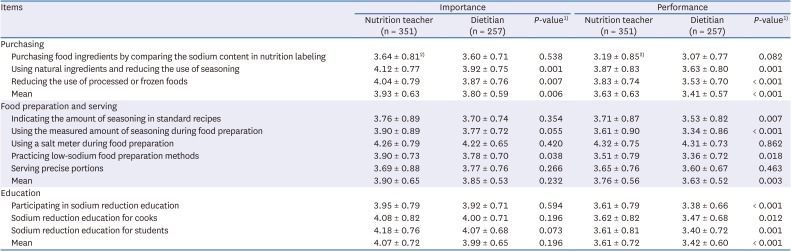
Table 5
Importance and performance levels of sodium reduction practices according to placement of nutrition teacher
Values are presented as mean ± SD.
1)P-value by t-test, 2)5-point scale (1 = not important at all/never perform to 5 = very important/always perform).
![]()
Concerning performance, nutrition teachers had higher performance scores than dietitians in all categories: purchasing (P < 0.001), food preparation and serving (P = 0.003), and education (P < 0.001). Nutrition teachers had higher performance scores for “using natural ingredients and reducing the use of seasoning” (P = 0.001) and “reducing the use of processed or frozen foods” (P < 0.001) in the purchasing category; and “indicating the amount of seasoning in standard recipes” (P = 0.007), “using the measured amount of seasoning during food preparation” (P < 0.001), and “practicing low-sodium food preparation methods” (P = 0.018) in the food preparation and serving category. In the education category, nutrition teachers had significantly higher performance scores for “participating in sodium reduction education” (P < 0.001), “sodium reduction education for cooks” (P = 0.012), and “sodium reduction education for students” (P = 0.001).
Go to :
DISCUSSION
Managing the sodium content in school meal service could be an effective strategy to reduce sodium intake and contribute to healthy dietary habits during childhood. Among the measures for sodium reduction in school meal service in this study, using a salt meter during food preparation revealed the highest importance and performance scores. According to previous studies [1928], most schools used a salt meter, which is consistent with the current results. As the purpose of the salt meter is to check the final salt content in cooked foods, accurately planning the amount of salt or seasoning in standard recipes using scientific calculation and accurately measuring them are of primary importance to reduce sodium intake. However, the importance of salt planning through standard recipes, which is the starting point for systematic salt content management, was perceived at a low level. Kim et al. [19] reported that the importance scores of planning meals considering sodium content and planning meals using natural ingredients instead of processed products were below average, which is consistent with the current results. These results indicate that education on sodium reduction practices for nutrition teachers and dietitians should include specific methods for menu planning.
The importance of serving precise portions was perceived at a low level as well, even as it could ensure the consumption of planned amount of sodium. In a study conducted in middle schools in the USA, the actual portion sizes of menu items served as school meals ranged between 67% and 203% of the planned portion sizes [29]. As increase in a portion size is associated with increased amounts of food and energy intake [3031], cooks should be trained to serve the precise portions planned in the recipes.
Items such as purchasing food ingredients by comparing the sodium content in nutrition labeling, using the measured amount of seasoning during food preparation, and following low-sodium food preparation methods had low importance and performance scores in this study. In Lee’s study [21], 90.5% of nutrition teachers and dietitians who participated in the survey said that they did not use low-sodium products because of lack of information, high price, or lack of product diversity. These results suggest the necessity of development and promotion of various low-sodium products.
Measuring seasonings during food preparation and using low-sodium food preparation methods are also important. A study on restaurant staff in Korea reported that related education increased the likelihood of measuring seasonings and maintaining sodium reduction [22]. In a similar study, the sodium content of foods decreased after low-sodium cooking training intervention [32]. Based on these findings, it is necessary to provide education on the importance of sodium reduction measures not only in the purchasing stage but also in the food preparation stage, such as measuring seasonings and practicing low-sodium food preparation methods.
The IPA results showed that “participating in sodium reduction education,” “sodium reduction education for cooks,” and “sodium reduction education for students” had high importance scores but low performance scores, thus indicating the need for improving these aspects first. According to a previous study, the percentage of nutrition teachers and dietitians who participated in education on sodium reduction was low [2133]. In Lee’s study [18], 87.5% of nutrition teachers and dietitians reported that sodium reduction education was helpful. Further, more than half of nutrition teachers and dietitians responded that specific guidelines were necessary (57.2%) to achieve policy goals about low-sodium school meals. Therefore, opportunities for related education for nutrition teachers and dietitians should be expanded by including information on how to reduce sodium in all stages of school meal service.
Many studies have demonstrated that well-planned nutrition education can have a significant impact on the quality of nutrition knowledge among children and adolescents [34353637383940]. Lee [18] reported that sodium reduction education for students was mostly conducted through passive methods such as home communication (38.9%), school website (37.9%), and cafeteria bulletin board (12.1%). The educational effect for students may be augmented through various forms of learning such as classes, cooking, and experiences.
The importance scores for “using the measured amount of seasoning during food preparation,” “using natural ingredients and reducing use of seasoning,” “reducing use of processed and frozen foods,” and “sodium reduction education for cooks” were lower as the school level increased. The performance scores were also generally lower among middle and high schools than among kindergartens and elementary schools. Previous studies have also reported that sodium reduction practices by nutrition teachers and dietitians decreased with an increase in the school level [1941], which is consistent with the current results. It is probably because the number of schools that serve 2 or 3 meals per day rises as the school level increases, which contribute to the workload. As the school level increases, processed foods are used more frequently to alleviate the workloads, which might have influenced the decrease in performance scores for sodium reduction.
In comparison with natural foods, processed foods contain higher sodium content owing to the addition of salt, preservatives, and chemical seasonings [42]. Lee [19] reported that the frequency of using processed foods in school meal service increased as the school level increased. Lee [43] further demonstrated that the percentages of the sodium intake from processed foods in school meals were high at 36–40% in middle and high schools. Education on sodium reduction should be prioritized for nutrition teachers and dietitians at the middle and high school levels.
Dietitians had lower importance scores than nutrition teachers in three items and lower performance scores than nutrition teachers in eight items. Since the enactment of Chapter 2 Article 7, “Placement of Nutrition Teacher” in the School Meals Act [44] implemented in 2006, the employees in charge of school meal service in Korea have been differentiated as nutrition teachers and dietitians. According to a study investigating the job performance of nutrition teachers and dietitians in the Daejeon and Chungnam areas, dietitians showed lower performance than nutrition teachers in 13 out of 23 items for school meal production [45]. This difference in job performance between nutrition teachers and dietitians can be viewed in the same context as that in the performance of sodium reduction found in this study. Education opportunities for nutrition teachers and dietitians were limited [33] and dietitians reportedly participated in training program less frequently than nutrition teachers [46]. Therefore, the customized education program, especially for school dietitians, should be applied and placement of nutrition teachers should be expanded in a long-term strategy.
In conclusion, sodium reduction education for nutrition teachers and dietitians, cooks, and students should be given priority to practice sodium reduction in school meal service. Various educational materials for sodium reduction should be developed and opportunities for diverse forms of learning, including extra-curricular activities such as cooking classes, should be provided. Especially, education programs for dietitians in middle and high schools should be implemented at the local level.
Specific guidelines for the management of sodium reduction at all stages—purchasing, food preparation, and serving—should be also developed. In particular, items such as purchasing food ingredients by comparing the sodium content on the nutrition labeling, using the measured amount of seasoning during food preparation, and practicing low-sodium food preparation methods with low performance level need to be included in the guidelines. In addition, it is necessary to emphasize the importance of items such as indicating the amount of seasoning in standard recipes and serving precise portions, which are perceived as low in importance, in the guidelines.
This study had a limitation. It used IPA to identity relative importance level in sodium reduction practices in school meal service; however, IPA has been criticized because of various reasons, including potential misclassifications of attributes on the IPA grid [47]. Therefore, future studies are required using a more in-depth approach such as additional analyses suggested by several scholars to enhance the validity of IPA [4849].
This study is meaningful in that it can represent the current state of school meal service in Korea by collecting samples through proportional stratified quota sampling considering the school level, foodservice type, and region. The current results could be used as basic data in implementing sodium reduction measures in school meal service.
Go to :
 XML Download