

 PDF
PDF Citation
 Print
Print


INTRODUCTION
Type 2 diabetes (T2D) is a leading cause of mortality and morbidity worldwide [1234], with an estimated prevalence of 9.3% [1], 67.9 million disability-adjusted life-years [2] and increase in treatment cost [3] worldwide. Evidence for the physiological significance of habitual coffee consumption on T2D manifestations keeps evolving, with some cohort studies [5678] and randomized trials [910] suggesting an inverse association, but others [1112] found a null association. The limitations of these trials included small sample sizes and a short follow-up period. Also, observational studies may not be exonerated from biases that may confound the observed associations, thereby limiting the causal significance of habitual coffee consumption in T2D manifestation.
Mendelian randomization (MR) is a unique method that potentially overcomes these limitations and determines the causal significance of exposure to a disease event, taking advantage of the random assortment of alleles at conception [1314]. With the MR, the exposure-disease association essentially overpowers inherent limitations in traditional epidemiological reports as exposure phenotypes are genetically determined. Even though genetic variants account for a finite exposure variation, multiple independent genetic alleles from genome-wide association studies (GWAS) can be applied to determine causal associations in disease epidemiology [14].
The GWAS and MR studies have been suggested to help understand the significance of coffee consumption in the epidemiology of T2D [151617]. Such information may support nutrition recommendations and public health interventions to manage and prevent T2D. The extensive trans-Atlantic GWAS across multi-ethnic ancestry has identified some genetic alleles associated with T2D [18], but whether genetically predicted habitual coffee consumption (using MR methods) is associated with T2D, particularly among Asian populations, is yet to be clearly understood.
Therefore, we used genetic variants for habitual consumption as a genetic instrument variable to evaluate the association of coffee consumption with T2D prevalence and glycemic traits using the MR analysis.
SUBJECTS AND METHODS
Study population
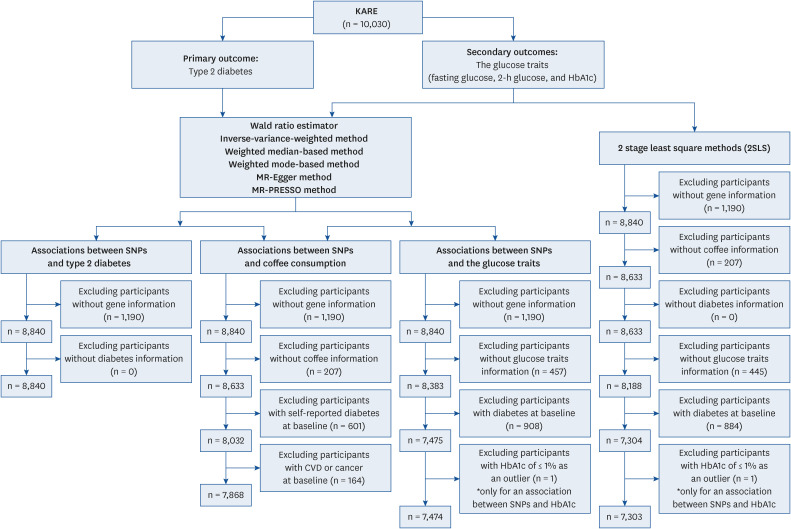
Participants for this study were drawn from the Korea Association REsource (KARE) study [19], a sub-cohort of the Korean Genome and Epidemiology Study (KoGES) in Korea [20]. The KARE study was designed to distinguish genetic variants linked with several diseases among Asians. The study is a population-based cohort of > 10,000 Koreans that assessed > one million genetic variants [1921]. In this study, our primary outcome was T2D, and the secondary outcomes were glycemic traits; fasting blood glucose (FBG), 2h-postprandial glucose (2h-PG) and haemoglobin A1c (HbA1c) profiles. In the first step, we previously conducted the GWAS and identified genetic variants related to coffee consumption [22]. Second, we used an instrument variable from the GWAS-identified genetic variants to examine the associations of genetically predicted coffee consumption with T2D and glycemic traits. The flow chart of the study population is summarized in Fig. 1. The Institutional Review Board (IRB) of Seoul National University Korea (IRB No. E2104/001-010) approved this study.
Fig. 1
Flow diagram of the study population.
KARE, Korean Association REsource; FBG, fasting blood glucose; 2h-PG, 2h-postprandial glucose; HbA1c, haemoglobin A1c; MR, Mendelian randomization; PRESSO, Pleitropy RESidual and Outlier methods; SNP, single nucleotide polymorphism; CVD, cardiovascular disease.
Assessment of coffee consumption and other variables
A validated semi-quantitative 103-item food frequency questionnaire was used to assess coffee consumption in this study [172123]. Participants reported the amount and frequency of coffee consumption in the last twelve months preceding the study. Responses to portion sizes of foods and drink items were a half of, equal to, and 2 times a standard serving size of coffee. Also, the frequency of consumption ranged from rarely to three or more times daily. Coffee consumption was transformed into cups/day. Details of how demographic and lifestyle covariates were obtained and characterized have been reported elsewhere [20]. In brief, information on age, sex, smoking status, alcohol status, and frequency and amount of alcohol drinking was collected using structured questionnaires. We calculated total ethanol consumption (g/day) through the product of frequency and amount. Body mass index (BMI) in kg/m2 was estimated from body weight (kg), and height (m), measured by trained personnel during the physical examination.
Definition of outcomes
HbA1c tests and serum levels of FBG and 2h-PG (from an oral glucose tolerance test) were assessed using the Hexokinase method (ADVIA 1650; Bayer, Inc., Tarrytown, NY, USA). Using the American Diabetes Association criteria [24], T2D was defined as one of the following conditions; FBG ≥ 126 mg/dL or HbA1c ≥ 6.5%, history of diabetes diagnosed by a physician or current use of blood glucose-lowering medications, or 2h-PG ≥ 200 mg/dL from the oral glucose tolerance test. Furthermore, glycemic traits in this study were presented in continuous models as secondary outcomes in the MR; FBG (mg/dL), 2h-PG (mg/dL), and HbA1c (%) profiles.
Genotyping
DNA extraction, genotyping, and imputation were conducted by the Korea National Research Institute of Health, Centers for Disease Control and Prevention and the Ministry of Health and Welfare, Korea. Affymetrix Genome-Wide Human single nucleotide polymorphism (SNP) Array 5.0 (Affymetrix, Santa Clara, CA, USA) was used for genotyping DNA samples extracted from the peripheral blood of participants. The Bayesian robust linear model (Mahalanobis distance genotyping algorithm) was used for genotype calling [25], and imputation for non-typed or missing genotypes was achieved using IMPUTE v246 with 1,000 genomes data [26]. Overall, 500,568 SNPs were identified in the genotype calling, but 352,228 SNPs remained after control filtering [27]. Minutiae of these methods and quality control have been reported elsewhere [25262728].
Statistical analysis
We previously identified five SNPs related to habitual coffee consumption in a GWAS using linear regression adjusting for age in years, sex and alcohol consumption in g/day in a continuous model. Log-transformed cups per day of coffee consumption was applied as a continuous outcome in the multivariable-adjusted model, in which SNPs were included as independent variables. When the GWAS was conducted for caffeine consumption in a continuous box-cox transformed linear model, SNPs identified for caffeine consumption were the same as those identified for coffee consumption. A statistical threshold of P < 1 × 10⁻⁵ was considered significant for the selected SNPs. Details of the Manhattan plots, quantile-quantile plots, the inflation factor, regional association plots of the SNPs that reached the statistical threshold, linkage equilibrium of the significant genetic variants and how the genetic risk score (GRS) was calculated in the GWAS have been detailed elsewhere [22].
The GRS was calculated by multiplying each weighted beta (β) coefficient of 5 SNPs associated with habitual coffee consumption by the number of corresponding minor alleles (0, 1, 2); the GRS = 5 × (β1 × SNP1 + β2 × SNP2 + β3 × SNP3 + β4 × SNP4 + β5 × SNP5)/(β1 + β2 + β3 + β4 + β5) [29]. The presence of minor allele was associated with increased habitual coffee consumption in our GWAS study. We tested the strength of the instrumental variable for the prediction of coffee consumption using F statistics, and the F values range was 24.2–33.8 for FBG, 2h-PG and HbA1c profiles.
To estimate the β-coefficient and SE of SNPs with log-transformed cups/day for coffee consumption, we used linear regression models adjusted for age (yr), sex, and alcohol consumption (g/day). Eighteen SNPs on chromosome 12q24 were identified in the multivariable-adjusted models (P < 1 × 10⁻⁵). In selecting SNPs for the GRS, pairwise correlations were applied to eliminate all imputed SNPs having a high correlation (r2 > 0.8) with genotyped SNPs. Also, SNPs were selected among strongly-correlated genotyped SNPs. Three genotyped SNPs (rs2074356, rs11066015, and rs12229654) and two imputed (rs11066015 and rs79105258) with minor allele frequencies range of 0.143 to 0.172 were identified in this population. For our primary outcome –T2D (no or yes), logistic regression (adjusting for age in years continuous, sex and alcohol consumption in g/day continuous) was used to calculate the β-coefficient and SE of the identified SNPs. For the glycemic traits, linear regression (adjusting for age in years continuous, sex and alcohol consumption in g/day continuous) was used to estimate the β-coefficients and SEs of SNPs with the raw concentrations of FBG (mg/dL), 2h-PG (mg/dL) and HbA1c (%).
MR inverse-variance-weighted (IVW) method was used to assess causal relations between genetically predicted coffee consumption and T2D or glycemic traits [30]. β-coefficients and SEs from the data where SNP and coffee consumption were treated as an independent variable and dependent variable, respectively, were applied to compute the Wald estimates and the SEs of the Wald estimates using the delta method [31], assuming a fixed effect model in the individual-level data [32]. Forest plots were used to visualize the associations of genetically predicted coffee consumption with T2D and glycemic traits at individual and pooled levels. In addition, MR-weighted median [30] and mode [33] methods were applied, and the degree of heterogeneity of the associations among 5 genetic variants was assessed to evaluate the robustness of the association. MR-Egger intercept and MR-Egger regression were applied to assess and adjust for directional and unbalanced pleiotropy of identified SNP in the MR analysis [34]. Because MR techniques are susceptible to pleiotropic effects, we used the MR-Pleitropy RESidual and Outlier methods (PRESSO) to assess and correct for horizontal pleiotropic outliers [35]. In the MR-PRESSO global test, we tested whether there was horizontal pleiotropy by alcohol consumption [35]. Scatter plots of the four MR methods (IVW, weighted median, weighted mode, and MR-Egger methods) were used to visualize and compare the methods. For glycemic traits, we also examined the associations between genetically predicted coffee consumption and glycemic traits using the two-stage least square technique. Using the GRS as an instrument variable, MR analyses were performed to examine the associations of genetically predicted coffee consumption with T2D and glycemic traits; Wald estimates for T2D and glycemic traits, and 2-stage least squares estimates for glycemic traits only. All statistical analysis was carried out using SAS software (version 9.4; SAS Institute Inc., Cary, NC, USA) and R software (version 4.1.2; R Foundation for Statistical Computing, Vienna, Austria).
RESULTS
Genetic variants related to coffee consumption
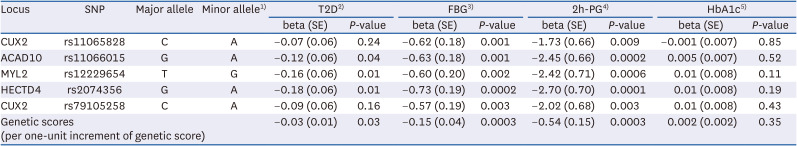
We previously identified 5 independent genomic loci associated with a unit increment of log-transformed coffee consumption (cups/day); rs11065828 in CUX2, rs11066015 in ACAD10, rs12229654 in MYL2, rs2074356 in HECTD4, and rs79105258 in CUX2. The strongest loci was rs2074356 within the HECTD4 gene (P = 6.62 × 10⁻⁸), and the weakest loci was rs11066015 in ACAD10 gene (P = 7.79 × 10⁻⁶) [22]. The GRS calculated from 5 SNPs in an additive model presented a significant association with T2D, FBG, and 2h-PG (Table 1). However, the GRS was not associated with HbA1c levels.
Table 1
Characteristics of SNPs associated with coffee consumption from GWAS in the KARE data (P < 1 × 10⁻⁸) and regression coefficients (SE) of SNPs with type 2 diabetes and glycemic traits
All models were adjusted for age (yr, continuous), sex (men, women), and alcohol consumption (g/day, continuous).
SNP, single nucleotide polymorphism; GWAS, genome-wide association studies; KARE, Korea Association REsource; T2D, type 2 diabetes; FBG, fasting blood glucose; 2h-PG, 2h-postprandial glucose; HbA1c, haemoglobin A1c.
1)Genotypes coded as 0, 1 or 2, counting the number of the minor allele.
2)Association of SNPs (additive) or the genetic risk scores (per one-unit increment of genetic risk score) with T2D in the logistic regression model.
3)Association of SNPs (additive) or the genetic risk scores (per one-unit increment of genetic risk score) with fasting blood glucose – FBG (per an increment of 1 mg/dL) in the linear regression model.
4)Association of SNPs (additive) or the genetic risk scores (per one-unit increment of genetic risk score) with 2h-postprandial glucose (per an increment of 1 mg/dL) in the linear regression model.
5)Association of SNPs (additive) or the genetic risk scores (per one-unit increment of genetic risk score) with HbA1c (per an increment of 1%) in the linear regression model.
We examined the distribution of the GRS and each SNP according to the potential confounding factors and found no association with age (years in continuous; Spearman’s r = 0.02 and P = 0.17 for the GRS, Spearman’s r = 0.01 and P = 0.46 for rs79105258, Spearman’s r = 0.02 and P = 0.09 for rs2074356, Spearman’s r = 0.02 and P = 0.07 for rs12229654, Spearman’s r = 0.01 and P = 0.31 for rs11066015, and Spearman’s r = 0.01 and P = 0.23 for rs11065828), sex (t-test P = 0.49 for the GRS, P = 0.88 for rs79105258, P = 0.45 for rs2074356, P = 0.26 for rs12229654, P = 0.11 for rs11066015, and P = 0.72 for rs11065828), BMI (kg/m2 in continuous; Spearman’s r = −0.01 and P = 0.22 for the GRS, Spearman’s r = −0.02 and P = 0.07 for rs79105258, Spearman’s r = −0.02 and P = 0.08 for rs2074356, Spearman’s r = −0.02 and P = 0.04 for rs12229654, Spearman’s r = −0.01 and P = 0.22 for rs11066015, and Spearman’s r = −0.005 and P = 0.68 for rs11065828), or smoking status (never, past, current smokers; analysis of variance [ANOVA]; P = 0.39 for the GRS, P = 0.59 for rs79105258, P = 0.21 for rs2074356, P = 0.10 for rs12229654, P = 0.23 for rs11066015, and P = 0.41 for rs11065828). However, the GRS and SNP were associated with alcohol drinking (never, past, and current drinkers; ANOVA P < 0.001 for the GRS and each SNP). We examined the distribution of each SNP according to the potential confounding factors and found a similar distribution with the genetic score except for the distribution of rs12229654 according to BMI (Spearman’s r = −0.02 and P = 0.04).
Genetically predicted coffee consumption and T2D
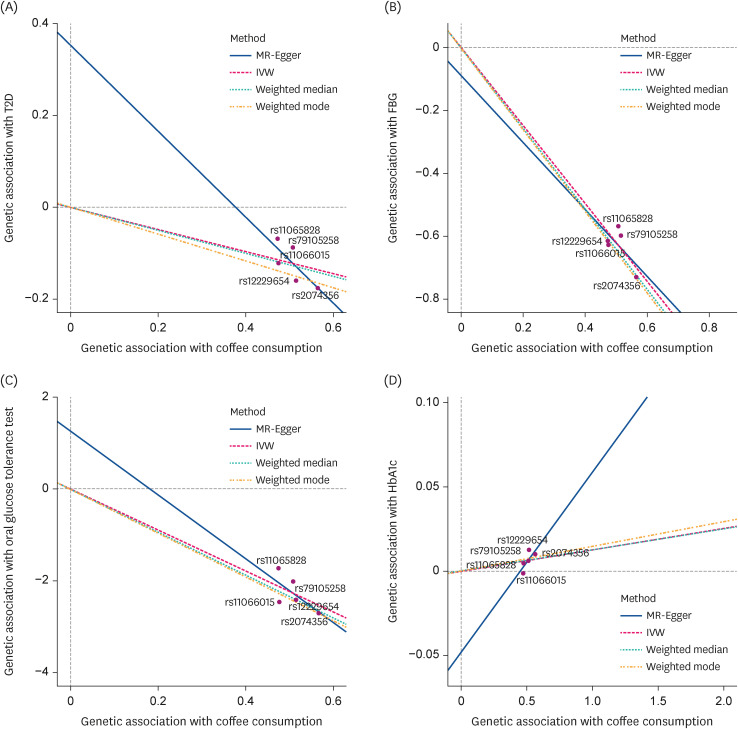
Mendelian randomization suggests that genetically predicted coffee consumption was associated with a lower T2D prevalence: odds ratio (OR), 0.79; 95% confidence interval (CI), 0.71–0.88 using the MR-IVW method (Table 2, Fig. 2). An analogous risk estimate was observed using the MR-weighted-median (OR, 0.78; 95% CI, 0.68–0.89) and MR-weighted-mode (OR, 0.75; 95% CI, 0.62–0.90) methods. The intercept (β = 0.35, SE = 0.43) of MR-Egger regression analysis suggested no indication of directional horizontal pleiotropy (P for intercept = 0.32). Furthermore, the scatter plots of the MR methods in the observational analysis suggested no virtual evidence of heterogeneity across variants or potential pleiotropy regarding T2D (Fig. 3A).
Table 2
Genetically predicted coffee consumption with type 2 diabetes
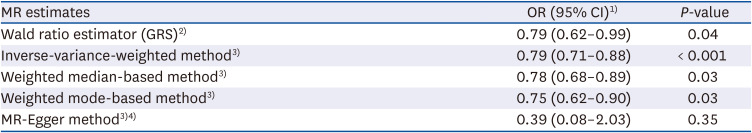
MR, Mendelian randomization; OR, odds ratio; CI, confidence interval; GRS, genetic risk score; SNP, single nucleotide polymorphism.
1)For one-unit increment of log-transformed cup per day of coffee consumption.
2)Estimated genetic risk score was included as an instrument variable.
3)Estimates for each 5 SNP are combined to yield an overall estimate.
4)Beta (SE) was 0.35 (0.43) and P for intercept = 0.32 in the MR-Egger regression.
Fig. 2
The Mendelian randomization estimate of coffee consumption with (A) T2D, (B) FBS, (C) 2h-PG, and (D) HbA1c using a fixed-effects model in the inverse-variance-weighted method.
T2D, type 2 diabetes; FBG, fasting blood glucose; 2h-PG, 2h-postprandial glucose; HbA1c, hemoglobin A1c; SNP, single nucleotide polymorphism; OR, odds ratio; CI, confidence interval.
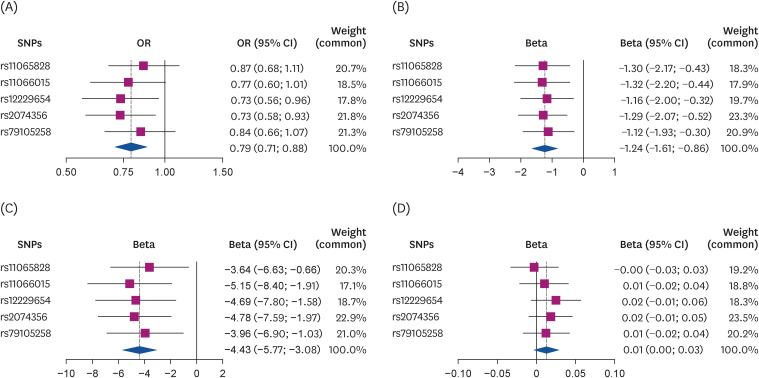
Fig. 3
Scatter plot of the MR methods. The x-axis represents the genetic association with coffee consumption; the y-axis represents the genetic association with type 2 diabetes and glucose traits. Each line represents a different MR method. (A) T2D, (B) FBS, (C) 2h-PG, and (D) HbA1c.
MR, Mendelian randomization; T2D, type 2 diabetes; FBG, fasting blood glucose; 2h-PG, 2h-postprandial glucose; HbA1c, hemoglobin A1c; IVW, inverse-variance-weighted.
Genetically predicted coffee consumption and glycemic traits
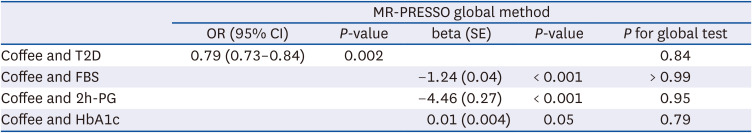
One-unit increment of log-transformed cups per day of genetically predicted coffee consumption was related to a decrease in FBG and 2h-PG levels in all methods except the MR-Egger method (Table 3, Fig. 2). For example, when the MR-IVW method was used, there was a 1.24 mg/dL decrease in FBG (β = −1.24, SE = 0.19, P < 0.001) and a 4.43 mg/dL diminution in 2h-PG (β = −4.43, SE = 1.40, P < 0.001). The intercept of MR-Egger regression analysis for FBG and 2h-PG suggested no indication of directional horizontal pleiotropy (P for intercept > 0.80). Genetically predicted coffee consumption was unrelated to HbA1c (β = 0.01, SE = 0.007, P = 0.07), and comparable estimates were observed for MR-weighted median and mode methods. Likewise, scatter plots of genetically predicted log-transformed coffee consumption (cups/day) with glycemic traits revealed similar findings; FBG (Fig. 3B), 2h-PG (Fig. 3C), and HbA1c (Fig. 3D). We observed similar results after examining the association using the MR-PRESSO global method (Table 4). MR-PRESSO global method revealed no evidence of directional horizontal pleiotropy (P for global test in the MR-PRESSO global method > 0.8).
Table 3
Genetically predicted coffee consumption with FBG, 2h-PG, and HbA1c
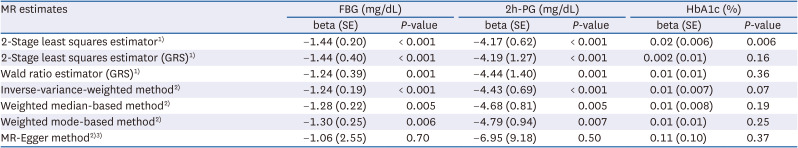
Coffee consumption was per 1 cup/day increment of log-transformed.
MR, Mendelian randomization; FBG, fasting blood glucose; 2h-PG, 2h-postprandial glucose; HbA1c, haemoglobin A1c; GRS, genetic risk score; SNP, single nucleotide polymorphism.
1)Estimated genetic risk score was included as an instrument variable.
2)Estimates for each 5 SNP are combined to yield an overall estimate.
3)Beta (SE) and P-values for the intercept in the MR-Egger regression were as follows; −0.09 (1.29) and P = 0.95 for fasting blood glucose; 1.27 (4.65) and P = 0.80 for 2h-PG; and −0.05 (0.05) and P = 0.42 for HbA1c.
Table 4
Genetically predicted coffee consumption with type 2 diabetes and glycemic traits: MR-PRESSO methods
DISCUSSION
We applied multiple MR methods with correction for pleiotropic effects and found that higher coffee consumption was causally associated with a lower T2D prevalence in this study. Similarly, higher coffee consumption was inversely associated with FBG and 2h-PG profiles in a dose-response manner. This study applied MR techniques to present evidence of the significance of coffee consumption in glucose metabolism among Asian populations.
Several prospective studies [223637], reviews [538394041], and randomized trials [1112] have studied the coffee consumption-T2D relationship without genetic evidence to support causal relationships. Earlier, MR studies on this subject have been reported in the Copenhagen General Population and City Heart Studies [42], Social Science Genetic Association Consortium [43], and UK biobank [164445] among European descents, but none has been reported among Asian descents. These studies presented genetic evidence to support null association [42434445], except for Wang et al. [16]. In that study, genetically predicted ground coffee consumption only (but not total or decaffeinated) was associated with a decreased risk of T2D. Similarly, a review of MR studies of genetically predicted coffee consumption in cardiometabolic outcomes concluded that higher coffee consumption was unrelated to T2D [46]. However, most of these studies were exclusively conducted among European descent, and genetic variants of coffee consumption in this population did not appear to differ geographically [47]. We hypothesize that these differences are likely related to the degree of exposure to coffee consumption. At least none of these studies has reported a genetically-causal association of deleterious risk for T2D. The absence of evidence does not necessarily imply the lack of evidence. In tandem with our observation, genetically proxied coffee consumption was associated with a low risk of gallstone diseases [48] and small vessel ischemic stroke [15] in European populations.
The pathophysiology of the inverse coffee consumption-T2D association can be explained in the following ways. First, coffee is a repository of phenolic compounds rich in antioxidant activity [4950], protective against inflammation [5152] and neurodegenerative diseases, including T2D, in some observational studies [5354], intervention trials [55], and reviews [505657]. Second, suppressed fat accumulation due to the inhibitive potential of quinic acids from phenols on the nuclear activity of sterol regulatory element-binding protein 1c, acetyl-CoA carboxylase activity, and cellular malonyl-CoA levels were reported in C57BL/6J mice on a high-fat diet supplemented with coffee-derived phenols [58].
Our findings should be contextualized in light of some empirical understanding. First, coffee consumption transformed into cups/day was used as an exposure without considering data on the types of coffee consumed and the additives used. Even though we did not distinguish the types of coffee, it is unlikely to bias our findings because several prospective studies have reported the inverse association between coffee consumption and T2D independent of coffee types [3841596061]. However, genetically predicted evidence in this regard is yet to be documented. Second, this study was exclusively conducted among Koreans. The vitality of multi-ancestral GWAS (including diverse Asian populations) cannot be underestimated in the reliability of MR analysis for robust associations between genetic variants and phenotypes.
Our study had some limitations and strengths. First, selecting unstable SNPs as instrumental variables cannot be ruled out. In order to overcome this, we used SNPs associated with coffee consumption in our study, and the multiple MR analysis method revealed consistent results. Second, MR methods are susceptible to pleiotropic effects, which can be either horizontal (pathways) [13] or vertical (involving multiple factors). Our study surmounted this limitation by conducting MR analysis using multiple complementary approaches. We used pleiotropy-detecting MR methods such as the MR-PRESSO to assess and correct for horizontal pleiotropy, and there was no evidence of direct horizontal pleiotropy in this study. Third, the applicability of our findings across diverse populations is quite limited as this study was exclusively among Koreans. Coffee consumption data was presented at a single time point, and the precise composition of different coffee types was unaccounted for in this study. Also, alcohol consumption correlated with genetic variants in this population and the exclusivity of coffee consumption in the reported association should be interpreted cautiously. However, correction for horizontal pleiotropy showed consistent results. We observed a statistically insignificant association between genetically predicted coffee consumption and HbA1c profiles. A rational explanation for this phenomenon is currently elusive, but further longitudinal studies and well-articulated intervention trials are necessary to clarify these findings.
In conclusion, our study revealed that genetically predicted coffee consumption was associated with a lower prevalence of T2D among Koreans. Future studies should be designed to discern the mechanistic pathophysiology of this association.
 XML Download