

 PDF
PDF Citation
 Print
Print


INTRODUCTION
Diabetes is a major cause of mortality and a health burden worldwide. The prevalence of diabetes in China increased from 2.5% in 1994 to 12.8% in 2019 [12]. Intrauterine and early-life malnutrition are potential risk factors for metabolic disorders in later life. Intrauterine growth restriction caused by malnutrition can lead to severe perinatal and long-term complications, such as the development of insulin resistance. A meta-analysis indicated that famine exposure during the fetal period and low birth weight increased the risk of obesity, diabetes, hypertension, and metabolic syndrome in adulthood [3456].
The Chinese Famine (1959–1961) was associated with a sharp decrease in grain production and 30 million excess deaths. Observational studies across China have shown that the prevalence of diabetes is higher among individuals exposed to famine than among those not exposed to famine [4]. On the other hand, a causal relationship has not been established. This study analyzed two observational studies from the Qingdao Diabetes Prevention Program to investigate the relationship between famine exposure in early life and type 2 diabetes in adulthood in China.
SUBJECTS AND METHODS
The survey protocols are described elsewhere [78]. Briefly, nondiabetic participants aged 35 to 74 years from a randomly selected community of two separate studies in 2006 and 2009 were invited to assess the relationship between famine exposure and diabetes risk over a three-year follow-up. The participants of each study did not overlap. After excluding participants with missing measurements, laboratory results, and other covariables, 3,418 participants were included for analysis. The Ethics Committee of Qingdao Centers for Disease Prevention and Control approved the studies (registration no. 20051008). Informed consent was obtained from all participants. The trial was registered at https://clinicaltrials.gov/ct2/home (registration no. NCT01053195).
Definition of type 2 diabetes and famine exposure
Type 2 diabetes was defined as a fasting plasma glucose (FPG) ≥ 7.0 mmol/L, 2-h plasma glucose (2hPG) ≥ 11.1 mmol/L, or self-reported diabetes as diagnosed by a professional physician during the follow-up for participants without diabetes at baseline. Famine exposure was determined according to the birth year and divided into four categories: fetal exposed (born between January 1, 1959, and December 31, 1961), child exposed (born between January 1, 1949, and December 31, 1958), adolescent/adult exposed (born between January 1, 1931, and December 31, 1948), and unexposed (born between January 1, 1962, and December 31, 1978).
Study parameters
The body mass index (BMI) was calculated as weight in kilograms divided by the square of height in meters. The income was classified as low (< RMB3000 [US$470] per month) or high (≥ RMB3000 [US$470] per month). The education level was classified as low or high according to the years enrolled in school. Physical activity was calculated as the metabolic equivalent and divided into three levels: sedentary, moderate, and vigorous.
Statistical analyses
Continuous variables were presented as the mean and standard deviation, and categorical variables as a number (percentage). A univariate general linear model adjusted for age was used to compare differences among the mean values of continuous variables and the χ2 test to compare categorical data between the four groups. Logistic regression analysis was used to estimate the relative risk (RR) and 95% confidence interval (CI) for determining the relationship between famine exposure and type 2 diabetes after adjusting for age, family history of diabetes, BMI, urbanization type, education level, income, occupation, total cholesterol, physical activity level, and hypertension, tobacco smoking, and alcohol consumption statuses at baseline. The unexposed group was used as a reference. The interaction effects of famine exposure and urbanization type, family history of diabetes, education level, income, and smoking and drinking statuses on type 2 diabetes were tested using a multiplicative factor in the logistic regression model [9]. The additive interactions between famine exposure and urbanization type or other potential factors for type 2 diabetes were estimated using the relative excess risk caused by the interaction obtained using the algorithm proposed by Andersson et al. [9]. Statistical analyses were performed using SPSS version 22.0 (IBM Corp., Armonk, NY, USA). The statistical significance was indicated by a two-sided P-value of < 0.05.
RESULTS
Participant characteristics
Table 1 lists the baseline characteristics of individuals in each famine exposure group. Compared to the unexposed group, the age-adjusted mean BMI, waist circumference, total cholesterol, FPG, and systolic and diastolic blood pressure were significantly greater in the three exposed groups (P < 0.05 for all comparisons). The education level, income, and physical activity differed significantly between the exposed groups (P < 0.05 for all comparisons). No differences in mean concentrations of 2hPG, triglycerides, and high-density lipoprotein cholesterol were observed between the groups.

Table 1
Baseline characteristics of the Qingdao diabetes study population according to famine exposure
Data are age-adjusted mean ± SE or number (%).
BMI, body mass index; HDL, high-density lipoprotein cholesterol.
1)n = 2,079, 2)n = 2,976.
![]()
Comparative analysis of famine exposure and type 2 diabetes by sex
During a three-year follow-up, 336 cases of type 2 diabetes were identified from two longitudinal studies. The age-adjusted incidence rates were 5.7%, 14.5%, 12.7%, and 17.8% in the unexposed, fetal-exposed, child-exposed, and adolescent/adult-exposed groups, respectively (P < 0.01). Relative to the nonexposed group, the RRs (95% CI) of type 2 diabetes were 2.15 (1.29–3.60), 1.53 (0.93–2.51), and 1.65 (0.75–3.63) in the fetal-exposed, child-exposed, and adolescent/adult-exposed groups after control for covariates (Table 2). Before adjusting for covariates, the relationship between famine exposure and diabetes differed significantly according to sex. After adjustment, however, the relationship between famine exposure and diabetes did not differ according to sex, except for the fetal-exposure group, in which the RR for women was 2.80 (1.50–5.21). This indicates that famine exposure in early life is an independent predictor of type 2 diabetes, particularly in women.
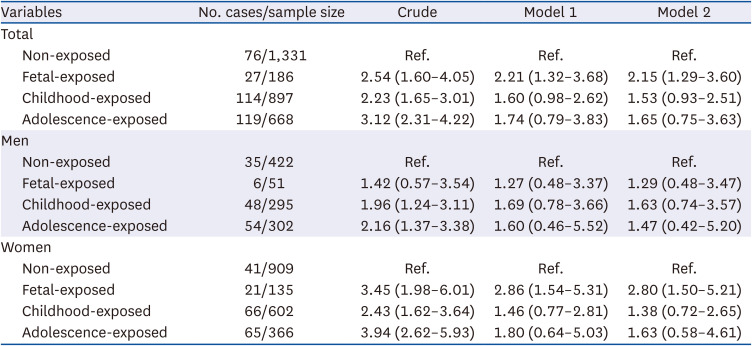
Table 2
Relative risk (95% confidence interval) of type 2 diabetes in relation to different life stages at famine exposure
Model 1: adjusted for age, family history of diabetes, body mass index, and residential areas.
Model 2: adjusted for age, family history of diabetes, body mass index, residential areas, educational level, income level, total cholesterol, occupation, hypertension, physical activity, smoking, and drinking status.
![]()
Comparative analysis of famine exposure and type 2 diabetes by residential areas
According to subgroup analysis, the incidence of diabetes was significantly higher among participants exposed to famine than among those not exposed to famine in rural but not urban areas. The corresponding figures were 4.7%, 15.2%, 11.7%, and 15.0% in rural areas (P = 0.001) and 7.7%, 4.1%, 10.0%, and 15.6% in urban areas (P = 0.530), respectively. As shown in Table 3, the multivariate-adjusted RRs (95% CI) for type 2 diabetes in the fetal-exposed, child-exposed, and adolescent/adult-exposed groups in rural areas were 3.36 (1.88–5.99), 2.06 (1.14–3.74), and 2.18 (0.84–5.65), respectively. The RRs in the fetal-exposed, child-exposed, and adolescent/adult-exposed groups in urban areas were 0.35 (0.08–1.62), 0.69 (0.27–1.76), and 0.79 (0.18–3.47), respectively. The risk of diabetes was not substantially different when the waist circumference or waist-to-hip ratio was used instead of the BMI in separate multivariable models. The interactions among famine exposure and obesity, education level, and family history of diabetes were not observed except when adjusting for urbanization type. The risk of type 2 diabetes was higher among participants living in rural areas in the fetal-exposed and child-exposed groups, with increased RRs (95% CIs) of 8.79 (1.82–42.54) and 2.33 (1.17–4.65), respectively.
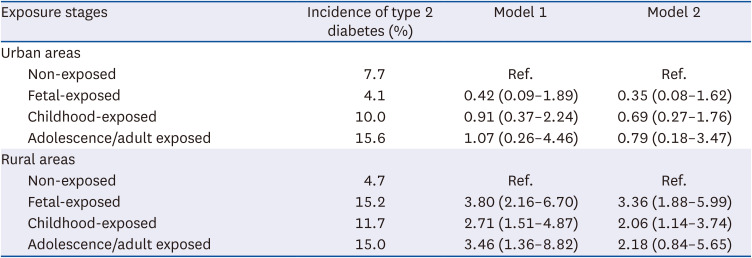
Table 3
Relative risk (95% confidence interval) of type 2 diabetes in urban and rural areas
Model 1: Adjusted for age and sex.
Model 2: Adjusted for age, sex, family history of diabetes, residential areas, occupation, body mass index, total cholesterol, hypertension, educational level, income level, leisure time, physical activity, smoking, and drinking status.
![]()
Age effect on the association between famine exposure and type 2 diabetes
Age was an independent risk factor for type 2 diabetes. To reduce the effects of age and urbanization type, the association between famine exposure and type 2 diabetes in a sensitivity analysis was further investigated. As shown in Table 4, famine exposure in the fetal stage was significantly associated with type 2 diabetes later in life in subgroup analysis in which the participants were divided by age into three-year intervals. The relationship between famine exposure and diabetes in the fetal-exposed group was robust in the age-adjusted multivariate model, with a corresponding RR of 1.82 (1.04–3.18). The sex-adjusted model revealed a RR for women of 2.51 (1.27–4.98) in the fetal-exposed group (Supplementary Table 1). The relationship between famine exposure and diabetes was moderate in men based on three-year intervals. Participants in the fetal-exposed group had a significantly younger mean age than did the child-exposed, adolescent/adult-exposed, and unexposed groups combined (47.9 vs. 51.2 years, P < 0.05). The RR (95% CI) of type 2 diabetes in the fetal-exposed group was 1.74 (1.12–2.69) compared with the child-exposed, adolescent/adult-exposed, and unexposed groups. Stratified by urbanization type, the fetal-exposed group had a younger mean age than the other groups combined in both urban and rural areas (48.5 vs. 51.7 years in urban areas, P < 0.05; 47.7 vs. 51.0 years in rural areas, P < 0.05), and the corresponding RRs (95% CI) were 0.41 (0.10–1.75) in urban areas and 2.34 (1.46–3.75) in rural areas.
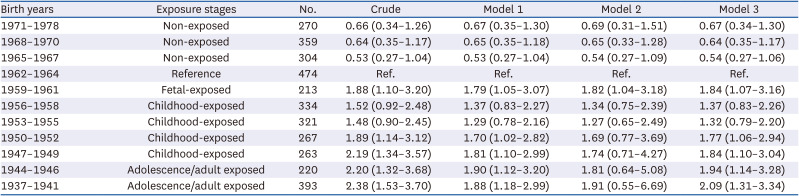
Table 4
Relative risk (95% confidence interval) of type 2 diabetes in relation to three years intervals at famine exposure (n = 3,418)
Model 1: adjusted for sex, family history of diabetes, residential areas, educational level, income level, occupation, total cholesterol, hypertension, physical activity, smoking, and drinking status.
Model 2: Model 1 plus age and body mass index.
Model 3: Model 2 without age.
![]()
DISCUSSION
These findings indicate that famine exposure in the fetal stage is an independent predictor of type 2 diabetes in later life, particularly for women. Individuals living in rural areas with famine exposure in early life (fetal stage or childhood) are at an increased risk of type 2 diabetes.
According to a sensitivity analysis, the risk of type 2 diabetes was higher among participants with famine exposure in the fetal stage but not higher among those with famine exposure in the adolescent/adult stage. Several observational studies have shown that prenatal famine exposure is associated with the prevalence of type 2 diabetes. The odds ratios were 1.22 and 2.20 for individuals with prenatal famine exposure and those without famine exposure, respectively [1011]. A meta-analysis found that individuals with famine exposure in the fetal stage had a 36% higher risk of type 2 diabetes than those without famine exposure [4]. The pooled RRs (95% CIs) were 1.36 (1.12–1.65) and 1.40 (0.98–1.99), respectively. Moreover, a study including 88,830 participants with a median follow-up of 7.3 years showed that exposure to the Chinese Famine in the fetal stage was associated with a 25% increased risk of type 2 diabetes in adulthood [12]. The prevalence of type 2 diabetes was higher in rural than urban areas, as mentioned previously. The relationships between famine exposure and BMI and height were weaker in urban areas than in rural areas. This may explain the region-specific differences in the relationship between famine exposure and type 2 diabetes in the current study.
This study showed that the association between famine exposure and diabetes is significantly stronger in women than men. On the other hand, sex-specific analyses showed that the association between famine exposure and diabetes was similar for men and women [1314]. Several studies have also confirmed that sex differences in hormones, body composition, glucose and fat metabolism, reproduction, and some sex-dimorphic mechanisms affect the risk of type 2 diabetes. A recent meta-analysis including 18 cross-sectional or historical studies demonstrated a significant association between malnutrition in early life and obesity in women but not in men [15]. Experimental studies have also showed that the mechanisms of fetal programming on insulin resistance and insulin secretion contribute to sex differences in glucose tolerance [1617]. Inconsistent results were observed in the China health and retirement longitudinal study, suggesting that men are more vulnerable than women to the adverse effects of famine exposure in the fetal stage [1819]. The sex disparity in the association between famine exposure and type 2 diabetes requires further investigation.
The underlying mechanism by which famine exposure leads to type 2 diabetes is uncertain. The thrifty phenotype hypothesis suggests that famine exposure in early life, including reduced capacity for insulin secretion and insulin resistance, combined with the effects of obesity, aging, and physical inactivity in adulthood, are the primary risk factors for type 2 diabetes [20]. For example, the Dutch Winter Families study showed that adults exposed to famine in the fetal stage were more insulin resistant than those not exposed to famine. Another hypothesis is that DNA methylation is caused by prenatal famine exposure and that these changes depend on the gestational timing of exposure [2122]. A genome-wide mediation analysis showed that DNA methylation mediated the association of prenatal famine exposure with adult BMI and triglycerides but not with the fasting glucose concentrations [22]. This suggests that epigenetic mechanisms mediate the association between prenatal famine exposure and metabolic health later in life.
The strengths of this study were the large sizes of the random representative samples from the general population. Individuals with known and newly diagnosed diabetes at the baseline were excluded to eliminate bias. All interviews were conducted face-to-face by professional health workers, and anthropometric measurements were conducted on-site. On the other hand, the present study has several limitations. Follow-up with some participants failed owing to extensive urban construction, housing demolition, and relocation. The baseline anthropometric and laboratory measurements between follow-up and lost-to-follow-up participants were compared. The mean waist circumference, diastolic blood pressure, total cholesterol, triglycerides, FPG, and 2hPG were greater in the lost-to-follow-up group than in the followed-up group (P < 0.05). Age, BMI, and systolic blood pressure were comparable between the two groups. The Chinese Famine affected almost everyone living in Qingdao. Therefore, individuals exposed to famine could be matched with anyone not exposed. Age was part of the analysis, but individuals exposed to famine could not be compared with those not exposed to famine of similar age. Classification bias may exist whereby the incidence of type 2 diabetes increases with age. Therefore, participants into groups were divided according to age by three-year intervals to reduce the effects of age on diabetes incidence. The association between famine exposure and diabetes was robust, according to a sensitivity analysis. The current findings may not be generalizable to other regions of China. Further nationally representative studies will be needed to investigate the association.
In conclusion, this study elucidated the association between famine exposure and type 2 diabetes using a population-based prospective study. Fetal but not adolescent famine exposure increased the risk of diabetes later in life. Appropriate nutrition and lifestyle in early life may be beneficial in preventing metabolic disorders later in life.
 XML Download