

 PDF
PDF Citation
 Print
Print


INTRODUCTION
Healthy eating habits and a well-balanced diet are necessary to support active growth and development during childhood [1]. Eating habits are established during childhood and affect health in later life [234]. To ensure a healthy diet for healthy growth, an accurate analysis of the amount of meals and the nutrient intake of children should be determined [56]. One study identified foods that contribute to nutrient intake to determine the main causes of nutrient deficiency and excess in children [7]. A large-scale cohort study conducted in Northern Europe showed that a higher protein intake in infancy and early childhood was convincingly linked to an increased growth rate and a higher risk of adult obesity, but the evidence was limited when it came to bone variables [6].
A food frequency questionnaire (FFQ) is a useful tool for estimating food and nutrient intake and has been widely used to investigate the relationship between diet and disease [89101112]. It is important to extract and use representative foods when creating a limited question item because the questionnaire should evaluate the individual’s actual food and nutrient intake as close as possible to the item [13]. Moreover, when developing an FFQ, it is necessary to consider the differences in food and nutrient intake depending on the age group [14].
The Korea National Health and Nutrition Examination Survey (KNHANES) includes an FFQ survey along with a daily dietary intake assessed by a 24-h dietary recall to calculate national statistical data on the food and nutritional intake levels of the Korean population and to prepare evidence for establishing and evaluating nutritional policies. The 24-h daily recall survey is conducted for the population of age 1 yr and above, but the FFQ survey is conducted only in adults aged 19 to 64 [15]. FFQs developed for elementary school students are scarce compared to those developed for adults.
Consumption patterns can be influenced by various factors besides age, such as cultural, ethnic, environmental, and geographical differences [1617181920], so it is critical that FFQs are tailored for the population and outcome of interest because of differences in staple foods, availability of food items, and representative items. While FFQs have been developed for elementary school children in different countries [212223], they are ill-suited for elementary school children living in Korea due to the large differences between the food cultures of Korea and other countries [2425].
Only a brief version of the FFQ has been developed for Korean elementary school children. Even this brief version of the FFQ is focused on the dietary intake of specific foods (e.g., fruit and vegetable) [26]. In order to explore the health effects of diet in elementary school children in Korea, a comprehensive dietary assessment tool for estimating their usual dietary intake is needed. Therefore, the purpose of this study is to develop a semi-quantitative FFQ for a comprehensive assessment of dietary intake in Korean elementary school children aged 6 to 11 using a data-based approach.
SUBJECTS AND METHODS
Data source
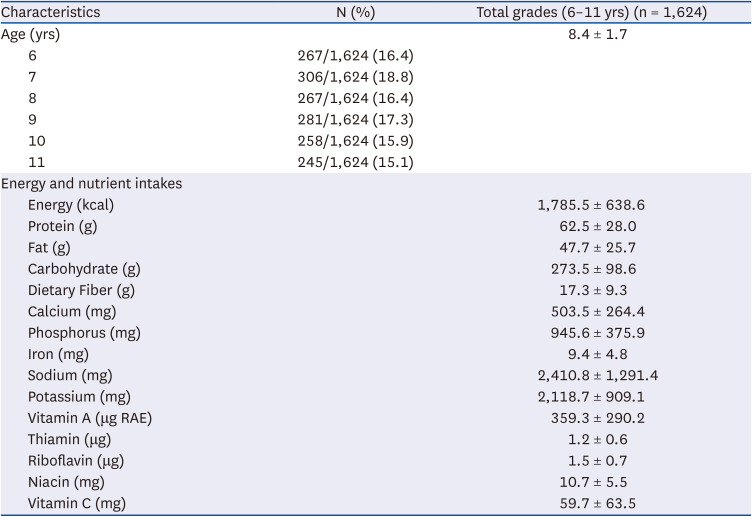
The FFQ developed in this study used data from 1,624 elementary school children aged 6 to 11 who had completed 24-h dietary recall survey in the 2016–2018 KNHANES. The average age and nutrient intake of elementary school students as subjects of the study are presented in Table 1. When developing an FFQ, it is common to use data from the year just before the start of the study, but the data prior to the year (2019−2021) we conducted this study corresponded to the periods of coronavirus disease 2019 (COVID-19) [27]. Due to the specific situations during this period, such as changes in school rules and the non-operation of school meals, we decided to use data before COVID-19 [2829]. The KNHANES is a nationally representative, cross-sectional survey that consists of 3 sections: health examination, health interview, and nutrition survey. More information about the survey can be found on the KNHANES website (http://knhanes.cdc.go.kr). This study was approved by the Institutional Review Board of Ewha Womans University (ewha-202206-0017-01). Approval was waivered for data for the first and second years (2016, 2017) and granted for the third year data (2018) under approval number 2018-01-03-P-A. All participants provided written informed consent.
Table 1
Characteristics of Korean elementary school students in 24-h recall data from the seventh (2016−2018) Korea National Health and Nutrition Examination Survey
Selection of FFQ dish items
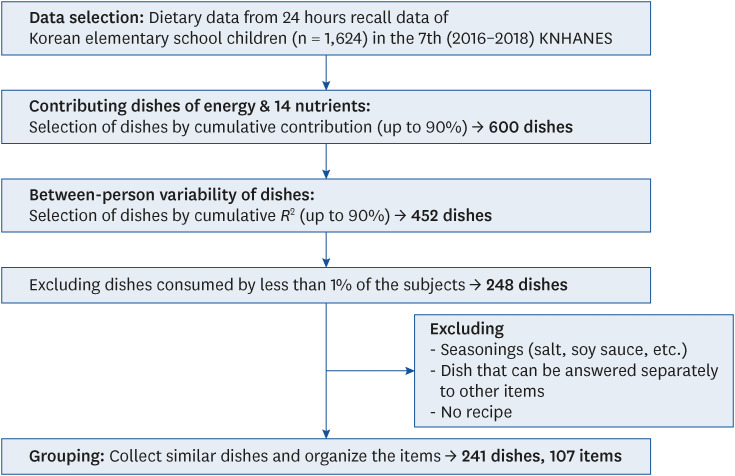
The items were selected based on 2,191 dishes (1,166 dishes without source numbers) consumed by elementary school children according to 24-h recall data. We analyzed the contribution of each dish for energy and 14 nutrients (protein, fat, carbohydrate, total dietary fiber, calcium, phosphorus, iron, sodium, potassium, vitamin A, thiamin, riboflavin, niacin, and vitamin C). Dishes that cumulatively contributed at least 90% to intakes for energy and 14 nutrients were included. Then, stepwise multiple regression was performed to explain between-person variations, thus excluding more than 90% of the cumulative R2. Next, we excluded dishes consumed by less than 1% of 1,624 subjects. Therefore, inappropriate dishes (e.g., salt, a dish that can be answered separately to other items, no recipe) were excluded through grouping. Lastly, the final items and dishes were listed by collecting similar items and excluding some inappropriate dishes (Fig. 1).
Selection of intake frequency and portion size
The frequency response was based on reviewing the frequency intervals used in the FFQ survey and presenting the frequency intervals divided into months, weeks, and days. Then, for the standard amount of each dish, the book Food and Dish Real Photography (2015.12) published by the Korean Genome and Epidemiology Study, the KNHANES FFQ for adults [15], and commercial products were referenced. In addition, we used Block’s instrument (1: small = [standard amounts] × 0.5; 2: medium = [standard amounts] × 1.0; 3: large = [standard amounts] × 1.5) [30] to calculate the portion size.
Recipe and nutrient database
The recipe was summarized by referring to the KNHANES Food Ingredients by Dish, 24-h recall data, and the recipe database of the computer-aided nutritional analysis program (CAN-pro). The nutrient database was created using the Korean Food Composition Database (revision 9.1, 2019) produced and provided by the Korea Rural Development Administration (Jeonju, Korea). The database reports vitamin A in units of RAE, but we recalculated and used the values with retinol and β-carotene. Furthermore, the recipe was collected according to each dish code, and the recipe per item was listed by calculating the ingredient ratio for each dish. In addition, a nutrient database was created by applying the portion size and unit criteria for each item to the recipe.
Statistical analysis
The Statistical Analysis System program (version 9.4; SAS Institute, Cary, NC, USA) was used for between-person variations, the second step of the item selection process. It was also used to determine the portion size and organize the nutrient database. Stepwise multiple linear regression was performed for between-person variations, and the portion size was determined by comparing mode and median values of the dish intake by elementary school children. When organizing the nutrient database, the program was used to connect nutrients by food, dish, and item units.
RESULTS
Dish-based approach
This study used dish codes instead of food codes for the FFQ item selection process. A selection based on food codes results in a higher percentage coverage of FFQ items than a selection based on dish codes (Supplementary Table 1). However, 24-h recall data often lists various foods within the dish because the subject does not use a specific recipe for cooking the dish. Therefore, the food code-based dishes are insufficient because the FFQ items consumed by elementary school children have to capture intakes of a wide range of energy and nutrients. Furthermore, food code-based dishes include many not commonly eaten by elementary school children (e.g., various vegetables [namul], duck soup). In addition, dishes are often extracted by the seasonings, not the main ingredients of the recipe (e.g., red chili pepper flake + sugar + salt + sesame oil + and other seasonings → fresh cucumber salad). Therefore, we decided that the dish code was better than the food code for the item selection process.
KNHANES assigns a 5-digit dish identification code that includes the food source (1: direct investigated cooking contents, 2: industry meals, 3: elementary school meals, 4: food at restaurants, 7: home meals, 8: middle and high school meals). However, it seemed that the use of a code (4 digits) without a source number could consider the possibility of multiple sources in one dish during the item selection process based on dish code. In some cases, consumption of some dishes was observed only in the lower or higher grades of elementary school children. Therefore, it seemed better to use total age grades to improve the diversity of dishes within the item. Accordingly, the subject of the survey was decided to represent all grades, and it was decided to use a 4-digit dish code in the item selection process, excluding the source (Supplementary Table 2).
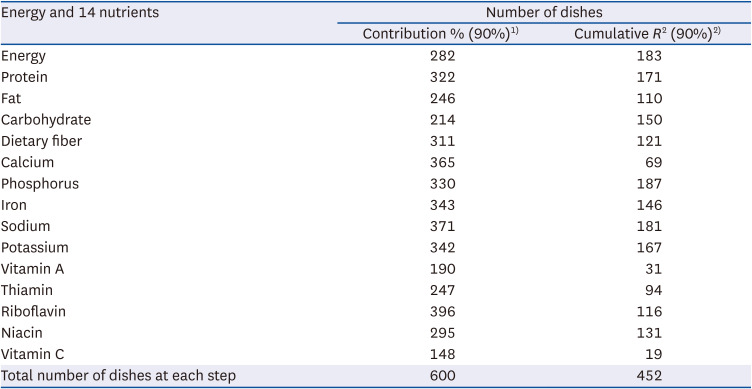
Table 2 shows the number of dishes by energy value and 14 nutrients extracted from the cumulative contribution of nutrients and between-person variations step in the item selection process. In the cumulative contribution of nutrients step, 600 dishes were extracted. In the next step, cumulative R2, 452 dishes were extracted.
Table 2
Number of dishes extracted from cumulative contribution of nutrients and between-person variation listed by energy and 14 nutrients
Nutrient contribution
Table 3 shows the top 10 dishes among the 600 dishes in the cumulative contribution of nutrients step consumed by elementary school students based on energy value and 14 nutrients. Most of this contribution came from milk (10 times), steamed multigrain rice (10 times), steamed rice (9 times), and cereal (9 times).
Table 3
Top 10 dishes of nutrient contribution and cumulative R2 in total grades of elementary school children listed by energy and 14 nutrients
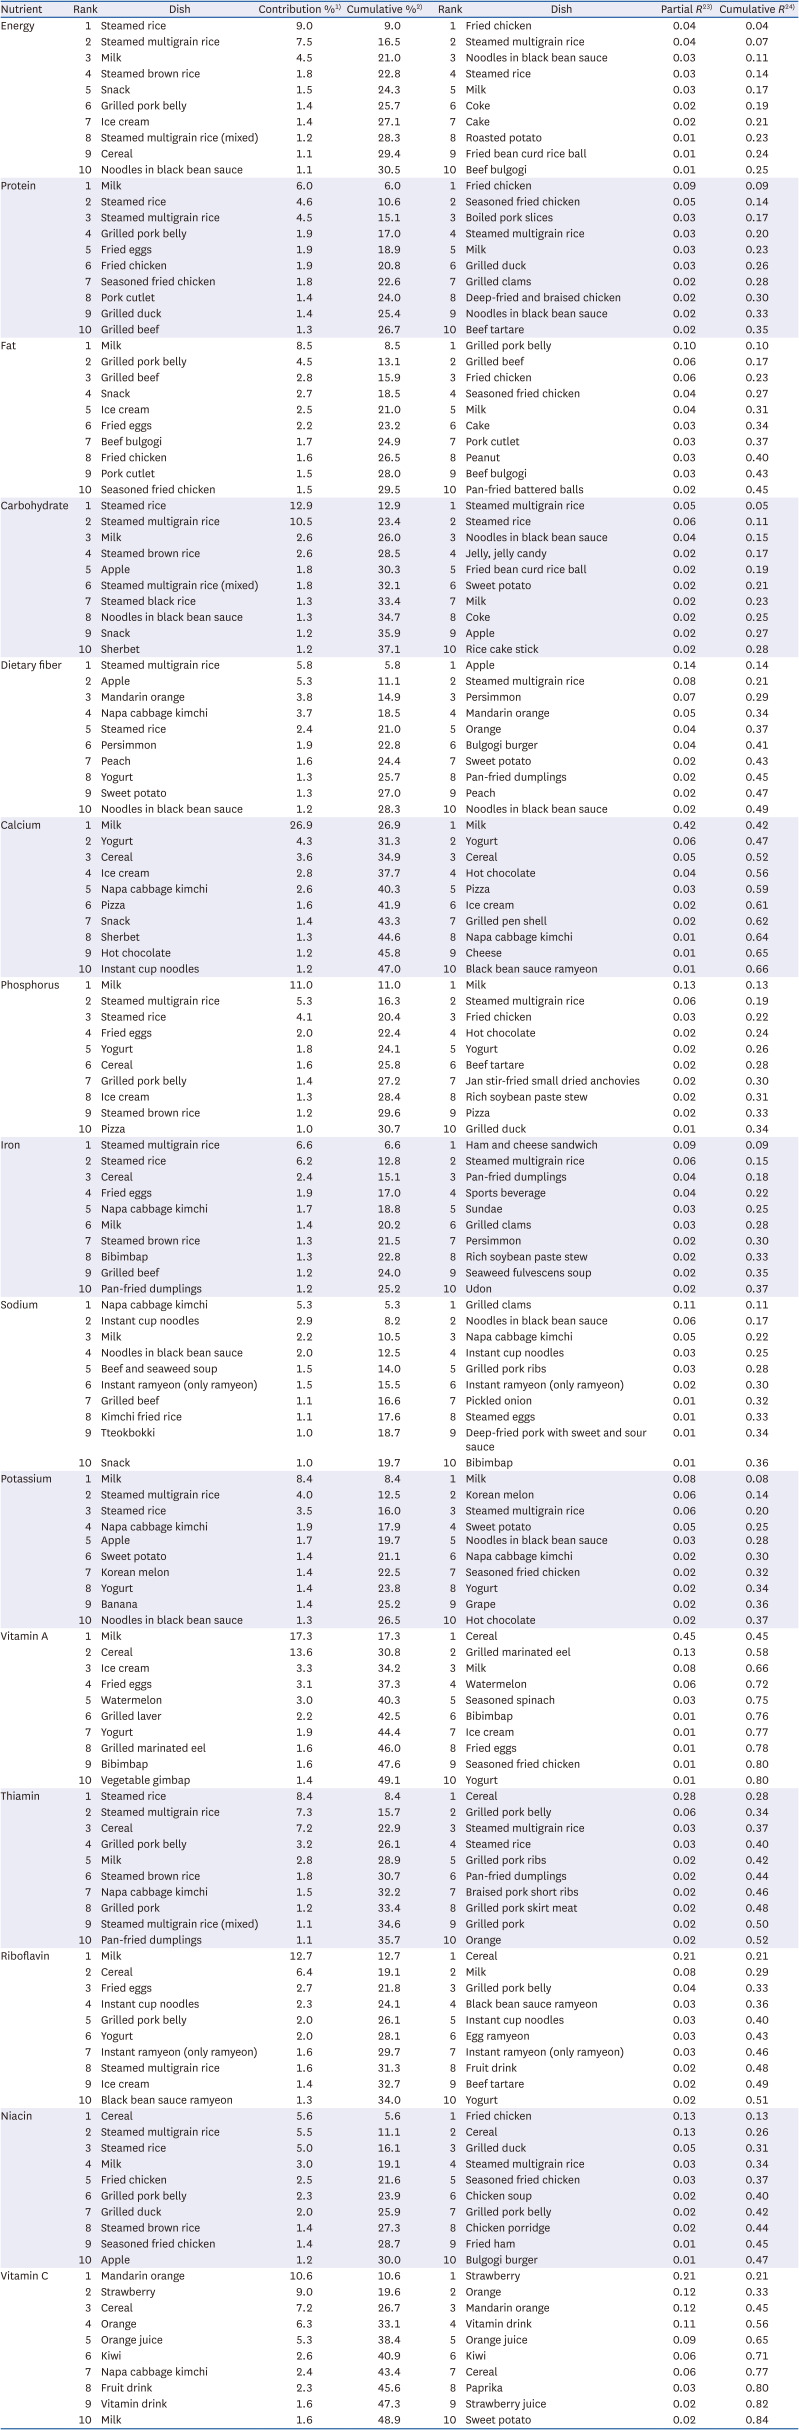
Between-person variations
Multiple regression analysis was conducted by setting the dependent variable as “personal 1-day energy & nutrients intake” in basic database and the independent variable as “total energy & nutrients intake in each dish by ID” in 24-h recall data. Among the 452 dishes remaining at this step, the top 10 dishes with cumulative R2 up to 90% for energy and 14 nutrients are shown in Table 3. Steamed multigrain rice (9 times) and milk (9 times) were ranked at the top, followed by noodles in black bean sauce (6 times) and cereal (6 times).
Grouping of FFQ items
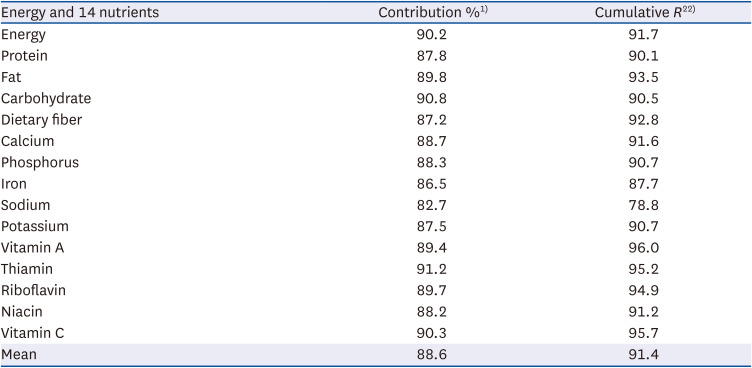
The final item and dish lists were composed of only the dishes used in the item selection (248 dishes). Therefore, the final FFQ consisted of 13 groups and 107 items (Table 4). At first, it was difficult to distinguish the group of each item because the dishes comprised several foods. Thus, we tried to list the items without mentioning them, but we presented them in groups so that elementary school children could see them at a glance. As a result, the percentage of cumulative contribution and cumulative R2 of our final item list for energy and 14 nutrients are shown in Table 5. The average cumulative contribution percentage was 88.6% (82.7−91.2%), and the average cumulative R2 was 91.4% (78.8−96.0%).
Table 4
Final items and group list of food frequency questionnaire for Korean elementary school students
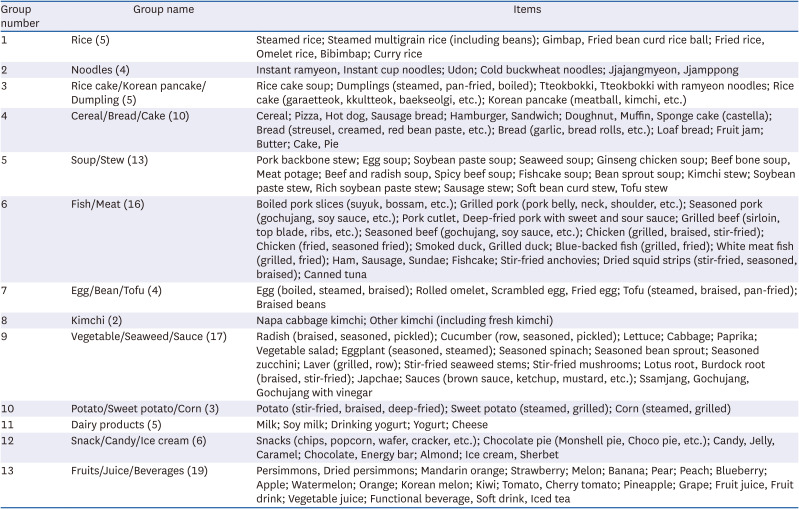
| Group number | Group name | Items |
|---|---|---|
| 1 | Rice (5) | Steamed rice; Steamed multigrain rice (including beans); Gimbap, Fried bean curd rice ball; Fried rice, Omelet rice, Bibimbap; Curry rice |
| 2 | Noodles (4) | Instant ramyeon, Instant cup noodles; Udon; Cold buckwheat noodles; Jjajangmyeon, Jjamppong |
| 3 | Rice cake/Korean pancake/Dumpling (5) | Rice cake soup; Dumplings (steamed, pan-fried, boiled); Tteokbokki, Tteokbokki with ramyeon noodles; Rice cake (garaetteok, kkultteok, baekseolgi, etc.); Korean pancake (meatball, kimchi, etc.) |
| 4 | Cereal/Bread/Cake (10) | Cereal; Pizza, Hot dog, Sausage bread; Hamburger, Sandwich; Doughnut, Muffin, Sponge cake (castella); Bread (streusel, creamed, red bean paste, etc.); Bread (garlic, bread rolls, etc.); Loaf bread; Fruit jam; Butter; Cake, Pie |
| 5 | Soup/Stew (13) | Pork backbone stew; Egg soup; Soybean paste soup; Seaweed soup; Ginseng chicken soup; Beef bone soup, Meat potage; Beef and radish soup, Spicy beef soup; Fishcake soup; Bean sprout soup; Kimchi stew; Soybean paste stew, Rich soybean paste stew; Sausage stew; Soft bean curd stew, Tofu stew |
| 6 | Fish/Meat (16) | Boiled pork slices (suyuk, bossam, etc.); Grilled pork (pork belly, neck, shoulder, etc.); Seasoned pork (gochujang, soy sauce, etc.); Pork cutlet, Deep-fried pork with sweet and sour sauce; Grilled beef (sirloin, top blade, ribs, etc.); Seasoned beef (gochujang, soy sauce, etc.); Chicken (grilled, braised, stir-fried); Chicken (fried, seasoned fried); Smoked duck, Grilled duck; Blue-backed fish (grilled, fried); White meat fish (grilled, fried); Ham, Sausage, Sundae; Fishcake; Stir-fried anchovies; Dried squid strips (stir-fried, seasoned, braised); Canned tuna |
| 7 | Egg/Bean/Tofu (4) | Egg (boiled, steamed, braised); Rolled omelet, Scrambled egg, Fried egg; Tofu (steamed, braised, pan-fried); Braised beans |
| 8 | Kimchi (2) | Napa cabbage kimchi; Other kimchi (including fresh kimchi) |
| 9 | Vegetable/Seaweed/Sauce (17) | Radish (braised, seasoned, pickled); Cucumber (row, seasoned, pickled); Lettuce; Cabbage; Paprika; Vegetable salad; Eggplant (seasoned, steamed); Seasoned spinach; Seasoned bean sprout; Seasoned zucchini; Laver (grilled, row); Stir-fried seaweed stems; Stir-fried mushrooms; Lotus root, Burdock root (braised, stir-fried); Japchae; Sauces (brown sauce, ketchup, mustard, etc.); Ssamjang, Gochujang, Gochujang with vinegar |
| 10 | Potato/Sweet potato/Corn (3) | Potato (stir-fried, braised, deep-fried); Sweet potato (steamed, grilled); Corn (steamed, grilled) |
| 11 | Dairy products (5) | Milk; Soy milk; Drinking yogurt; Yogurt; Cheese |
| 12 | Snack/Candy/Ice cream (6) | Snacks (chips, popcorn, wafer, cracker, etc.); Chocolate pie (Monshell pie, Choco pie, etc.); Candy, Jelly, Caramel; Chocolate, Energy bar; Almond; Ice cream, Sherbet |
| 13 | Fruits/Juice/Beverages (19) | Persimmons, Dried persimmons; Mandarin orange; Strawberry; Melon; Banana; Pear; Peach; Blueberry; Apple; Watermelon; Orange; Korean melon; Kiwi; Tomato, Cherry tomato; Pineapple; Grape; Fruit juice, Fruit drink; Vegetable juice; Functional beverage, Soft drink, Iced tea |
Table 5
Percentage of cumulative contribution and cumulative R2 for each energy value and 14 nutrients in the final dish list of food frequency questionnaire for Korean elementary school children
Intake frequency and portion size
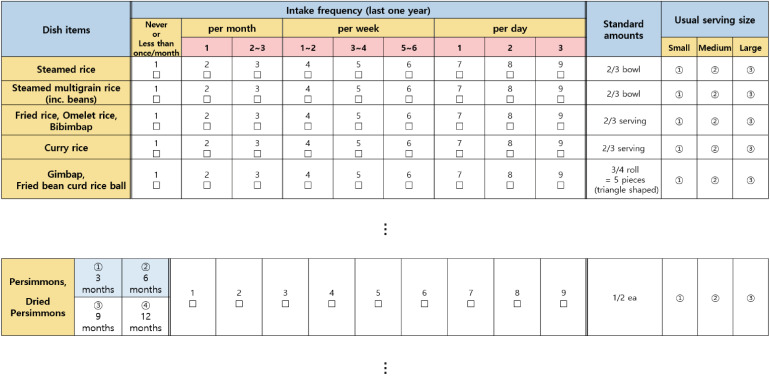
Based on the portion size and unit criteria, the dish in the same item was calculated using the value of the frequency weight. The intake frequency response was composed of 9 options (never or hardly ever; 1 to 3 times a month; 2 to 3 times a month; 1 to 2 or 3 times a week; 1 to 4 or 5 times a week; 1 to 6 times a week; 1 or 2 or 3 times a day), and the reference period is the last year based on the date of the response. Furthermore, because fruit intake is likely to fluctuate seasonally, we divided the frequency of children’s responses to fruit-related FFQ items by 4. Then, the response options (1 = 3 mon; 2 = 6 mon; 3 = 9 mon; 4 = 12 mon) were added to the FFQ for answer proximately (e.g., consumption during spring = 1, i.e., 3 mon). In other words, if the response for the months in which fruit was consumed was 3 mon, the amount of fruit intake was multiplied by 3/12 to calculate it. In addition, intake amounts from the FFQ were determined by comparing the portion sizes and standard amounts for elementary school children by dish. These portion sizes were used after comparing the mode and median intake of each dish code (4 digits) by elementary school children. The relevant part of the questionnaire is shown in Fig. 2. Bowl (200 mL), cup (200 mL), and spoon (10 mL) were used as reference tools (Fig. 2).
Calculation of nutrient content
For many dishes, the name of the dish may vary depending on the ingredients (e.g., soybean paste soup may also be called curled mallow soybean paste soup or napa cabbage soybean paste soup). Thus, there is a possibility that the subjects recall and survey other dishes related to the questionnaire item. In addition, this creates a gap and error between the nutrients actually consumed and the nutrient database we organized. In this case, the value of the frequency weight was used, which was calculated by the following equation [31]:

The numerator, the intake frequency of each dish, was summed by considering the number of meals consumed by each subject. Therefore, the frequency weight values were applied to each dish to calculate the distribution within the item.
Percentage coverage of questionnaire
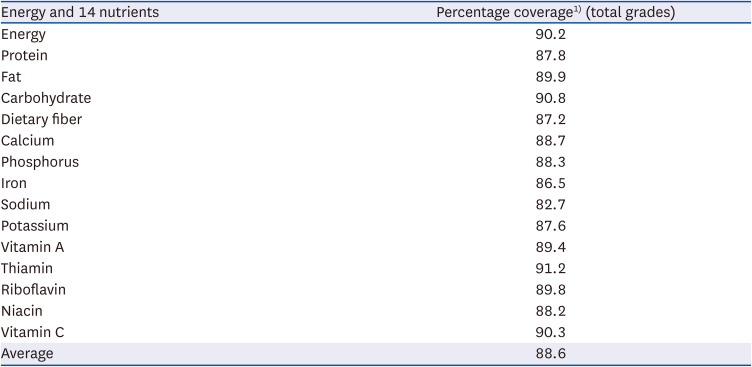
The average percentage coverage by Korean elementary school children in 24-h recall data was 88.6% (energy 90.2%, protein 87.8%, fat 89.9%, carbohydrate 90.8%, dietary fiber 87.2%, calcium 88.7%, phosphorus 88.3%, iron 86.5%, sodium 82.7%, potassium 87.6%, vitamin A 89.4%, thiamin 91.2%, riboflavin 89.8%, niacin 88.2%, vitamin C 90.3%) (Table 6). Furthermore, because some seasonings (salt, soy sauce, etc.) were excluded during the item selection process, sodium’s percentage coverage tended to be lower than other percentage coverages of energy and nutrients.
Table 6
Percentage coverage by FFQ for Korean elementary school children
DISCUSSION
The recommended types and amounts of nutrients vary depending on age, and there are also differences in the changes in dietary intake patterns [63233]. Thus, precise nutritional evaluation tools with appropriate considerations for each age group should be used. However, there has been no FFQ developed as a nutritional survey tool for elementary school children aged 6 to 11 in Korea. As a result, a detailed intake food frequency for this population has not yet been measured. Therefore, the purpose of this study was to develop a semi-quantitative FFQ for Korean elementary school children aged 6 to 11.
Other studies that developed an FFQ for Koreans selected items in the questionnaire using the food code [3134] or dish code [1415]. In the dish code-based studies, it is not known whether the source number of the dish was included. In our study, we compared the 2 types of code to use as questionnaire material to select the most relevant for elementary school children. To this end, we performed the item selection process in 3 ways, mainly by referring to the method reported by Yun et al. [15]; each item was selected using a food code, a dish code with a source number, and a dish code without a source number. The results showed that the selection of the items with a dish code without a source number could more closely represent a list of foods consumed by elementary school children. Several Korean dishes have many main ingredients in one dish, and many dishes are characterized by various seasonings [35]. For this reason, if the dishes are selected based on food code, there is a concern that other main ingredients or various seasonings may be neglected. Instead, dish code-based dishes can be interpreted as an item selection process that considers the characteristics of the Korean diet.
The number of items in other studies in Korea using the data from KNHANES is as follows: 71 items for adolescents [14], 112 items for adults [15], 116 items for preschool children [31], and 103 items for middle-aged subjects [34]. Our questionnaire contains 107 items for elementary school children. The relatively large difference between the number of items in the FFQ for adolescents and ours seems to be because they organized the dish code before starting the item selection process. Therefore, among the FFQ item groups, bread is usually listed first, along with rice and noodles. We listed the groups in the following order: rice (n = 5), noodles (n = 4), rice cake/Korean pancake/dumpling (n = 5), cereal/bread/cake (n = 10), soup/stew (n = 13), fish/meat (n = 16), egg/bean/tofu (n = 4), kimchi (n = 2), vegetable/seaweed/sauce (n = 17), potato/sweet potato/corn (n = 3), dairy products (n = 5), snack/candy/ice cream (n = 6), and fruit/juice/beverage (n = 19). However, the total number of fruit items in our study is 16, and there are blueberry and pineapple items that are not in other FFQ items [14153134]. In addition, there were more varieties of dishes, such as snacks, candy, and jelly, compared to dishes listed in the FFQ for adults, and only almonds were extracted from the nut dish. Conversely, in the FFQ we developed, there was less diversity in vegetable and seaweed items, and salted seafood dishes were not extracted [15].
The usual serving size response was determined by comparing the standard amount with the intake range in elementary school children. For subjects whose intake is outside the amount indicated in the questionnaire, the intake may be recorded as less or more than the actual intake. However, food records for the intake of fruit items may be seasonally biased depending on the timing of the survey, which is a problem also mentioned in other relevant studies [131415232634]. Therefore, KNHANES calculated the average period of fruit intake by the subjects using its own data and organized the response as (1: seasonal, 2: non-seasonal) [15]. In an FFQ development for middle-aged subjects, the response was suggested in units of 3 mon [34]. Similarly, in our study, the response options to the fruit items were organized by season and distributed on a 3-mon basis. Nonetheless, the reference month may differ from when the subject actually consumed the fruit item, so an error range may occur.
The average percentage coverage of the FFQs developed by other studies using KNHANES data is as follows: 87.0% for adults [15], 89.2% for preschool children [31], and 78.1% for middle-aged subjects [34]. In addition, the average percentage coverage of energy and 14 nutrients in our FFQ is 88.6% (82.7−91.2%); sodium’s percentage coverage (82.7%) was the lowest value; thus, there is a concern that the actual sodium intake by elementary school children may be underestimated. When using this FFQ, it is necessary to be aware of this limitation because of the possible association between sodium intake and chronic diseases [1236]. In addition to these limitations that may appear because this study was conducted only through data analysis, there may be limitations regarding questionnaire items. Elementary school children may consider the survey length long or have difficulty with the questions [22]. If the subjects find it difficult to understand, the question must be rephrased for clarity and simplicity. There is also a possibility that children may grapple with questions about items that are grouped together with multiple dishes (e.g., item 4: fried rice, omelet rice, bibimbap). Accordingly, it may be necessary to separating or recombining some items may be necessary [15]. Nevertheless, this study is meaningful because it is the first to develop an FFQ that can estimate the usual dietary intake of elementary school children aged 6 to 11 using data representative of Koreans.
In conclusion, we developed a semi-quantitative FFQ consisting of 107 items for Korean elementary school children aged 6 to 11. The FFQ developed in this study may encourage research on the nutrient intake of elementary school children in Korea. Also, a follow-up study is needed to evaluate the reproducibility and validity of this questionnaire [13].
 XML Download