

 PDF
PDF Citation
 Print
Print


INTRODUCTION
Type 2 diabetes is a serious public health problem with a high prevalence. According to a 2017 report published by the International Diabetes Federation, the number of individuals with type 2 diabetes aged 20–79 years may increase from 425 million individuals in 2017 to 629 million by 2045 [1]. This disease, the prevalence of which is ever-increasing, is managed by individual or combined approaches such as antidiabetic drug or insulin therapy, medical nutrition therapy, and increased physical activity [2].
Type 2 diabetes and its precursor, insulin resistance, are also associated with obesity, which is another serious public health problem [3]. Obesity is generally evaluated using body mass index (BMI). Central obesity, defined as the accumulation of body fat around the abdominal region, which causes an increase in waist circumference, may also increase the risk of developing type 2 diabetes [4]. A study demonstrated that insulin resistance in women with an increase in BMI over time was related to central obesity and not general obesity [5]. Type 2 diabetes is also associated with dyslipidemia, which is characterized by increased triglyceride (TG) and low-density lipoprotein (LDL) cholesterol levels and decreased high-density lipoprotein (HDL) cholesterol levels, leading to an increased risk of cardiovascular complications [6].
Hyperglycemia, which is one of the most important markers of type 2 diabetes, promotes the production of reactive oxygen species (ROS), thereby inducing oxidative stress and inflammation, which are associated with the production of high-adhesion molecules and proinflammatory cytokines. Therefore, type 2 diabetes, as well as the associated obesity and dyslipidemia, result in cells being easily damaged and a chronic proinflammatory condition that reduces antioxidative potential [7].
In recent years, due to the increasing prevalence of type 2 diabetes and obesity, awareness regarding healthy nutrition, and desire to maintain a healthy life, among other reasons, consumers want to include functional foods that offer health and nutritional benefits in their diets. The functional properties of these foods stem from the presence of phenolic compounds, dietary fibers, oligosaccharides, pro- and pre-biotics, plant sterols, and other nitrogen-containing compounds [8].
Studies have suggested that some dietary polyphenols with a high antioxidant content, especially those found in fruits, have antidiabetic properties because they improve glucose and lipid metabolism in individuals with type 2 diabetes and may be an alternative means of reducing oxidative stress to prevent and manage this disease [9]. Pomegranate, which is one such fruit, also has a high concentration of antioxidants owing to its high phenolic compound content, especially flavonoids and hydrolyzable tannins [10]. The inedible part of the pomegranate fruit, such as the peel, comprises 40% of its total mass and is generally considered waste [1112]. Similar to the edible part of the fruit, the pomegranate peel has been demonstrated to have a high antioxidant capacity and fiber level because it contains flavonoids and many phenolic compounds [1213]. Experimental and clinical studies have shown that the pomegranate peel has beneficial effects on blood pressure, glucose, and lipid profiles in patients with type 2 diabetes [291214]. Foods made with pomegranate peels and products are considered functional foods that can be implemented in the diets of patients with inflammation-related obesity, type 2 diabetes, and complications such as cardiovascular diseases owing to the phenolic compounds they contain [15].
Although the use of the pomegranate peel is uncommon in the food industry, especially in heat-treated products, studies have shown that it is used in meat products and bread making [1516]. However, no studies have examined the effect of consuming products produced with pomegranate peels on biochemical parameters. We believe that by determining the effects of products produced with pomegranate peels on glucose and lipid levels, antioxidant parameters, and anthropometric measurements, these products can be included in the nutritional treatment of type 2 diabetes, cardiovascular diseases, and obesity. Therefore, this study aimed to evaluate the effects of the pomegranate peel and its high antioxidant and fiber content on anthropometric measurements and metabolic and oxidative parameters of individuals with type 2 diabetes who consumed bread produced with antioxidant- and fiber-rich pomegranate peels. We chose bread as it has an important role in daily consumption.
Go to : 
SUBJECTS AND METHODS
Study design
This randomized, double-blind, parallel-controlled experimental study was carried out between March and April 2022 with 22 individuals aged between 19 and 64 years who were diagnosed with type 2 diabetes at the City Hospital for at least 5 years. Other inclusion criteria were the use of only metformin, ≤ 10% of body weight loss in the last 6 months, and BMI ≥ 25.0 kg/m2. The exclusion criteria were individuals 1) with kidney, liver, and inflammatory diseases; 2) receiving insulin therapy and sulfonylurea; 3) using prescription drugs and/or fiber supplements; 4) using vitamin and mineral supplements; 5) who were pregnant and lactating; 6) consuming excessive alcohol (> 2 drinks/day); 7) with gluten enteropathy; 8) who had an allergic reaction to pomegranates; and 9) who were menstruating. The study participants were matched in terms of sex, age, BMI, and diabetes duration.
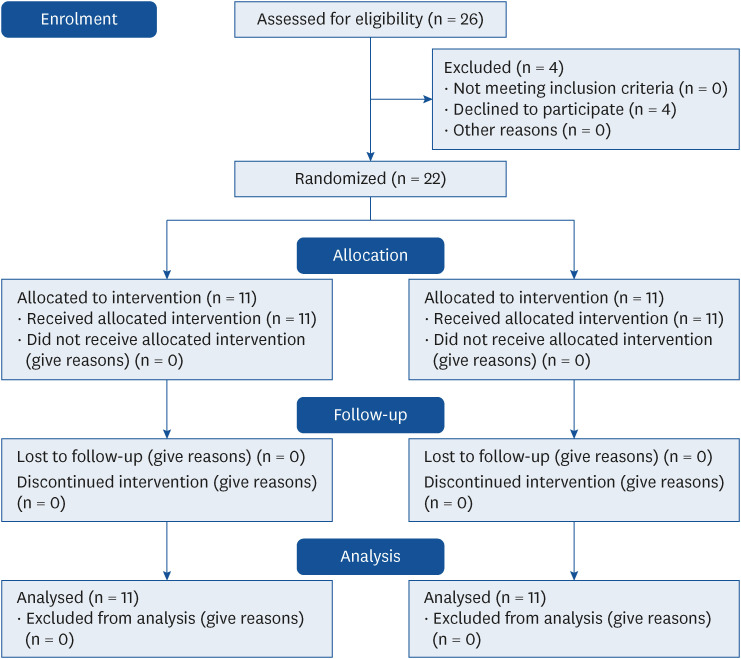
For this study, approval was obtained from the Toros University Clinical Research Ethics Committee on June 9, 2021 (number: 2021/425), and written informed consent was obtained from all participants before the study. This study was registered at ClinicalTrials.gov (NCT05232305). For determining the sample size, a power analysis was performed with G*Power software using alpha (α) = 0.05, power (1 − β) = 0.98, and d = 0.50 (medium effect size), which indicated that at least 10 individuals were required per group. Against any potential problems with the sample (e.g., withdrawals and irregular participation), the study started with 26 volunteers, of whom 4 withdrew at their own request in the following weeks. Subsequently, a researcher randomly assigned individuals to study and control groups using the R programming language. In addition, owing to the double-blind nature of the study, the type of bread consumed by each participant was unknown, and the bread types were only known by their codes to the researchers who produced and distributed the bread in the clinical environment.
Dietary intervention
The study group (n = 11) consumed 500-mg pomegranate peel–added bread (PPB) daily for 8 wk, whereas the control group (n = 11) consumed standard bread (SB) that matched the PPB in shape and size for the same period (Fig. 1). We emphasized that the participants must not change their nutritional habits, physical activities, and drug treatments or use any nutritional supplements during the study period. Each participant was provided two slices of bread corresponding with the nutrition program prepared by the researchers who contacted the participants weekly to check whether they consumed the bread during the study.
A questionnaire was administered to the participants in the form of a face-to-face interview, and their general characteristics, anthropometric measurements, and nutritional habits were determined. Blood samples were taken for obtaining biochemical parameters both at the beginning and end of the study. Additionally, a standard nutrition program (not exceeding 60% carbohydrates, 20% proteins, and 30% fats) was prepared for the participants to start at least 1 wk before the study, and 3-day food records were obtained.
Production and contents of the bread
The pomegranate peelings obtained from a local company (Atışeri, Mersin, Turkey) were separated from the edible part and the red hard outermost part of the fruit and dried at 55°C in the Toros University Food Chemistry Laboratory. They were then ground using a grinder and stored in sealed plastic bags at −18°C until use. The SB and PPB used in the study were produced in the Nutritional Principles Laboratory of the Toros University. For 50 g of SB, 900 mL of water, 42 g of fresh yeast, 12 g of salt, and 12 g of sunflower oil were added to 1,000 g of sifted whole wheat flour, which was then divided into 40 equal parts. For 50 g of PPB, 20 g of pomegranate peel, 914 mL of water, 42 g of wet yeast, 12 g of salt, and 12 g of sunflower oil were added to 1,000 g of whole wheat flour, which was then divided into 40 equal parts (500 mg of pomegranate peel per piece). After the bread doughs were shaped, they were left to rest for 10 min and fermented for 30 min in an incubator at a temperature of 35°C and relative humidity of 85%. Subsequently, the doughs were baked at 180°C for 50 min. Table 1 shows the amounts of antioxidants and phenolic compounds and nutritional content in the produced breads (50 g).
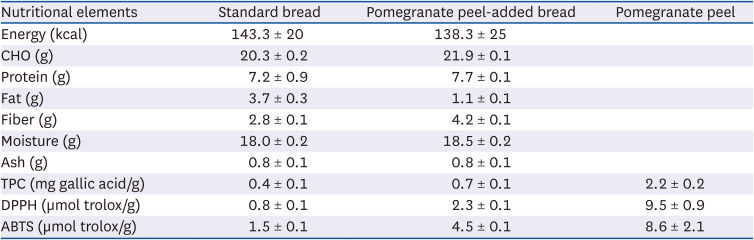
Table 1
Quantity and nutritional values of breads (50 g)
All results are given as the mean of three repetitions. Data are presented as mean ± SD.
CHO, Carbohydrate; TPC, total phenolic compound; DPPH, 1,1-diphenyl 2-pycrylhydrazyl; ABTS, 2,2-azinobis 3-ethylbenzothiazolin-6-sulfonic acid.
![]()
When the nutrient content in the breads was examined, the macronutrients were in similar proportions, except for fats (Table 1). This difference in fat content between the SB and PPB might be because fats that formed a potent complex with the large amounts of polyphenols and flavonoids in the pomegranate peel might have been partially extracted by the solvent [17].
Documentation of food intake
For calculating the amount of energy consumed by the individuals during the study period and determining whether there were any changes during the study that might affect the results, the 3-day food consumption of the individuals (2 weekdays and 1 weekend day) was recorded under the supervision of the researcher at the beginning and end of the study. While recording food consumption, the amount of food consumed was calculated using the “Food and Food Photo Catalog—Measurements and Quantities” catalog [19], and the “Standard Meal Recipes” book was used to calculate the portion sizes of meals consumed when eating out and the nutrients included in one portion [20]. With the food consumption records, the total amounts of energy, macronutrients, fiber, and cholesterol consumed were calculated using the Nutrition Information System (BeBIS) 8.2 software package [21].
Evaluation of anthropometric measurements
Body weight, height, waist circumference, hip circumference, and body composition measurements of the participants were obtained in the face-to-face interviews conducted by the researcher both at the beginning and end of the study, and BMI and the waist-hip ratio of the individuals were calculated using this information.
Height measurement
Height was measured by fixing an infrared height meter scale to the wall, with the feet side by side and head in the Frankfort plane (the eye triangle and top of the auricle are aligned) [22].
Body weight measurement
Body weight of the individuals was measured with minimum clothing and no shoes with a portable digital indicator sensitive to 0.1 kg on the infrared height meter scale [22].
BMI calculation
BMI was used to evaluate both malnutrition and obesity and was calculated by dividing weight (kg) by height (m2) (kg/m2) [22].
Waist and hip circumference measurements
Waist circumference was measured from the midpoint of the lower rib and crista iliaca, and hip circumference was measured using a measuring tape at the widest part of the hip. Waist/hip and waist/height ratios were calculated using these measurements [23].
Body composition
Body measurements (body fat, lean mass, and water amount and percentages) were taken with body composition analyzer (Tanita BC-418, Tanita Corporation, Tokyo, Japan) after implementing measurement conditions such as not performing heavy physical activity 24 h before the analysis, not consuming alcohol, eating food and drinking water at least 2 h before the analysis, and not drinking tea, coffee, and acidic beverages at least 4 h before the analysis [22].
Blood pressure measurements
In the sitting position, blood pressure was measured using a digital blood pressure device (OMRON IntelliSense, HEM-907XL; OMRON Healthcare, Kyoto, Japan) with an accuracy of ± 5 mmHg in the right arm. Three consecutive measurements were taken at 5-min intervals, and the mean values were calculated.
Evaluation of biochemical parameters
At the beginning and end of the study, basal blood samples were taken from the participants at the City Hospital Biochemistry Laboratory after 8–12 h of fasting. Fasting blood glucose (FBG), fasting insulin, glycated hemoglobin (HbA1c), total cholesterol, TG, LDL cholesterol, and HDL cholesterol levels, total antioxidant capacity (TAC), and thiobarbituric acid reactive substance (TBARS) values were measured from the blood samples.
Biochemical parameters were analyzed at the City Hospital Biochemistry Laboratory and assessed on the basis of the laboratory’s standards. FBG was measured with ultraviolet test analysis, HbA1c with the immunoinhibition method, insulin with the chemical immunoassay, total cholesterol with the cholesterol oxidase method, TG with the glycerol phosphate oxidase method, and HDL cholesterol with the enzymatic colorimetric method. LDL cholesterol levels were calculated using the Friedewald equation (LDL cholesterol = total cholesterol − HDL cholesterol - (TG/5)). Homeostatic Model Assessment for Insulin Resistance (HOMA-IR) values were calculated with the following formula: FBG (mg/dL) × fasting insulin (IU/mL)/405, and HOMA-IR ≥ 2.5 was defined as insulin resistance. TAC was measured with the spectrophotometric method (Mindray BS-300), and TBARS was measured with the enzyme-linked immunosorbent assay method (BioTek 800 TS) with commercial kits (Rel Assay Diagnostics, Ankara, Turkey).
Sensory analyses
Sensory analyses of the bread samples were performed within 24 h after the breads were removed from the oven. Crust and inner colors, flavor, odor, hardness, pore structure, chewability, and general taste of the breads were evaluated by 20 trained panelists using a 5-point Likert scale (5 = liked it; 4 = liked it somewhat; 3 = neither liked nor disliked it; 2 = slightly disliked it; and 1 = disliked it).
Statistical evaluation of the data
Frequency analyses and mean comparison tests were performed. During the first stage, frequency analyses of the demographic characteristics and nutritional habits of the individuals were performed, and the frequencies (n) and percentages (%) of the groups were presented together. During the second stage, the results of inter-group and intra-group comparisons of dietary energy, nutrient intake, anthropometric measurements, and metabolic and oxidative stress parameters of individuals based on bread types were presented at beginning and after 8 wk of intervention. The Shapiro–Wilk normality test and Levene’s variance homogeneity test results were analyzed to select the most appropriate hypothesis tests. As appropriate hypothesis tests for normally distributed measurements, an independent samples t-test was used for the independent group comparisons, and a paired t-test was used for two dependent group comparisons. The hypothesis tests were conducted together, obtaining the mean difference and the lower and upper limit values of the confidence intervals of the differences. All analyses were performed using SPSS version 26 (IBM; Armonk, NY, USA) and the margin of error was set at < 0.05.
Go to :
RESULTS
All 22 participants completed the study and were included in the analysis. We found no statistically significant differences between participants in both groups in terms of sex (PPB n = 11; 6 female individuals; SB n = 11; 5 female individuals), or age and diabetes duration (PPB 54.1 ± 10.6 yrs, 73.1 ± 8.4 mon; SB 54.5 ± 9.7 yrs, 74.7 ± 11.2 mon, respectively) (P > 0.05). In addition, we found no statistically significant between-group differences in terms of dietary intake (Table 2), anthropometric characteristics (Table 3), and biochemical markers (Table 4) at the beginning of the study (P > 0.05).
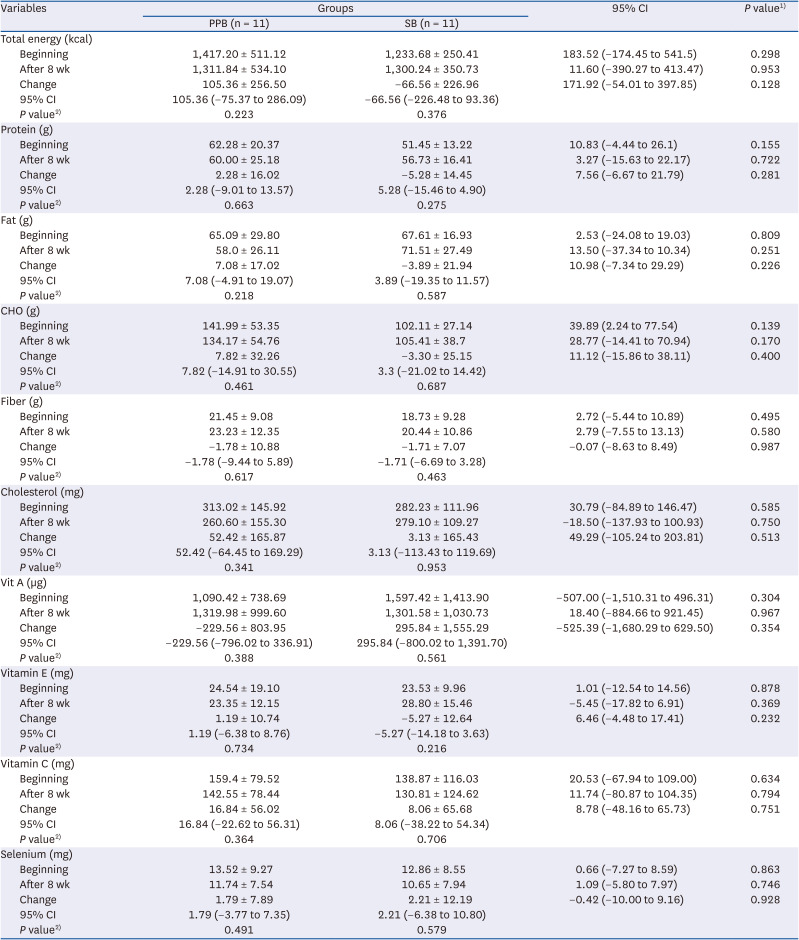
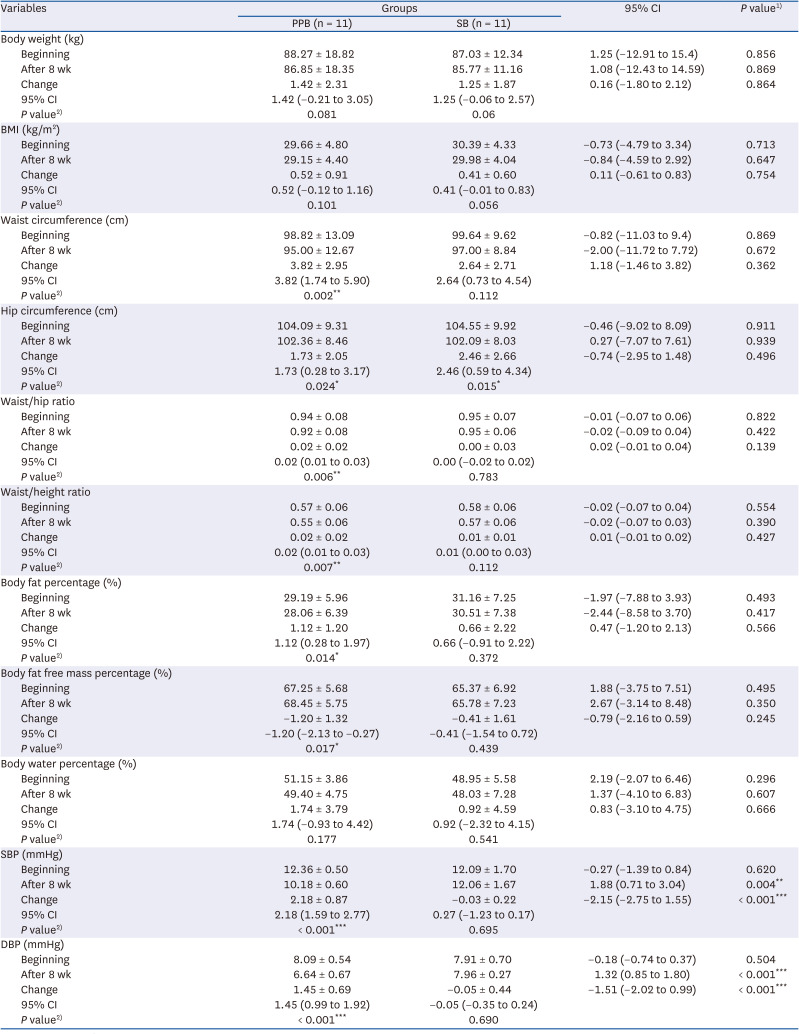
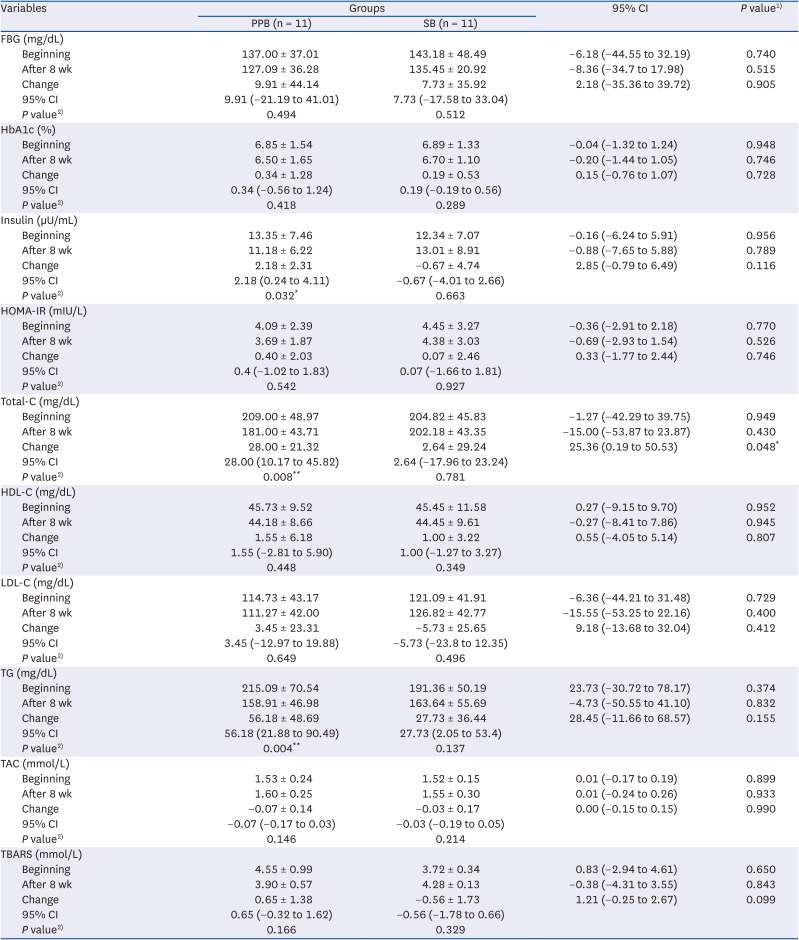
Table 2
Dietary total energy values and nutrient intake amounts of PPB- and SB-consuming individuals calculated at the beginning and after 8 wk of the intervention
Data are presented as mean ± SD.
PPB, pomegranate peel-added bread consumers; SB, standard bread consumers; CI, confidence interval.
1)Independent samples t-test; 2)Paired t-test.
![]()
Table 3
The anthropometric measurements of PPB- and SB-consuming individuals measured calculated at the beginning and after 8 wk of the intervention
Data are presented as mean ± SD.
PPB, pomegranate peel-added bread consumers; SB, standard bread consumers; CI, confidence interval; BMI, body mass index; SBP, systolic blood pressure; DBP, diastolic blood pressure.
1)Independent samples t-test; 2)Paired t-test.
*P < 0.05, **P < 0.01, ***P < 0.001.
![]()
Table 4
Metabolic and oxidative stress parameters of PPB- and SB-consuming individuals measured at the beginning and after 8 weeks of the intervention
Data are presented as mean ± SD.
PPB, pomegranate peel-added bread consumers; SB, standard bread consumers; CI, confidence interval; FBG, fasting blood glucose; HOMA, homeostatic model of insulin resistance; Total-C, total cholesterol; HDL-C, high density lipoprotein cholesterol; LDL-C, low density lipoprotein cholesterol; TG, triglyceride; TAC, total antioxidant capacity; TBARS, thiobarbituric acid reactive substances.
1)Independent samples t-test; 2)Paired t-test.
*P < 0.05, **P < 0.01.
![]()
Results of the sensory analyses
Table 5 shows the results of the sensory analyses of the breads used in the study. The participants liked the PPB more than the SB in terms of all the evaluated sensory parameters, but only the sensory parameters of flavor, odor, chewability, and pore structure showed statistically significant differences (P < 0.05).

Table 5
Sensory parameters of breads
![]()
Results of energy and nutrient intake measurements
Dietary total energy values and nutrient intake amounts of PPB- and SB-consuming individuals calculated at the beginning and after 8 wk of the intervention are shown in Table 2. On evaluating both intra-group and inter-group comparison results of the groups consuming PPB and SB, we observed that the differences were not statistically significant (P > 0.05).
Results of anthropometric measurements
The anthropometric measurements of individuals with type 2 diabetes who consumed SB and PPB are shown in Table 3. On evaluating the intra-group comparison results, we determined that the waist circumference, hip circumference, waist/hip ratio, waist/height ratio, body fat percentage, systolic blood pressure (SBP), and diastolic blood pressure (DBP) of the individuals who consumed PPB were higher at the beginning of the study than after 8 wk of the intervention, whereas the fat-free mass percentage was lower; these differences were statistically significant (P < 0.05). In addition, the hip circumference was significantly higher at the beginning of the study than after 8 wk of the intervention in the SB group (P < 0.05). On examining the inter-group comparison results of the changes observed in each group, we observed that the changes in SBP and DBP measured after 8 wk of the intervention in individuals who consumed PPB were significantly higher than those measured in individuals who consumed SB (P < 0.05), whereas the other anthropometric measurements did not show statistically significant differences according to the bread type (P > 0.05) (Table 3).
Results of biochemical parameters
On examining the inter-group comparison results of the metabolic and oxidative stress parameters measured at the beginning of the study and after 8 wk of intervention, we found that the changes in serum cholesterol values measured after 8 wk of intervention were significantly higher in individuals who consumed PPB than in individuals who consumed SB (P < 0.05). When the intra-group comparison results were assessed, serum insulin, cholesterol, and TG levels of the individuals who consumed PPB were found to be significantly higher at the beginning of the study than after 8 wk of the intervention (P < 0.05) (Table 4).
Go to :
DISCUSSION
In this study, 8 wk of PPB consumption by individuals with type 2 diabetes had a positive effect on anthropometric measurements and on biochemical parameters such as serum insulin, total cholesterol, TG, and blood pressure levels, suggesting that pomegranate peels may play a protective role against type 2 diabetes and its complications.
Hyperglycemia is a characteristic of type 2 diabetes; it creates a chronic proinflammatory condition that reduces the antioxidant potential of cells by promoting ROS production, oxidative stress, and proinflammatory cytokine production [7]. The increasing prevalence of type 2 diabetes and awareness regarding healthy nutrition and decline in food reserves have resulted in consumers wanting to benefit from food in terms of health and nutrition, increasing their tendency toward functional foods, especially those made with by-products of fruits [82425]. The pomegranate peel, which is one of these by-products, contains many bioactive compounds such as phenolic compounds, flavonoids, and polyphenols, including hydrolyzable tannins, dietary fiber, vitamins, and minerals [26]. While the content of bioactive compounds in pomegranate peels tends to be higher than that in edible parts, the complex compounds are usually present as a mixture in pomegranate peels; thus, the synergistic effect of the different compounds can also induce various physiological effects [27]. Numerous in vivo and in vitro studies have suggested using the antioxidant and anti-inflammatory effects of these compounds as a strategy for preventing and managing type 2 diabetes and its complications that have an inflammatory basis because they can significantly reduce the negative effects of ROS and nitrogen species on physiological functions [2829].
Rather than body weight and BMI, waist circumference has been shown to be an independent factor of chronic diseases, especially type 2 diabetes and obesity [30]. Decreases in waist circumference may also reduce the risk of type 2 diabetes, even though body weight and BMI remain constant [31]. In contrast, oxidative stress is associated with an increased BMI and waist circumference [32]. Individuals with increased BMI and waist circumference may have impaired antioxidant defense systems, lower antioxidant concentrations, increased lipid peroxidation levels, and increased cytokine release from adipose tissue [33]. Studies conducted to assess the relationship between anthropometric measurements and antioxidant capacity found a negative relationship between dietary TAC values with BMI and central adiposity values [3435]. In contrast, a study conducted in Iran found that individuals with higher dietary antioxidant capacities had a higher waist circumference and waist/hip ratios [32]. Studies emphasize that fruits and vegetables are the main sources of antioxidants and fiber [3637], by-products considered waste products are also sources of antioxidants and fiber [2738], and consumption of these by-products may be effective in reducing anthropometric measurements [39]. A study conducted in Mexico concluded that an increase in fiber consumption had a positive effect on BMI and fat mass and lean mass levels of the participants. The mechanism underlying these effects may be because the increase in fiber consumption caused a decrease in body fat tissue by lowering the glycemic index and increasing insulin sensitivity [4041]. In a study aiming to examine the effect of consuming pomegranate peels, which are a by-product, on anthropometric measurements, 500 mg of pomegranate peel extract was administered to individuals with type 2 diabetes for 8 wk; this caused a significant decrease in the waist circumference of the individuals [9]. In a recent study, 1,000 mg of pomegranate extract was administered to obese individuals who participated in the study for a month, and at the end of the study, the BMI did not significantly differ between the group that was administered pomegranate extract and the control group; however, the treatment group experienced greater weight loss [42]. In a study conducted with 20 obese individuals who consumed 120 mL of pomegranate juice or placebo for 4 wk, those who consumed pomegranate juice had greater reductions in body weight, BMI, and body fat than those who consumed placebo [43]. In a prospective cohort study conducted in the Netherlands, a positive correlation was found between the total dietary antioxidant capacity and fat-free mass of participants, which was attributed to the increase in proinflammatory cytokines related to oxidative stress, leading to protein degradation, atrophy, and loss of muscle fibers [44]. In our study, the waist circumference, waist/hip ratio, waist/height ratio, and body fat percentage of individuals consuming pomegranate peels were significantly lower than those in the control group, whereas the fat-free mass percentage was significantly higher (P < 0.05) (Table 3). Although various studies have shown that gallic acid in pomegranates suppresses appetite by increasing adiponectin levels and decreasing leptin levels, the total energy intake of individuals did not differ significantly between both groups in this study; these results can be explained by the high antioxidant capacity and fiber content of pomegranate peels [45]. In addition, the consumption of pomegranate peel significantly reduced SBP and DBP (P < 0.05) (Table 3). These results are congruent with those of previous studies, and possible mechanisms are as follows: 1) the consumption of polyphenols obtained from pomegranates decreases angiotensin-converting enzyme levels and increases the bioavailability of nitric oxide, which has a vasodilatory effect on blood vessels [46] or 2) fiber consumption reduces arterial BP by reducing body weight, blood lipid levels, and glycemia [4748].
Ensuring glycemic control is indispensable for type 2 diabetes management [1]. In this study, the decrease in FBG and HOMA-IR levels in individuals with type 2 diabetes was not statistically significant (P > 0.05); however, serum insulin levels were significantly decreased (P<0.05) (Table 4). In vitro studies have demonstrated the underlying mechanisms, wherein gallic acid, a phenolic compound in pomegranates, increases the activity of the glucose transporter peroxisome proliferator-activated receptor gamma (PPAR-γ) [49], and ellagic acid, another phenolic compound, decreases resistin levels [50], both of which result in reduced insulin resistance. High fiber and phenolic compound levels in pomegranate peels are associated with improved glycemic control [37]. This effect may be a result of dietary fibers reducing or delaying carbohydrate absorption, inhibiting increases in insulin levels, and improving glycemic control [3951]. In clinical studies carried out with individuals with type 2 diabetes, Banihani et al. [2] found that pomegranate juice use increased β-cell function, Grabež et al. [9] found that pomegranate peel consumption decreased serum insulin levels, and Sohrab et al. [52] found that 12 wk of pomegranate juice supplementation did not have an effect on glycemic markers. Considering the results of previous studies, the lack of a significant effect of pomegranate peels on FBG and insulin resistance in the current study can be explained by the small sample size. In addition, the relationship between central obesity and increased insulin levels in type 2 diabetes is well known [53]. This suggests that the decrease in serum insulin levels may be due to the antioxidant capacity and fiber content of the pomegranate peel as well as the decrease in waist circumference and body fat percentage of individuals consuming the pomegranate peel.
Individuals with type 2 diabetes have a two to three times higher prevalence of cardiovascular disease than individuals without type 2 diabetes [54]. Most individuals with type 2 diabetes have dyslipidemia, which is characterized by increased TG and LDL cholesterol levels and decreased HDL cholesterol levels [6]. In the present study, pomegranate peel consumption decreased serum TG, total cholesterol, and LDL cholesterol levels and increased HDL cholesterol levels in individuals with type 2 diabetes; however, among these parameters, only TG and total cholesterol levels were significant (P < 0.05) (Table 4). In studies evaluating the effects of pomegranate peels on lipid metabolism, the one possible mechanism is linked to polyphenol components, where in polyphenols in pomegranate peels reduce serum TG and total cholesterol levels by inhibiting pancreatic lipase activity and acetyl-coenzyme A acetyltransferase and 3-hydroxy-3-methylglutaryl coenzyme A reductase enzymes [55]. Additionally, among the pomegranate peel polyphenols [56], punicalagin suppresses TG biosynthesis through the enzyme diacylglycerol acyltransferase 1 [57] ellagic acid causes a dose-dependent improvement, in the lipid profile, punicic acid reduces inflammation and improves metabolic processes depending on PPAR-γ, which is the main modulator of lipid metabolism[58], catalpic acid reduces serum TG levels in white adipose tissue through PPAR-γ, and gallic acid reduces serum total cholesterol and TG levels [59]. While both animal model and clinical studies have shown that the use of polyphenols reduces serum LDL cholesterol levels and LDL oxidation and increases HDL cholesterol levels, some studies have detected no effects [5960]. Apart from the polyphenols in the pomegranate peel, other compounds reportedly have effects on lipid metabolism and oxidation, for example, fat-soluble flavonoids adhering to membranes of lipoprotein particles and reducing lipid peroxidation [61]. TBARS values are usually measured as markers of lipid peroxidation [9]. Studies on pomegranates and their by-products have found that their antioxidant capacity increases depending on the polyphenols they contain, which are responsible for the development of limited oxidative damage [6263]. In our study, TBARS values decreased by 14.2% in the pomegranate peel–consuming group and increased by 18.6% in the control group; however, these values were not statistically significant (P > 0.05) (Table 4). TAC values increased by 4.5% in the group consuming pomegranate peels and by 1.9% in the control group, and this difference was also not significant (P > 0.05). The fact that the consumption of antioxidant minerals and vitamins by the participants was similar before and after the study suggests that this difference between the groups could be attributed to the pomegranate peel. This result is inconsistent with those of studies conducted with individuals with type 2 diabetes and metabolic syndrome [1764]. The antioxidant activity of the both pomegranate peel and breads was measured with the 1,1-diphenyl-2-picrylhydrazyl and 2,2'-Azino-bis (3-ethylbenzothiazoline-6-sulfonic acid) tests, which are widely used to evaluate free radical scavenging ability. The values obtained were consistent with those of previous studies [6566] and showed a strong antioxidant activity in our study. Apart from the high polyphenol content of the pomegranate peel, the lipid profile is also associated with the high fiber content. For instance, dietary fibers increase the fecal excretion of bile acids, reduce cholesterol absorption, and cause fat malabsorption [67]. Studies indicate a negative relationship between dietary fiber consumption and plasma cholesterol and TG levels [5168]. While the decrease in total cholesterol and TG levels is attributed to the polyphenol and fiber content of the pomegranate peel, these differences between our study results and those from the literature in terms of LDL cholesterol levels, TBARS values, and TAC can be attributed to the small sample size, dose [924], shape [1214], and heat treatment of the pomegranate peel [69].
In products with a high antioxidant capacity, heat treatment decreases their capacity [70]. Although no previous studies have been conducted on heat-treated pomegranate peels, in a study on black corn with high anthocyanin levels and some phenolic compounds, heat treatment was associated with a significant decrease in both compounds [71]. Similarly, the anthocyanin content of wheat breads made with blue and purple grains decreased after baking [72]. Contrary to these study results, another study determined that phenolic compounds maintain their antioxidant properties after baking, which provides potential benefits to consumers [73].
Sensory characteristics are important parameters in bread consumption and affect the quality of the final product [74]. Altunkaya et al. [75] evaluated the sensory properties of PPB and showed that the addition of pomegranate peels (2.5%, 5%, and 10%) to bread formulations did not affect the acceptability of the breads in general. In another study in which the sensory evaluation of PPB was performed in terms of color, aroma, texture, taste, and mouthfeel, only the hardness of the BPP was disliked, compared with that of the white bread (control) [76]. In this study, the PPB sample was more favorable than the SB in terms of all the evaluated sensory parameters. However, among these sensory parameters, the difference was statistically significant in terms of flavor, odor, chewability, and pore structure (P < 0.05) (Table 5).
The strengths of this study include the use of PPB, since pomegranate peels are usually seen as a waste product, of both laboratory and clinical stages, of interviews being conducted face-to-face, and of a randomized and double-blind design to avoid selection bias. This study also has limitations that should be acknowledged. The first limitation was the small sample size, which led to a limited number of individuals being evaluated. Another limitation is the inability to provide sufficient power to investigate the effects of other factors, such as age and body weight, which affects the generalizability of the results.
In conclusion, the pomegranate peel, which is rich in polyphenols, has positive effects on anthropometric measurements and serum insulin levels, lipid profiles, and blood pressure levels in individuals with type 2 diabetes. The addition of pomegranate peels did not have a negative effect on the sensory properties of the PPB. On the basis of the results, we believe that fruit waste products such as pomegranate peels, especially those rich in polyphenols and fibers, can be used in healthy and safe products suitable for our consumption. Despite a partial loss in antioxidant activity due to heat treatment, these products can be implemented in strategies to manage type 2 diabetes and play a preventive role in the development of complications. In addition, bioactive components such as polyphenols and fibers contained in pomegranate peels can be used as functional components. With the development of functional foods rich in antioxidant capacity and fiber, waste products can be evaluated and sustainable nutrition can be promoted, as with the development of PPB in our study. Considering the results of this study, well-designed randomized controlled studies with larger sample sizes, longer dose-controlled intervention times, and individuals of different ages and BMI values are needed to confirm the beneficial effects of pomegranate peels in the management of type 2 diabetes in the future.
Go to :
 XML Download