

 PDF
PDF Citation
 Print
Print


INTRODUCTION
Overweight and obesity are defined as abnormal or excessive fat accumulation that impairs health. Over the past decades, the incidence of early childhood overweight and obesity has risen substantially, posing significant public health concerns [1]. According to the World Health Organization (WHO), approximately 30 million children aged < 5 years were estimated to be overweight or obese in 2020. In addition, childhood obesity tends to persist into adulthood and increases the risk of obesity-related morbidities, such as diabetes, hypertension, and cardiovascular diseases, later in adulthood [2]. Obesity prevention initiatives that commence early in childhood could, thus, potentially impart benefits.
Eating behaviors is a collective term that encompasses the patterns of food consumption habits, such as food choices and motives, meal timing and frequency, portion sizes, and dieting. Eating behaviors directly impact energy intake and balance; therefore, they represent a key intervention target for obesity prevention [3]. However, children’s eating behaviors change with aging [4]. The early-childhood 3–5-year age range is a particularly critical period of growth and development of physical-function control, emotions, social cognition, and social awareness [4]. The inclination to accept or avoid foods also gradually begins to be shaped during this period with increasing exposure to new foods, and it is reinforced and maintained thereafter [5]. The nutritional needs, appetite, taste preferences, overall processes, and motives associated with food choices and dieting are, thus, distinct in early childhood [6]. Moreover, eating behavior is a cultural process affected by the availability or affordability of foods, food systems, and culinary traditions that are heterogeneous across regions [7]. Therefore, early childhood eating behaviors should be assessed based on regionally and culturally adapted environments according to their life-stage-specific eating transitions. However, considerably less attention has been focused on this phenomenon in previous studies that have investigated the association of eating behaviors with early childhood obesity in South Korea [89].
In addition, attempts to identify the determinants of early childhood eating behaviors have largely emphasized pediatric and/or parental characteristics [51011], such as demographics, socioeconomic status, and physical and mental health. However, eating behaviors are complex phenomena emanating from the interplay of physiological, psychological, and physical and social environmental factors [1213]. Diet during early childhood, in particular, is supervised by parents, predominantly mothers, whose parenting and feeding practices have been found to pose a significant impact on determining preschool children’s exposure, acceptance, and response to foods [1415]. Furthermore, with a greater number of women entering the workforce and children being increasingly exposed to media platforms at a younger age [1617], the food environments of childcare centers [18], television (TV), and online food advertising [1920] have emerged as novel, contemporary, physical, and social environmental targets for modulating eating behaviors in early childhood. Hence, a comprehensive investigation of these multi-level determinants of early childhood eating behaviors is important; however, studies that have undertaken such socio-ecological approaches in Korea are lacking.
Therefore, the present study aimed to identify eating behaviors associated with early childhood obesity using a preschool nutrition quotient (NQ-P), a previously validated and comprehensive questionnaire assessing the multiple eating behavioral dimensions of preschool children aged 3–5 years in Korea [21]. Our understanding of obesity-associated childhood eating behaviors was evaluated by exploring preschool children’s individual, maternal, physical, and media-related environmental factors to account for the complexity of eating behaviors.
SUBJECTS AND METHODS
Study design and population
A cross-sectional survey was conducted. In the present study, email invitations were distributed to potential participants who were registered as panels in an online research company (Macromill Embrain Inc., Seoul, Korea). Prior to the study, potential participants were administered the online consent form, which contained details regarding the research objectives guiding the examination of the ecological factors of obesity and eating behaviors among preschoolers. Of those who consented to participate in the study, 365 mothers who each had at least one child aged 3–5 years were enrolled; however, one who had a child with an implausible body mass index (BMI) (BMI = 160 kg/m2) was excluded from the present analyses.
Consequently, 364 mothers of preschool children aged 3–5 years were included in our study. Consent was obtained from the participants prior to their participation in the study. The study protocols were approved by the Institutional Review Board (IRB) of Ewha Womans University (IRB No: ewha-202103-0029-03).
Assessment of preschool children’s eating behaviors
The preschool children’s mothers completed the NQ-P, a validated diet quality and food-related behavior checklist for preschool children developed by the Korean Nutrition Society [21]. The NQ-P comprises 14 questions that assess the three dimensions of preschool children’s eating behaviors: “balance” (five items), “moderation” (four items), and “environment” (five items). Questions on “balance” evaluate the overall diversity of food groups consumed and inquire about the frequencies of white milk, bean and bean product, meat, and fish consumption as well as the usual number of vegetable side dishes consumed during each meal. “Moderation” questions assess adherence to recommended intakes of food and nutrients that are related to chronic diseases and determine the frequencies of processed meat, fast food, sweet or greasy baked good, and processed beverage consumption. Questions regarding “environment” evaluate diet-related environment and feeding practices and establish the frequencies of breakfast consumption; familial support for healthy eating; eating without moving around; washing hands before meals; and TV, computer, and/or smart phone screen time.
Responses to questions specific to the “balance,” “moderation,” and “environment” dimensions were consolidated, resulting in three respective scores ranging from 0 to 100 [21]. The three scores were subsequently weight-averaged to generate an overall NQ-P score ranging from 0 to 100, which served as a composite indicator reflecting the overall aspects of preschool children’s eating behaviors [21]. The higher the NQ-P score, the healthier the eating behavior.
Assessment of maternal parenting styles and feeding practices
Maternal parenting styles
The mothers’ parenting styles were measured using the most recent version of the Parents as Social Context Questionnaire (PSCQ), which was originally developed by Skinner, Wellborn, and Regan and further expanded by Skinner et al. [22] to improve its reliability. The PSCQ comprises 31 questions using a four-point Likert scale ranging from “not at all” to “very much” and measures the following six core parenting subscales: “warmth” (six items), “structure” (five items), “autonomy support” (five items), “rejection” (five items), “chaos” (five items), and “coercion” (five items). These subscales can be aggregated into supportive (warmth, structure, and autonomy support) and unsupportive (rejection, chaos, and coercion) parenting. The “warmth” subscale refers to the expression of affection, love, appreciation, and emotional support; the “structure” subscale refers to the provision of clear and consistent guidelines, expectations, and rules for child behavior; and the “autonomy-support” subscale refers to the provision of freedom of choice and expression and encouragement of children to actively explore their preferences and opinions. In contrast, the “rejection” subscale refers to overt communication entailing negative and hostile expressions toward the child, the “chaos” subscale refers to a lack of consistent discipline and unpredictable parental behaviors, and the “coercion” subscale refers to restrictive parental overcontrol based on an intrusive and autocratic style. The composite scores of the six parenting subscales were separately calculated by summing the responses to each subscale’s specific questions, with a higher score indicating a greater probability of possessing a specific parenting style.
Maternal feeding practices
The mothers’ feeding practices were measured using the Child Feeding Questionnaire (CFQ) developed by Birch et al. [2324]. Of the 31 CFQ questions using a five-point Likert scale ranging from “strongly disagree” to “strongly agree,” we selected a priori 15 questions related to the control of the child’s food intake and feeding practices and measured three feeding-practice subscales: “restriction” (eight questions), “pressure to eat” (four questions), and “monitoring” (three questions). “Restriction” assesses the extent to which parents limit their children’s access to foods. The “pressure to eat” subscale investigates parents’ tendency to pressure their children to eat more food. “Monitoring” examines the extent to which parents oversee their child’s eating. The three overall scores of the maternal-feeding-practice subscales were calculated by summing the responses to each subscale’s specific questions; the higher the feeding practice score, the greater the tendency to use the respective feeding practice.
Assessment of obesogenic physical environmental factors
Obesogenic environment of the childcare center
The obesogenic environment of the childcare center was assessed using a modified version of the Environment and Policy Assessment and Observation (EPAO) questionnaire, which is commonly used to assess the obesogenic environmental factors of daycare centers [2526]. In the EPAO, we a priori selected and modified 13 questions using a five-point Likert scale ranging from “not at all” to “very true” related to nutrition and physical activity programs. The 13 questions covered the following areas: use of the children’s nutrition and physical activity facility, nutrition and physical activity programs, parental education programs on nutrition and physical activity, physical activity facilities in the childcare center, and teachers’ adherence to healthy behaviors. We generated an overall anti-obesogenic childcare center score, summing all responses from the 13 items as well as the subscores for the nutritional (six items) and physical (six items) environments of the daycare center; a higher score represented a less obesogenic environment in the daycare center.
Built food environment near the home
The built food environment surrounding the home was assessed via questionnaires modified from the Parental Perceptions of Neighborhood Questionnaire developed by Ohri-Vachaspati et al. [27]. For the present study, we selected 10 items using a five-point Likert scale ranging from “not at all” to “very true” that assessed the neighborhood food environment. Thereafter, we summed the responses and calculated the scores to estimate the overall healthy food environment (10 items), access to good-quality food (three items), access to fruits and vegetables (three items), access to low-fat food (three items), and ease of using healthy food delivery services (one item) surrounding the home. A higher score represented a healthier built food environment surrounding the home.
Media environment
The media environment, that is, preschool children’s screen time spent watching TV and online content, and in particular, consuming and/or cooking the viewed content, was assessed via the modified questionnaire originally developed by Ahn et al. [28] for the “Development of Media Recommendation Standards for Healthy Eating Habits” project, which was supported by the Korean Ministry of Health and Welfare in 2019. The questionnaire included 18 questions using a five-point Likert scale inquiring about the usual frequency of watching programs on TV or online platforms and influence of TV food commercials.
Assessment of the overweight or obese statuses of preschool children and mothers
The mothers’ and their preschool children’s anthropometric data were collected via a questionnaire completed by the mothers. The mothers’ BMI values were calculated as follows: weight/height2 (kg/m2). Maternal underweight, normal, overweight, and obese statuses were categorized according to the WHO obesity criteria. Overweight or obesity in preschool children was confirmed if their BMI values exceeded their corresponding age- and sex-specific 85th percentile BMI values based on the childhood and adolescent standard growth charts in South Korea (2017).
Other individual factors pertaining to preschool children and mothers
Other individual factors pertaining to preschool children (including age, sex, sleep duration, and attendance rate of all-day preschool) and mothers (including age, education, household income, and employment status) were collected via the questionnaire completed by the mothers. Regarding the physical activities of preschool children, mothers reported the average time their children spent per week on a variety of recreational activities. Thereafter, metabolic equivalent task hour (MET-h) values for each of these activities were assigned and summed to obtain the average total physical activity (in MET-h/wk).
Statistical analyses
Summary statistics were used to describe the study population with means ± SD for continuous variables and percentages for categorical variables. Subsequently, analysis of variance (ANOVA) was performed to determine the statistical significance of the observed differences in population characteristics across NQ-P-score quartiles for continuous variables and the chi-square test for categorical variables. To evaluate the association of the preschool children’s eating behaviors measured by the NQ-P score with the risk of overweight or obesity, the NQ-P score was categorized into quartiles and odds ratios (ORs), and 95% confidence intervals (CIs) were calculated based on the NQ-P-score quartiles using logistic regression models. A test for trends between the NQ-P score and risk of obesity was conducted using the continuous term of the NQ-P score and its Wald test. NQ-P-score determinants were explored using a linear regression model that included the NQ-P score as a dependent variable and each of the potential determinants, selected a priori, such as the children’s individual, maternal, physical, and media environmental factors, as independent variables. The statistical significance of the NP-Q-score determinants was evaluated using an F-test of a continuous term for continuous variables and that of a categorical term for categorical variables. To adjust for potential confounding factors, we selected variables associated with the preschool children’s NQ-P scores at P < 0.05 in bivariate analyses or well-established risk factors for childhood obesity. Thereafter, the following final list of variables was included in the multivariate (MV) models: age (continuous, years), sex (boys, girls), physical activity (quintiles, MET-h/week), mother’s education (≤ high school, bachelor’s degree, or ≥ master’s degree), and mother’s BMI (< 18.5, ≥ 18.5 and < 25, or ≥ 25 kg/m2). SAS (version 9.4; SAS Inc., Cary, NC, USA) was used for the analyses. All tests were two-sided, and statistical significance was set at P < 0.05.
RESULTS
Characteristics of the subjects
The study population’s characteristics are shown in Table 1. Compared with the preschool children in the lowest NQ-P-score quartile, those with higher NQ-P scores were more likely to be physically active, sleep longer, and be of male sex and less likely to be overweight or obese. Regarding maternal characteristics, the preschool children’s mothers with greater NQ-P scores were more likely to have a higher education degree and lower BMI and less likely to be overweight or obese than those with the lowest NQ-P scores. However, statistical significance was only achieved with obesity-related measures, such as the overweight or obese status of preschool children and mothers (P < 0.01).
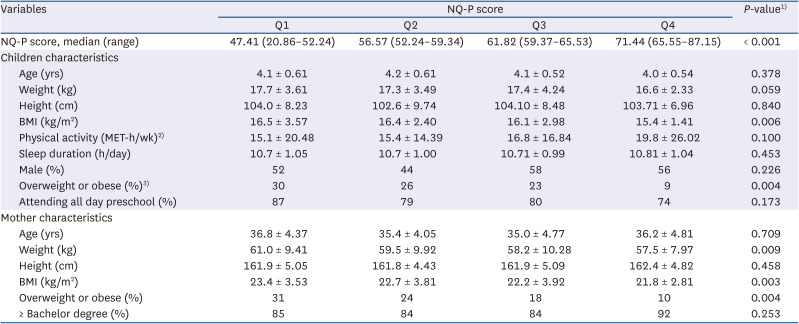
Table 1
Characteristics of preschool children according to the quartiles of the NQ-P score
Values are means ± SD or percentages, otherwise specified.
NQ-P, preschool children’s Nutrition Quotient; BMI, body mass index; MET-h, metabolic equivalent task hours.
1)P-value was tested using the analysis of variance (ANOVA) for continuous variables and the χ2 test for the categorical variables.
2)MET-h represents sum of the MET value of specific physical activities multiplied by the average time spent in each activity.
3)Children was defined as overweight or obese if their BMI is above their corresponding age- and gender- specific 85th percentile BMI values based on the Childhood and Adolescent standard growth charts in South Korea (2017).
![]()
Associations of preschool children’s NQ-P scores and their overweight or obese statuses
On analyzing the associations between the preschool children’s NQ-P scores and their overweight or obese statuses (Table 2), those with greater NQ-P scores were at a significantly lower risk of overweight or obesity (P for trend < 0.001). The MV-adjusted OR comparing preschool children in the highest NQ-P-score quartile (Q4) with those in the lowest NQ-P-score quartile (Q1) was 0.30 (0.11–0.63). In subsequent analyses, associations with individual subcomponents comprising overall NQ-P scores were examined to identify specific eating behaviors that might have contributed most significantly to the risk of overweight or obesity. A lower risk of overweight or obesity was suggested to be associated with greater consumption in the “balance” dimension (P for trend < 0.05) and being in a healthy environment (P for trend < 0.01), although quartile-specific comparisons were only significant with “environment.” Eating in moderation was not associated with the risk of overweight or obesity.
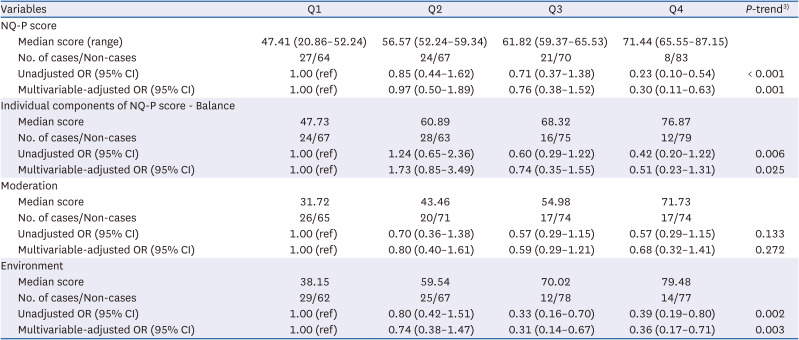
Table 2
OR1) and 95% CIs of preschool children’s overweight or obese status2) according to quartiles of the NQ-P score
OR, odds ratio; CI, confidence interval; NQ-P, preschool children’s Nutrition Quotient; BMI, body mass index.
1)MV-model adjusted for preschool children’s age (continuous, years), sex (boys, girls), and physical activity (quartiles, mets-h/wk) and mother’s education (≤ high school, bachelor degree, ≥ master degree), household income (< 20th, 20th-<40th, 40-<60th, 60-<80th, ≥ 80th percentile), and mother’s BMI (< 18.5, 18.5-<25, ≥ 25 kg/m2).
2)Children was defined as overweight or obese if their BMI is above their corresponding age- and gender- specific 85th percentile BMI values based on the Childhood and Adolescent standard growth charts in South Korea (2017).
3)P-trend was tested from the model with a continuous term of NQ-P score and using the Wald test of it.
![]()
Associations of preschool children’s NQ-P scores and their socio-ecological determinants
Tables 3, 4, 5, 6 show the results for the associations of NQ-P scores with the children’s individual, maternal, and parenting factors as well as the physical and media-related environmental factors. Pre-school children’s individual factors, such as age, sex, physical activity, sleep duration, or the number of siblings, were not associated with NQ-P scores (Table 3). In contrast, the NQ-P score exhibited a significantly inverse association with household income (MV-adjusted mean of the NQ-P score ≥ 80th percentile vs. < 20th percentile: 61.4 vs. 64.6) and the obese statuses of the mothers (MV-adjusted mean of the NQ-P score BMI > 30 kg/m2 vs. < 18.5 kg/m2: 59.0 vs. 57.2) (all P for trend < 0.05) but not with their age, education, or employment status (Table 3).
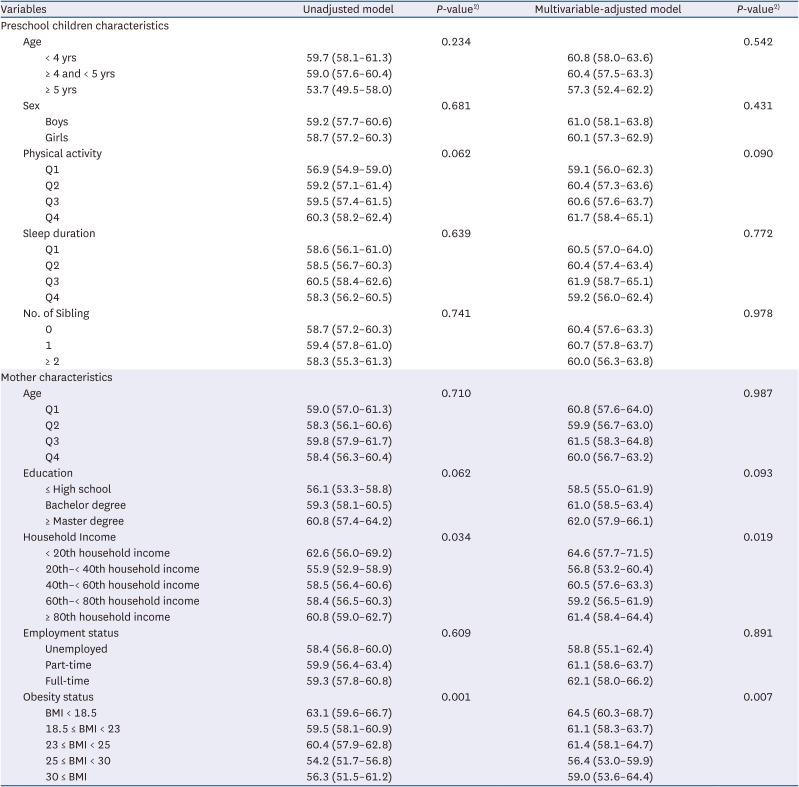
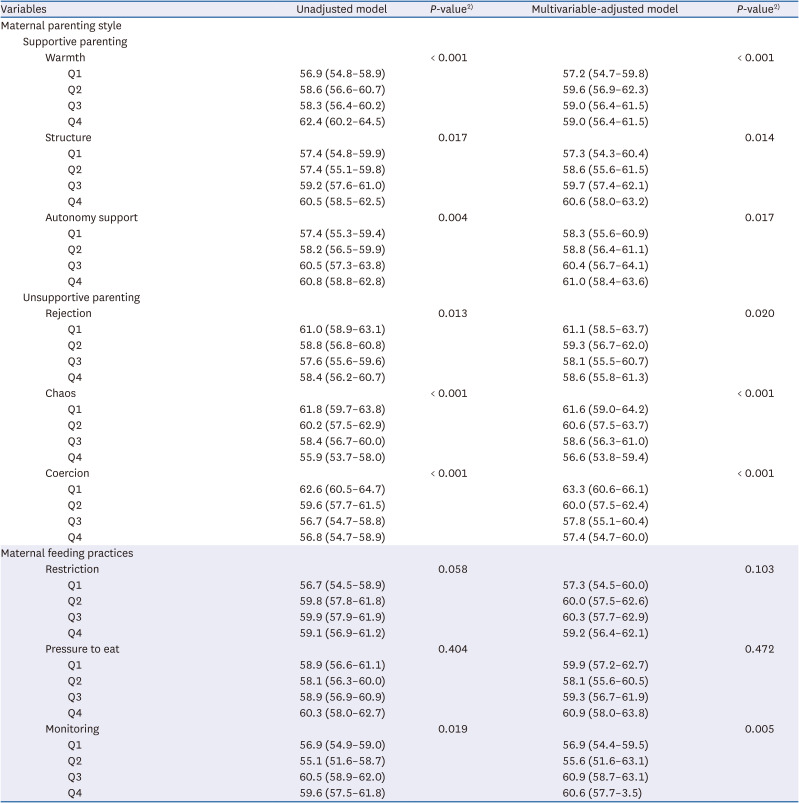
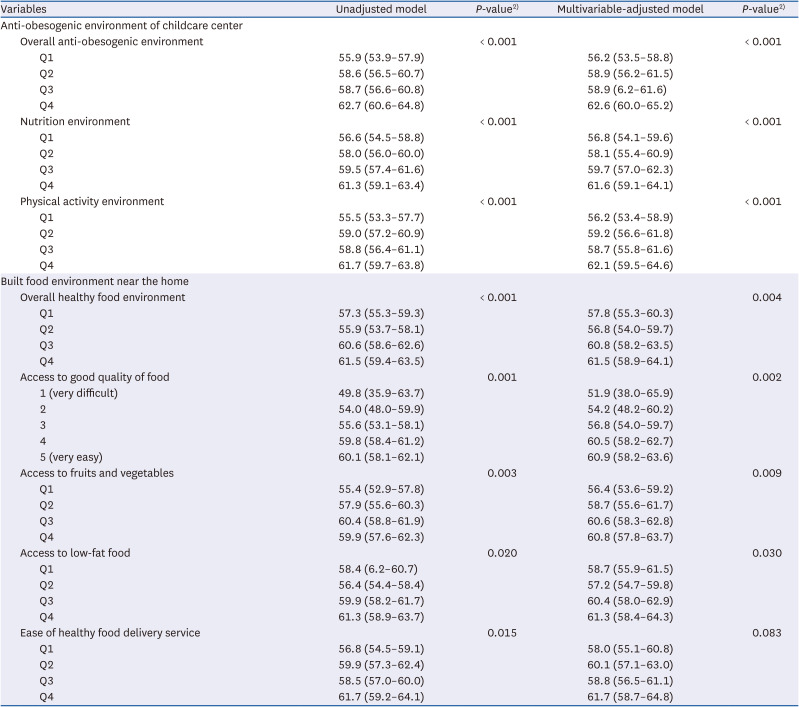
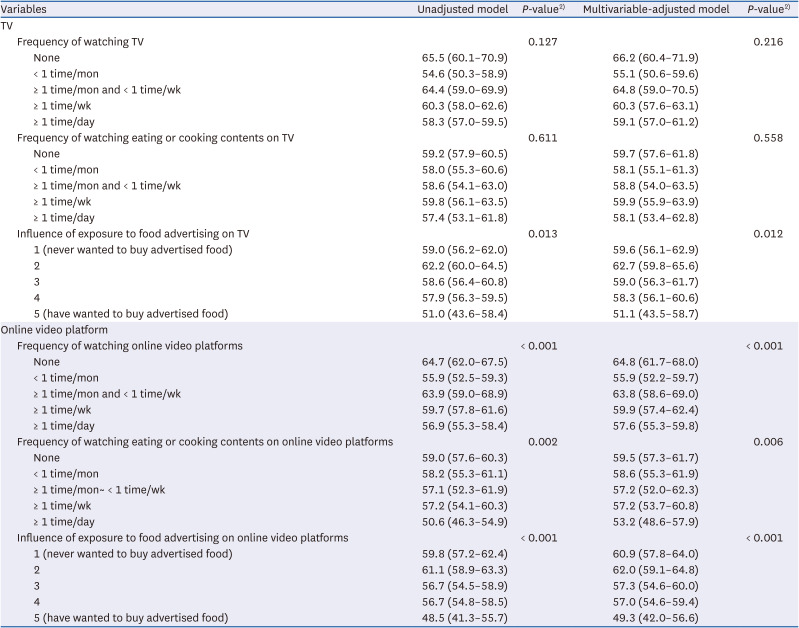
Table 3
Mean1) and 95% CIs of the NQ-P score across preschool children’s and mother’s characteristics
CI, confidence interval; NQ-P, preschool children’s Nutrition Quotient; BMI, body mass index.
1)MV-model adjusted for preschool children’s age (continuous, years), sex (boys, girls), and physical activity (quartiles, mets-h/wk) and mother’s education (≤ high school, bachelor degree, ≥ master degree), household income (< 20th, 20th-<40th, 40-<60th, 60-<80th, ≥ 80th percentile), and mother’s BMI (< 18.5, 18.5-< 25, ≥ 25 kg/m2).
2)P-values were calculated using an F-test, using a continuous term for continuous variables or a nominal term for categorical variables.
![]()
Table 4
Mean1) and 95% CI of the NQ-P score across maternal parenting styles and feeding practices
CI, confidence interval; NQ-P, preschool children’s Nutrition Quotient.
1)Multivariate model adjusted for preschool children’s age (continuous, years), sex (boys, girls), and physical activity (quartiles, mets-h/wk) and mother’s education (≤ high school, bachelor degree, ≥ master degree), household income (< 20th, 20th-< 40th, 40-< 60th, 60-< 80th, ≥ 80th percentile), and mother’s body mass index (< 18.5, 18.5-<25, ≥ 25 kg/m2).
2)P-values were calculated using an F-test, using a continuous term for each factor of maternal parenting styles and feeding practices.
![]()
Table 5
Mean1) and 95% CIs of the NQ-P score according to preschool children’s health supportive physical environment
CI, confidence interval; NQ-P, preschool children’s Nutrition Quotient.
1)Multivariate model adjusted for preschool children’s age (continuous, years), sex (boys, girls), and physical activity (quartiles, mets-h/wk) and mother’s education (≤ high school, bachelor degree, ≥ master degree), household income (< 20th, 20th-<40th, 40-<60th, 60-<80th, ≥ 80th percentile), and mother’s body mass index (< 18.5, 18.5-< 25, ≥ 25 kg/m2).
2)P-values were calculated using an F-test, using a continuous term for each physical environmental factor.
![]()
Table 6
Mean1) and 95% CIs of the NQ-P score according to preschool children’s sedentary media environment (screen time on TV and online platform)
CI, confidence interval; NQ-P, preschool children’s Nutrition Quotient.
1)Multivariate model adjusted for preschool children’s age (continuous, years), sex (boys, girls), and physical activity (quartiles, mets-h/wk) and mother’s education (≤ high school, bachelor degree, ≥ master degree), household income (< 20th, 20th-< 40th, 40-< 60th, 60-< 80th, ≥ 80th percentile), and mother’s body mass index (< 18.5, 18.5-< 25, ≥ 25 kg/m2).
2)P-values were calculated using an F-test, using a continuous term for each sedentary media environmental factor.
![]()
Analyses of maternal parenting styles and feeding practices (Table 4) revealed that both maternal parenting styles and feeding practices had strong associations with the NQ-P score. The NQ-P score exhibited a significantly positive association with increasing levels of “warmth” (MV-adjusted mean of the NQ-P score Q4 vs. Q1: 59.0 vs. 57.2), “structured” (MV-adjusted mean of the NQ-P score Q4 vs. Q1: 60.6 vs. 57.3), and “autonomy-supportive” parenting styles (MV-adjusted mean of the NQ-P score Q4 vs. Q1: 61.0 vs. 58.3) (all P for trend < 0.05). In contrast, significant inverse associations of NQ-P scores with greater levels of “rejection” (MV-adjusted mean of the NQ-P score Q4 vs. Q1: 58.6 vs. 61.1), “chaotic” (MV-adjusted mean of the NQ-P score Q4 vs. Q1: 56.6 v. 61.6), and “coercive” parenting styles (MV-adjusted mean of the NQ-P score Q4 vs. Q1: 57.4 vs. 63.3) (all P for trend < 0.05) were observed. Among the maternal feeding practices, significant positive associations were observed with maternal monitoring feeding practices (MV-adjusted mean of the NQ-P score Q4 vs. Q1: 60.6 vs. 56.9) (P for trend < 0.01). No associations with “maternal restriction” or “pressure to eat” were noted.
Table 5 shows the associations of the NQ-P score with the preschool children’s physical environments. Healthy supportive environments in childcare centers demonstrated significantly positive associations with the NQ-P score (MV-adjusted mean of the NQ-P score Q4 vs. Q1 = 62.6 vs. 56.2 for an overall anti-obesogenic environment, 61.6 vs. 56.8 for a nutritionally supportive environment, and 62.1 vs. 56.2 for a physical activity supportive environment) (all P < 0.001). Similarly, analyses of the built food environment surrounding the home revealed that a healthy food environment was associated with a higher NQ-P score (MV-adjusted mean of the NQ-P score Q4 vs. Q1: 61.5 vs. 57.8, P for trend < 0.01). Specifically, better access to “good-quality food,” “fruits and vegetables,” and “low-fat food” was significantly associated with greater NQ-P scores (MV-adjusted mean of the NQ-P score Q4 vs. Q1: 60.9 vs. 51.9 for “access to good-quality food,” 60.8 vs. 56.4 for “access to fruits and vegetables,” and 61.3 vs. 58.7 for “access to low-fat food”) (P for trend < 0.05). However, no association between NQ-P scores and the ease of healthy-food delivery service use was observed.
On investigating media influences on NQ-P scores (Table 6), online video platforms were suggested to exert a stronger influence than TV. The frequencies of watching TV and viewing eating- or cooking-related TV content were not associated with the NQ-P score, although the preschool children who tended to request food products shown in TV commercials had lower NQ-P scores (MV-adjusted mean of the NQ-P score Q4 vs. Q1: 51.1 vs. 59.6) (P for trend < 0.05). However, overall exposure to online video platforms was significantly associated with lower NQ-P scores (P for trend < 0.01; MV-adjusted mean of the NQ-P score Q4 vs. Q1: 57.6 vs. 64.8 for “frequency of watching online video platforms,” 53.2 vs. 59.5 for “frequency of watching online eating or cooking content,” and 49.3 vs. 60.9 for “influence of online video-platform food commercials”). However, for the mothers, neither watching TV nor using online video platforms, regardless of the program type, was associated with the NQ-P score (Supplementary Table 1).
DISCUSSION
In this cross-sectional study that sought to identify eating behaviors associated with the risk of overweight or obesity and its socio-ecological determinants among preschool children, greater NQ-P scores were significantly associated with a lower risk of overweight or obesity. This dose–response inverse trend was consistently observed, especially with greater consumption in the “balance” dimension and having a healthy environment among all behavioral dimensions that contribute to the NQ-P score. Interestingly, the NQ-P score was more significantly associated with maternal, physical, and media-related environmental factors than with the child’s individual characteristics. For instance, while no associations were observed with the children’s individual factors, the NQ-P score exhibited significantly inverse associations with maternal obesity and household income; positive associations with the monitoring of feeding practices and positive parenting styles, such as the “warm,” “structured,” and “autonomy-supportive” approaches; and inverse associations with the “rejection,” “chaotic,” and “coercive” parenting approaches. A greater NQ-P score was also observed among children who attended childcare centers that provided greater support in terms of nutrition and physical activity or had a built food environment near their homes that offered greater access to healthier foods. Finally, the NQ-P score was also significantly inversely associated with increased overall viewing and, in particular, consumption and/or cooking of content displayed on online video platforms; nonetheless, no association observed with TV viewing.
To our knowledge, three cross-sectional studies on preschool children in South Korea have examined the association between NQ-P scores and the risk of overweight [589]. Contrary to our inverse association of NQ-P scores with the risk of overweight, these previous studies reported no association. However, none of them controlled for both child and maternal confounding factors, thus underscoring the significance of our results. Substantial evidence supports the results of our study. Healthy eating behaviors characterized by the NQ-P score, such as consuming a variety of foods, limiting high-fat intake, consuming processed energy-dense foods, or avoiding skipping meals, are well-known to lead to balanced nutrient and energy consumption and improved overall diet quality [21]. A large meta-analysis [29] and most longitudinal studies on children [3031], though not all [3233], consistently reported the benefits of healthy eating behaviors or the consumption of high-quality diets in lowering childhood-obesity risk. Our observations align with the existing sequential axis of “healthy eating behavior,” “high quality of diet,” and “obesity prevention,” [34] and further corroborates the usefulness of the NQ-P score in early obesity-intervention programs.
Interestingly, in our secondary analysis examining associations with the NQ score’s sub-behavioral dimensions, we observed various associations with the risk of overweight or obesity. The inverse association with the risk of overweight or obesity was consistently observed with the “balance” and “environment” scores, but not with the “moderation” score. The possible explanation for this observation is unclear. However, evidence indicates that eating behavioral traits associated with obesity potentially exhibit age-related variations with increasing food experiences and self-control ability. For example, a study on children aged 6–8 years reported prominent associations with “moderation” and “regularity” scores, while consumption in the “moderation” and “diversity” dimensions stood out in another study on children aged 9–11 years [35]. However, these studies’ results focused on preschool-aged children, whereas the study population in our study was limited and mixed. An unexpected positive association with the “balance” score [9], an inverse association with the “moderation” score [8], and no association with the “environment” score [589] have previously been observed, exhibiting inconsistency with our results. Further large, prospective investigations are warranted to confirm our findings.
Eating behavior is a complex trait that is influenced by multiple personal, interpersonal, and socio-environmental factors [713]. In our analyses investigating the multifaceted factors of eating behaviors, an association between a lower NQ-P score and increased maternal BMI was noted. Mothers with overweight or obesity tend to be less knowledgeable regarding nutrition [36] and consume diets low in fruits, vegetables, and whole grains [37]. Considering that mothers are the primary caregivers who manage the home food environment, determine children’s exposure to food, and serve as “eating” role models [38], our results potentially suggest the negative influence of unfavorable eating behaviors or home food environments conferred by mothers with overweight or obesity on their children’s eating behaviors. To date, of the studies that have explored the parental factors of preschool-aged children’s eating behavior [51011], only one has exclusively reported an association with maternal BMI values [10]. The results were consistent with those of the present study, suggesting lower NQ scores of children with increasing maternal BMI values, although the results were merely marginally significant (P = 0.056) [10]. Similarly, other studies on parental BMI, > 90% of which were mothers, reported lower fruit and greater sugar-sweetened beverage consumption among girls aged 3 years with increasing parental BMI [11].
As additional maternal factors, we further explored both maternal parenting styles and feeding practices, given their direct impact on child eating behavior. Parenting style refers to the general behavioral strategy used to modify or maintain a child’s eating behavior, whereas feeding practices represent specific rules that parents apply to control when, what, and how to eat [14]. In the present study, significant associations between NQ-P scores and all maternal parenting styles were identified. Positive and inverse associations with supportive (warm, structure, and autonomy support) and unsupportive (rejection, chaos, and coercion) parenting styles were noted, respectively. Our results potentially indicate that moderately restrictive parenting styles involving encouragement and less pressure may create a positive, emotional tone and social context for eating occasions and family eating environments and contribute to establishing desirable eating behaviors in children [1415]. Interestingly, this result markedly coincides with the positive association observed with “monitoring feeding practice” in this study but not with other more forceful feeding practices, such as “coercion” and “pressure to eat.” In agreement with these results, authoritative parenting, characterized by a nurturing and supportive approach yet setting limits for children, has previously been reported to be associated with positive eating habits, whereas child abuse or neglect has been associated with dietary problems [2339].
Childcare centers offer childcare for preschool-aged children of working parents and have manifested considerable growth in response to an increasing number of dual-working parents and government support [40]. This socio-environmental change has redirected extensive public health attention toward childcare centers as the new intervention frontier to foster healthy behaviors [6]. Repeated exposure to healthy foods and nutritional education programs at the childcare center can increase familiarity with foods, ultimately enhancing children’s acceptability of, attitudes toward, and preference for healthy foods before they establish their eating behaviors [15]. The greater NQ-P scores observed among preschool-aged children who attended childcare centers, which provide greater nutritional and physical-activity support, upheld this notion. These results are also consistent with the most recent large, qualitative reviews that examined the effectiveness of promoting healthy eating programs in childcare settings [6] and found significant improvements in children’s dietary intakes and food choices via interventions involving targeted diets, food provision, education, physical activity at an individual level, and parental engagement [6]. Similar results were observed in a subsequent randomized controlled trial of 433 preschool children wherein a greater intake of fruits and vegetables was reported in children who attended childcare centers that offered physical activity and healthy-eating programs than in those who did not [41].
In the present study, better access to “healthy food ingredients,” “fruits and vegetables,” and “low-fat food” near the home was significantly associated with greater NQ-P scores. The built food environment in residential areas serves as an influential junction determining access to food, thus affecting food exposure, availability, and intake [42]. Indeed, a high density of fast-food-type restaurants and convenience stores as well as a low density of healthy food outlets near the home were negatively associated with fruit and vegetable consumption and fiber intake and positively associated with the proportion of energy obtained from fat and sugar-sweetened beverages [4344]. Similarly, a previous study on adolescent and preschool-aged children reported that proximity to corner stores played a significant role in determining unhealthy snacking [45]. Our results further confirm that a limited healthy food environment near the home may aggravate the pediatric risk of fostering poor eating behaviors and potentially contribute adversely to the development of early childhood obesity [46].
Currently, children are exposed to various media platforms, including modern digital devices (tablets, smartphones, computers, etc.) and traditional TV [1617]. These media platforms broadcast extensive food-related content [47] and unhealthy food advertisements [48] that serve as external unhealthy food stimuli. Indeed, substantial evidence has demonstrated the direct deleterious effect of children’s media usage and exposure on actual food recalls, attitudes, preferences, and intakes [1920]. Our results, in which relatively low NQ-P scores were associated with an increased frequency of viewing online video platforms and being responsive to their content, are consistent with those reported in previous literature.
However, in the present study, associations were generally apparent only with online video platforms, which was unexpected. No prior study on preschool children was available for comparison because the present study is the first to associate various media platform types with the eating behaviors of preschool children. Nonetheless, consistent with our results, a previous study on adults in Korea reported a more pronounced association between binge alcohol consumption and watching online eating programs and further reported no association with viewing eating programs on TV [49]. One possible explanation for this is that child content on TV is more likely to be regulated by the government than that on online media channels, leaving more aggressive, stimulus food-related content and unhealthy food advertisements on online media channels [47]. In addition, a recent study reported a sizeable number of smartphone and tablet PC users among > 90% and > 60% of Korean preschool children in 2017 and 2018, respectively [16]. The frequency of and time spent on digital devices gradually increased and surpassed those of TV in 2017–2018 [16]. Our findings potentially indicate the greater appeal of online media to preschool children based on their ease with and increase in digital-device usage than with the traditional TV platform, thus negatively affecting their eating behaviors. However, in our study, the preschool children’s mothers who frequently used online platforms were found to be more overweight and less educated, phenomena that tend to be associated with obesogenic home environments and parenting styles. Our positive association between viewing online platforms and unhealthy eating behaviors could be alternatively explained as unmeasured obesogenic environments reflected by watching online platforms. Considering the paucity of data on the influence of online media platform on establishing eating behaviors early in life, further research is warranted.
This study has several limitations that warrant discussion. First, the cross-sectional nature of the present study limits the inferring of causality to the results. Second, the preschool children’s data, including dietary behaviors, weight, height, and other lifestyle factors, were collected from their mothers, who could have incurred possible measurement errors in recording their children’s data. Nonetheless, mothers have near-complete observational access to their children in a wide range of situations, the extent of which increases with younger age. Substantial evidence supports the accuracy of mothers’ reports on their children’s diet, weight/height, and other lifestyle factors [5051]. Third, despite the comprehensiveness of the NQ-P score in incorporating the “balance,” “moderation,” and “environmental” dimensions of eating behavior, it does not account for the psychological aspects of eating behaviors, such as emotional, restrained, and uncontrolled eating. Fourth, despite the non-consideration of socioeconomic status during the enrollment of study participants, the majority of our study population exhibited relatively high education (> 85% with a bachelor’s degree) and income (> 60% 60th national income level) levels, thus possibly limiting the generalizability of our findings. Finally, unmeasured and residual confounding factors, such as those related to the children’s appetites, cannot be ruled out.
Nonetheless, the NQ-P score used in the present study originated from culturally adapted, validated questionnaires assessing multiple dimensions of eating behaviors, especially in Korean preschool children. Therefore, it not only ensured the quality of the dietary behavioral data of preschool children but was also able to investigate the overall and sub-dimensional aspects of eating behaviors. To our knowledge, the present study is the first to apply socio-ecological approaches to investigate the determinants of childhood eating behaviors in Korea. Thus, our study’s results are at the novel intersection of nutrition, pediatrics, family and behavioral science, and public health. Finally, widespread data collection on child and maternal demographics, socioeconomics, anthropometric factors, and lifestyles can help control both child and maternal risk factors for early childhood obesity.
In summary, the inverse association between the NQ-P score and risk of overweight or obesity in preschool children confirms the significance of healthy eating behaviors in the prevention of early childhood obesity. Healthy eating behaviors among preschool children in Korea, as measured by the NQ-P score, were associated with their mothers’ BMI values, parenting and monitoring feeding styles, the physical environments of childcare centers or residential areas, and media environments, particularly online video platforms. These findings underscore the diverse intervention strategies integrating multi-level familial, physical, and media environmental factors to effectively produce desirable eating behaviors in preschool children. Notwithstanding, large prospective studies are warranted to confirm these findings.
 XML Download