

 PDF
PDF Citation
 Print
Print


INTRODUCTION
Dark tea belongs to the post-fermented tea category and is widely consumed in China and many other countries [1]. Tibetan tea, also known as “Kangzhuan tea,” is a typical dark tea that has been used in Tibet for nearly 1,000 years [2]. It is made from the small-leaf species (Camellia sinensis var. sinensis) and is produced in Ya’an, Sichuan Province, China. The production process of Tibetan tea mainly includes inactivation of enzymes, kneading, pile fermentation, pressing and low temperature drying. Tibetan tea is consumed not only for their beverage purposes but also for traditional use in the prevention of various diseases [3]. Due to its outstanding health benefits, dark tea has attracted a widespread attention during recent years. Numerous studies have confirmed the potential health benefits of Pu-erh tea, with biological activities such as weight gain reduction, improving digestion, regulating cholesterol metabolism and protecting the nervous system [4]. However, there are relatively few studies on the chemical composition and biological activity of Tibetan tea.
These health benefits of dark teas can be attributed to its diverse phytochemical composition [5]. Liquid chromatography-mass spectrometry (LC-MS) based untargeted metabolomics is extensively used to detect unknown metabolite components in food products [678]. To identify known metabolites, the common approach is to match a library of standard spectra based on the exact mass of the precursor ion and tandem mass spectra (MS2 spectra of cleaved fragments). Although previous studies have yielded some results on the phytochemical composition of Tibetan tea, such as 612 non-volatile and 78 volatile metabolites were detected in Tibetan tea [3], detecting unknown metabolites that are not in the database remains a challenge. Under the fermentation of microorganisms, many components of raw tea such as tea polyphenols undergo oxidation, condensation and hydrolysis to produce gallic acid, theaflavin and other metabolites [9]. Consequently, there is still a knowledge gap in the chemical space of Tibetan tea. To address this limitation, in silico tools such as Sirius, MetFrag and CFM-ID have been developed for the rapid annotation of large volumes of MS spectral data [10]. Recently, Zhou and colleagues [11] used the knowledge-guided multilayer network (KGMN) based recursive algorithm for unknown metabolites identification. The algorithm integrates a knowledge-based metabolic response network, a knowledge-guided MS2 similarity network, and a global peak relationship network. This strategy enables the effective annotation of thousands of unknown metabolites using a few known compounds as “seeds.”
Accumulating evidence suggests that Tibetan tea has antioxidant, anti-radiation, weight reducing, lipid-lowering and digestive system regulation effects [91213]. It may significantly reduce blood triglycerides and increase high-density lipoprotein levels, and promote excretion of cholesterol and lipid compounds [14]. However, the molecular mechanisms of its antioxidant and lipid lowering effects are not fully understood. In this study, the chemical composition of Tibetan tea extract (TTE) was firstly detected using non-targeted LC-MS technique. The KGMN method was used to annotate the unknown metabolic components with high coverage. Secondly, the effects of TTE on body weight, serum and liver antioxidant capacity of C57BL/6J mice were investigated. Finally, transcriptomic techniques were used to explore the effect of TTE on the expression of genes related to hepatic antioxidation and lipid metabolism in mice. This study provides a deeper understanding of the chemical composition and molecular mechanisms of the antioxidant and lipid-lowering effects of Tibetan tea.
Go to : 
MATERIALS AND METHODS
Preparation of tea extract
Green tea and Tibetan tea samples with the same raw materials were provided by Ya’an Youyi Tea Co., Ltd (China). The raw material is first-class tea with one bud and one leaf, which has been stored in a ventilated and dry warehouse at 24–28°C for 1 yr. To prepare the extracts, 10 g of each tea sample was crushed and passed through an 80-mesh sieve. Next, 20-fold volume of the boiling water was added to the powder and was boiled for 20 min, with an interval after 10 min. The supernatant was collected after centrifugation at 5,000 rpm for 10 min, and then concentrated under reduced pressure using a vacuum rotary evaporator. Finally, the concentrated green tea extract (GTE) and Tibetan tea extract (TTE) were freeze-dried at −10 pa, −55°C into powder, and stored at 4°C for further exploration.
LC-MS-based characterization
The chemical composition of the extracts was deciphered using an ultra-high performance liquid chromatography (UHPLC) system (Shimadzu, Japan) coupled to a quadrupole-time of flight mass spectrometer (Q-TOF/MS, X500, Toronto, Canada). Chromatographic separation of the tea extract was done using an Acquity UPLC BEH C18 column (100 × 2.1 mm, 1.7 μm; Waters, Manchester, UK). Water with 0.1% (v/v) formic acid and acetonitrile were used as mobile phase A and B, respectively, for chromatographic elution. The elution program was performed from 0–7 min with a linear increase in phase B from 8% to 25%, followed by a linear increase to 98% at 9.5 min and maintained for 1 min. Phase B was adjusted to 8% at 10.6 min for re-equilibration and maintained for 3.6 min. The flow rate was set at 0.30 mL/min. The injection volume was 3 μL. Electrospray ionization (ESI) was performed in negative ionization mode. The mass reading range was set at 100–1,000 m/z. The data is transformed into a peak table by msdial software [15], and then calculated through the server (http://metdna.zhulab.cn/).
Ethical statements
C57BL/6J mice were purchased from SPF Biotechnology Co. Ltd (Beijing, China). All experiments procedures were executed following the Guide for the Care and Use of SPF Biotechnology Co. Ltd, and were approved by the appropriate ethics committee (AWE2022021401).
Animals and experimental design
The mice (15–18 g, male) were kept at 22°C under a 12,-h light/dark cycle with unlimited access to water and standard rodent diet. After one week of acclimation, 24 mice were randomly divided into 3 experimental groups: control group (H), Tibetan tea group (T) and green tea group (G). The mice in T and G groups were orally treated with TTE and GTE, respectively, at the dose of 100 mg/kg body weight, while mice in H group were treated with ddH2O with same volume. Body weights were monitored and recorded after every 2 days throughout the experimental period.
The mice were sacrificed on day 15, the liver tissue was collected and rinsed with sterile normal saline, and then stored in liquid nitrogen. The eyeballs of mice were removed to take blood, and the blood samples were left at 37°C for more than 1 h, then centrifuged at 10,000 rpm for 10 min, and serum was collected to detect antioxidant capacity.
Determination of total antioxidant capacity (T-AOC) in mice
To determine the T-AOC, 0.1 g of liver tissue was added into 1.0 mL of pre-cooled T-AOC extract and homogenized at 4 °C for 1 min. Centrifuged the mixture at 10,000 rpm for 5 min, and retained the supernatant. Preconditioned liver tissue and serum samples were performed according to the instructions of the T-AOC kit (Solarbio, Beijing, China), and each group was repeated 3 times. The T-AOC value were calculated using the standard curve (Y = 10.829X + 0.0146, R2 = 0.9995).
Determination of superoxide dismutase (SOD) activity in mice
The pretreated liver homogenate and serum samples were subjected to SOD activity, where assay was performed according to the instructions of the SOD activity kit (Solarbio). The SOD activity of the serum and liver tissue was measured.
RNA isolation to construct library for RNA-seq analyses
Three representative liver samples were selected from each group (LH, LT, LG) and follow the kit instructions to use Trizol reagent for total RNA extraction (Invitrogen, Carlsbad, CA, USA). The quality and quantity of RNA was determined and libraries were constructed, which were then sequenced using the Illumina HiSeq X Ten platform to obtain paired-end reads of 150 bp in size.
RNA-seq data assembly and functional assignment were executed following the method as described earlier [16]. Differential expression analysis was performed for both groups/conditions (in duplicates) using the DESeq2 R package (1.16.1). Gene Ontology (GO) analysis was performed for differentially expressed genes (DEGs) using the clusterProfiler R package and corrected for gene length bias. Corrected GO terms with P < 0.05 were considered to be enriched for DEGs. Statistical enrichment of DEGs with Kyoto Encyclopedia of Genes and Genomes (KEGG) pathways was tested using the clusterProfiler R package.
Quantitative real-time polymerase chain reaction (qRT-PCR)
The DEGs obtained from RNA-Seq results were verified by qRT-PCR. From DEGs, genes related to antioxidant and lipid metabolism were selected respectively (copper/zinc superoxide dismutase [Cu/Zn-SOD], manganese superoxide dismutase [Mn-SOD], plasma glutathione peroxidase [GSH-Px], peroxisome proliferator-activated receptor alpha [PPAR-α], low-density lipoprotein receptor [LDLR], carnitine palmitoyltransferase-1a [CPT-1a], CCAAT/enhancer binding proteins alpha [C/EBP-α], fatty acid synthase [FAS], and sterol regulatory element-binding protein-1c [SREBP-1c]).
Using high-quality RNA extracted from the liver tissue as a template, complementary DNA (cDNA) was obtained by reverse transcription. Then, the real-time quantitative polymerase chain reaction reaction was performed, and the changes of gene expression were detected by 2−ΔΔCt method, and the reference was β-actin expression and normal mice. The sequences of primers used in this procedure are shown in Table 1.
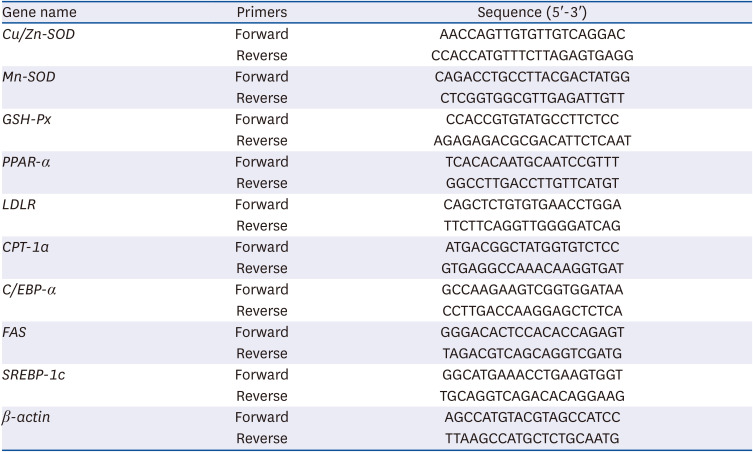
Table 1
Primers sequences for real-time quantitative polymerase chain reaction
Cu/Zn-SOD, copper/zinc superoxide dismutase; Mn-SOD, manganese superoxide dismutase; GSH-Px, Plasma glutathione peroxidase; PPAR-α, peroxisome proliferator-activated receptor alpha; LDLR, low-density lipoprotein receptor; CPT-1a, carnitine palmitoyltransferase-1a; C/EBP-α, CCAAT/enhancer binding proteins alpha; FAS, fatty acid synthase; SREBP-1c, sterol regulatory element-binding protein-1c.
![]()
Statistical analyses
The data are shown as the mean ± SD of the three repeated experiments. One-way analysis of variance and Tukey’s post hoc test were performed by GraphPad Prism 6.0 (San Diego, CA, USA). P-values < 0.05 indicated significant data.
Go to :
RESULTS
Characterization of chemical composition of TEE
In this study, we utilized a non-targeted UPLC-Q-TOF mass spectrometry method in conjunction with KGMN analysis to identify the compounds present in Tibetan tea. After conducting 17 recursive steps (Fig. 1), we successfully annotated a total of 42 flavonoids.
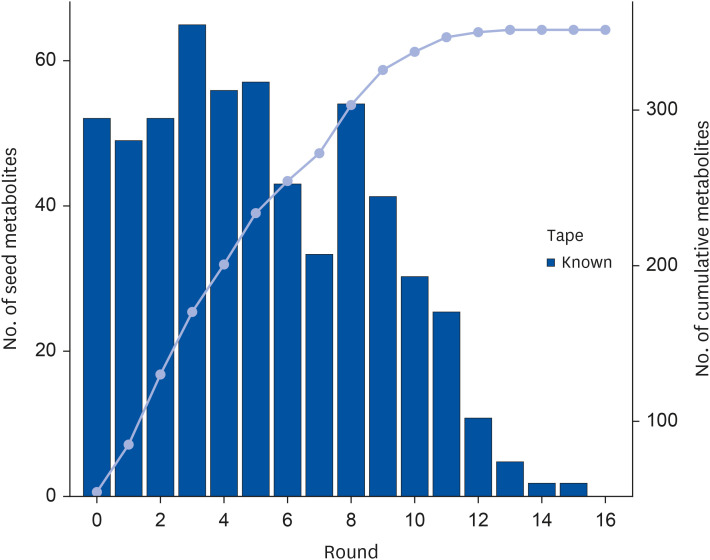
These flavonoids annotated information mainly include id_kegg, name, formula, confidence_level, smiles, inchikey, isotope. Unlike the flavonoids previously discovered in dark tea, the flavonoids obtained in this study were primarily glycosylated flavonoids. In addition, we quantified the total polyphenol content using the Folin-Ciocalteu colorimetric method, which yielded a value of 2.98 mg/g. Although this result is slightly lower than previously reported [3], it still provides useful information on the phytochemical composition of Tibetan tea.
Traditional identification methods have several limitations. If the component being searched for is not in the database, it can lead to a failed search. To address these issues, researchers have developed the KGMN technology, which enables the identification of unknown metabolites from known metabolites and significantly improves the accuracy of metabolite identification. The technique begins with seed metabolites identified from a library of standard spectra and constructs a secondary mass spectrometry map similarity network based on an extended metabolic reaction network [11]. The strategy allows for the linking of all known and unknown metabolites in the metabolomics mass spectrometry data through multiple iterations and circular amplification algorithms until no new annotated tea metabolites are available. Our findings contribute to the growing body of knowledge on the phytochemical composition of Tibetan tea. Furthermore, these findings suggest potential health benefits for consumers.
Effect of tea extract on body weight of mice
At the beginning, there was no significant difference in the mean body weight of the mice in each group (Fig. 2A). During the experimental period, no significant difference was shown in food and water intake among mice in different groups. However, compared with the H group (12.74%), the weight gain ratio of mice in the G (5.69%) and T (8.66%) groups was much smaller. After treated with ddH2O, GTE and TTE for 14 days, the body weight of mice in the H group was the highest, whereas that of the G and T groups was lower than that of the H group.
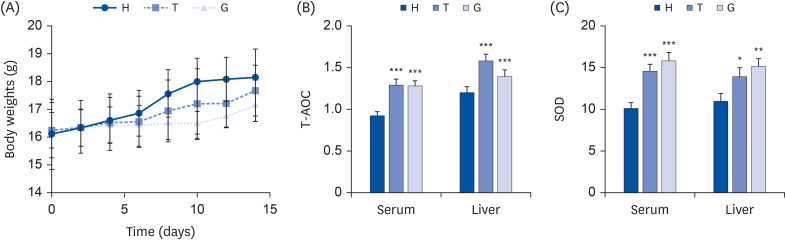 | Fig. 2Effects of green tea and Tibetan tea on the body parameters of mice. Mice were randomly divided into 3 experimental groups: ddH2O group (control; H), Tibetan tea extract group (T), Green tea extract group (G). (A) Body weights. (B) The activity of T-AOC in serum and liver (serum: U/mL and liver: U/g). (C) SOD activity in serum and liver (serum: U/mL and liver: U/g). The data are expressed as the mean ± SD.T-AOC, total antioxidant capacity; SOD, superoxide dismutase.
*P < 0.05, **P < 0.01, ***P < 0.005 vs. the H group.
|
T-AOC of serum and liver tissue in mice
The T-AOC activity in both the serum and liver tissue of mice in the H group was found to be the lowest, while the T-AOC activity in the G and T groups was significantly increased (Fig. 2B). Moreover, there was no significant difference in T-AOC activity of serum samples between T group (1.30 ± 0.06 U/mL) and G group (1.29 ± 0.05 U/mL). Compared with H group (1.19 ± 0.08 U/g), the T-AOC activity in the liver tissue of the T group (1.58 ± 0.07 U/g) and G group (1.39 ± 0.08 U/g) was significantly higher (Fig. 2B).
SOD activity of serum and liver tissue in mice
The serum SOD activity of mice in the H group (10.12 ± 0.63 U/mL) was the lowest, whereas significantly higher in T (15.94 ± 0.91 U/mL) and G (14.69 ± 0.67 U/mL) groups (Fig. 2C). The SOD activity of liver tissue in T (14.06 ± 0.97 U/g) and G (15.29 ± 0.85 U/g) groups was significantly higher comparing with H group (11.07 ± 0.84 U/g). In addition, the serum SOD activity of the mice in the T group was higher than that in the G group. On the contrary, the SOD activity in the liver tissue of the T group mice was lower than that of the G group (Fig. 2C).
Transcriptome of the liver tissue
Transcriptome analysis of the liver tissues was performed to elucidate the beneficial effects and their underlying molecular mechanisms of TTE and GTE in mice. RNA from three groups of mice liver (treated with ddH2O, Tibetan tea extract and green tea extract at the dose of 100 mg/kg body weight, respectively), with three livers in each group, were sequenced, generating on a total of 1,166,084,400 raw sequencing reads and 1,125,532,496 clean reads remained after filtering (Table 2).
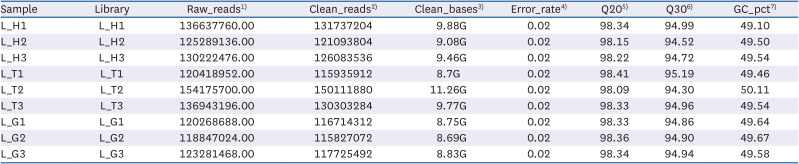
Table 2
Sample sequencing data quality summary
1)Raw_reads: The number of reads in the raw data.
2)Clean_reads: The number of filtered reads of the raw data.
3)Clean_bases: Base number of filtered raw data (clean base = clean reads * 150 bp).
4)Error_rate: Overall sequencing error rate of data.
5)Q20: Percentage of bases with phred value greater than 20 in total bases.
6)Q30: Percentage of bases with phred value greater than 30 in total bases.
7)GC_ Pct: Percentage of G and C in four bases of clean rea.
![]()
The principal component analysis (PCA) of the gene expression values (fragments per kilobase of transcript per million mapped fragments) of all samples was conducted to assess the differences between groups and the duplication of samples within groups. The samples between LH, LT and LG groups were dispersed, but the samples within groups were clustered together (Fig. 3A).
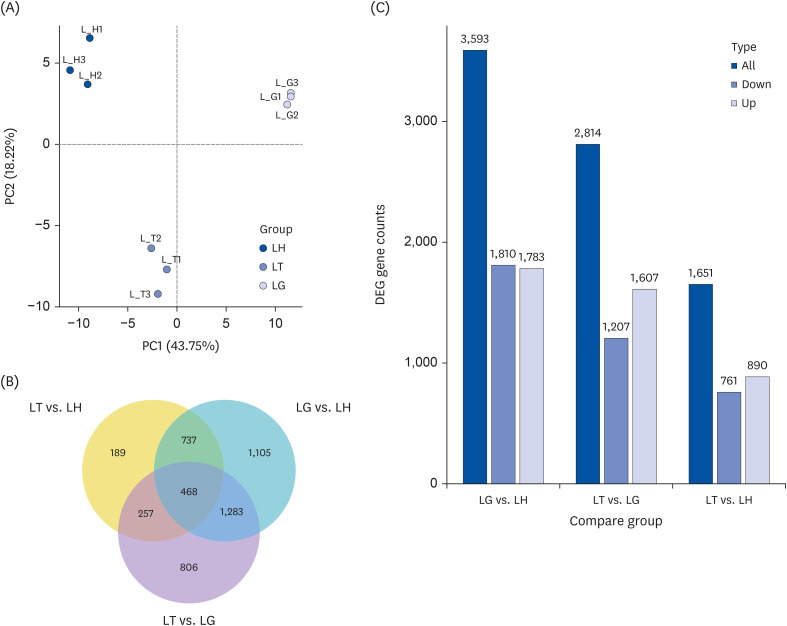 | Fig. 3Transcriptome analysis of mice liver. Mice liver type were divided into 3 groups: ddH2O group mice liver (LH), Tibetan tea extract group mice liver (LT), and green tea extract mice liver (LG). (A) Principal component analysis results. The abscissa is the first principal component, and the ordinate is the second principal component. (B) Venn diagram of coexpression. (C) Statistical histogram of the number of differentially compared genes in combination. Grey and blue represent up-regulated and down-regulated differential genes, respectively, and the numbers on the bars represent the number of differential genes.
|
Identification of the DEGs
The gene expression levels of LH, LT and LG were quantified, and the differences among the three groups were compared. The DEGs were obtained using the criteria: log2 (FoldChange) > 0 and padj < 0.05. A total of 1,651, 3,593 and 2,814 DEGs were identified in the LT vs. LH, LG vs. LH, and LT vs. LG groups, respectively (Fig. 3B). Among these DEGs, there were 189, 1,105 and 806 DEGs were unique to LT vs. LH, LG vs. LH, and LT vs. LG, respectively (Fig 3B). Moreover, 468 DEGs were commonly expressed in all groups (Fig. 3B).
DEGseq identified genes that were significantly upregulated or downregulated. Compared to the LH group, the LG group had 3,593 DEGs, of which 1,783 genes were upregulated and 1,810 downregulated; the LT group identified 1,651 DEGs, including 890 upregulated and 761 downregulated genes. Compared to the LG group, the LT group identified 2,814 DEGs, of which 1,607 genes were up-regulated and 1,207 down-regulated (Fig. 3C).
GO analysis for DEGs
GO enrichment analysis was conducted to further realize the biological functions of DEGs. DEGs were mainly enriched in monocarboxylic acid metabolic process, fatty acid metabolic process, lipid biosynthetic process, peroxisome, microbody, oxidoreductase activity, cellular response to hormone stimulus, blood microparticle, pyridoxal phosphate binding, etc. Obviously, “monocarboxylic acid metabolic process” in the GO category was the most sharply changed categories, and most of genes involved in fatty acid metabolic process and oxidoreductase activity (Fig. 4).
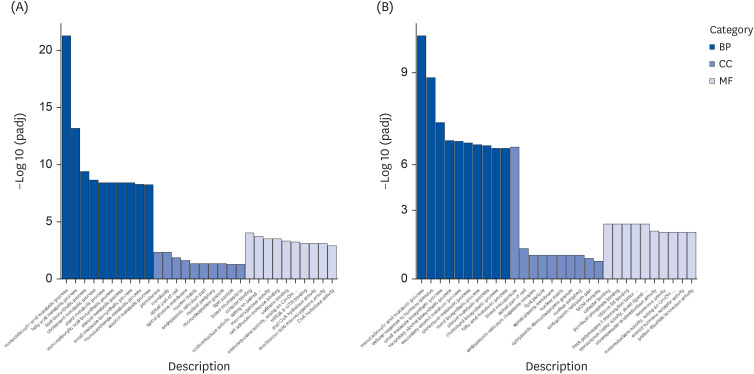 | Fig. 4GO enrichment analysis. The abscissa is the GO term, and the ordinate is the significance level of GO term enrichment. Mice liver type were divided into 3 groups: ddH2O group mice liver (LH), Tibetan tea extract group mice liver (LT), and green tea extract group mice liver (LG). (A) LG vs. LH. (B) LT vs. LH.GO, Gene Ontology; BP, biological process; CC, cellular component; MF, molecular function.
|
Pathways responsive to TTE and GTE treatments
The potential mechanism of beneficial effects of TTE and GTE on mice was revealed by using clusterProfiler R package for KEGG enrichment analysis. Pathway enrichment analysis showed that DEGs between H vs. T and H vs. G groups were associated with maturity onset diabetes of the young, P53 signaling pathway, insulin resistance, fatty acid elongation, peroxisome, fatty acid metabolism, Insulin signaling pathway, cholesterol metabolism, peroxisome proliferator-activated receptor (PPAR) signaling pathway, fat digestion and absorption, cysteine and methionine metabolism, retinol metabolism, etc. (Fig. 5). It is notable that most of these pathways are related to lipid metabolism and antioxidant activity.
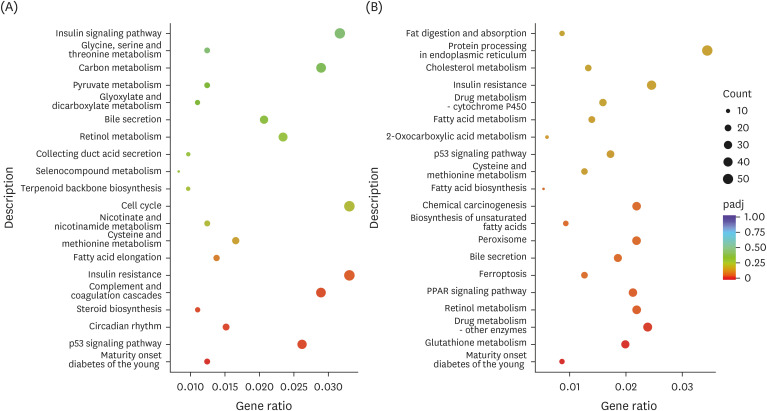 | Fig. 5KEGG pathway enrichment analysis. The abscissa is the ratio of the number of differential genes annotated in the KEGG pathway to the total number of differential genes, and the ordinate is the KEGG pathway. Mice liver type were divided into 3 groups: ddH2O group mice liver (LH), Tibetan tea extract group mice liver (LT), and green tea extract group mice liver (LG). (A) LT vs. LH. (B) LG vs. LH.KEGG, Kyoto Encyclopedia of Genes and Genomes.
|
Genes involved in lipid metabolism and antioxidant pathways
Antioxidant and lipid metabolism signaling pathway related genes (Cu/Zn-SOD, Mn-SOD, GSH-Px, PPAR-α, LDLR, CPT-1a, C/EBP-α, FAS, SREBP-1c) were quantified using Q-PCR. After treatment with Tibetan tea, the Cu/Zn-SOD, Mn-SOD, GSH-Px expressions were significantly increased to 2.97-, 2.44-, 4.30-fold compared to mice in LH group (P < 0.01). And Cu/Zn-SOD, Mn-SOD and GSH-Px were upregulated to 3.13-, 2.21-, 3.33-fold in green tea-treated mice (Fig. 6). In addition, the Tibetan tea and green tea-treated mice exhibited higher expressions of PPAR-α (4.30- and 3.33-fold), LDLR (3.29- and 3.38-fold) and CPT-1a (2.75- and 3.59-fold) and lower expressions of C/EBP-α (0.44- and 0.47-fold), FAS (0.58- and 0.45-fold), SREBP-1c (0.52- and 0.25-fold) (Fig. 6).
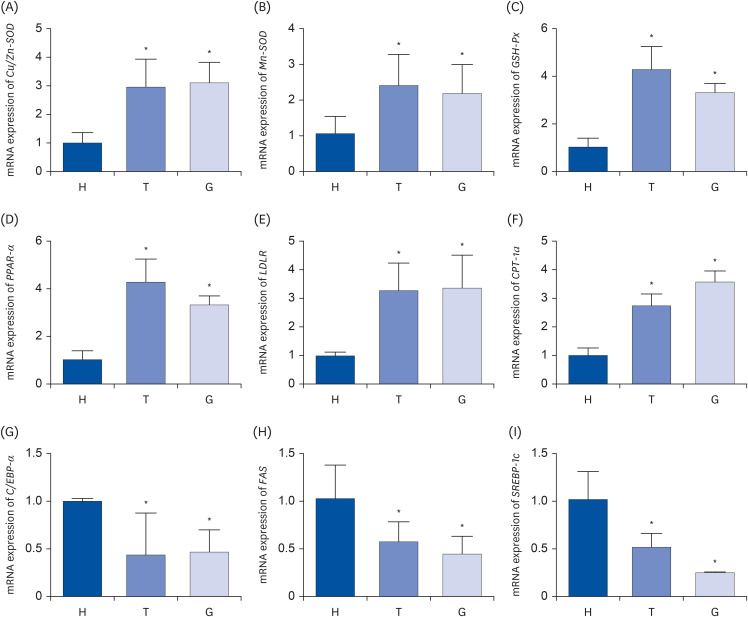 | Fig. 6The relative mRNA expression levels of Cu/Zn-SOD (A), Mn-SOD (B), GSH-Px (C), PPAR-α (D), LDLR (E), CPT-1a (F), C/EBP-α (G), FAS (H), SREBP-1c (I) in liver tissues. Mice were randomly divided into 3 experimental groups: ddH2O group (H), Tibetan tea extract group (T), and green tea extract group (G). Bar graphs depicting the mean ± standard deviation mRNA expression levels of antioxidant genes and lipid metabolism related genes in liver tissue of male C57BL/6J mice. Antioxidant genes: Cu/Zn-SOD (A), Mn-SOD (B), GSH-Px (C); lipid metabolism related genes: PPAR-α (D), LDLR (E), CPT-1a (F), C/EBP-α (G), FAS (H), SREBP-1c (I).
Cu/Zn-SOD, copper/zinc superoxide dismutase; Mn-SOD, manganese superoxide dismutase; GSH-Px, Plasma glutathione peroxidase; PPAR-α, peroxisome proliferator-activated receptor alpha; LDLR, low-density lipoprotein receptor; CPT-1a, carnitine palmitoyltransferase-1a; C/EBP-α, CCAAT/enhancer binding proteins alpha; FAS, fatty acid synthase; SREBP-1c, sterol regulatory element-binding protein-1c.
*P < 0.05 vs. H group.
|
Go to :
DISCUSSION
Tibetan tea is known to possess unique raw materials and origins may results in significant variations in composition. Due to the inherent complexity of plant metabolic components, the chemical space of Tibetan tea has not been fully deciphered. In this study, the KGMN technique was used for the first time to characterize the composition of Tibetan tea. Interestingly, a total of 44 flavonoid components were annotated for the first time, most of which were glycosylated forms. Flavonoids are crucial active ingredients in dark tea, with a variety of biological activities such as antioxidant and anti-aging. During the solid-state fermentation of dark tea, flavonoid undergo a variety of structural modification reactions, such as methylation, hydroxylation, glycosylation, condensation and oxidation [17]. They can also react with amino acids, saccharides, lipids and proteins, to produce more complex thearubigins [18]. Similar to the earlier findings, many glycosylated flavonoids such as apigenin 7-O-beta-glucoside, naringenin 7-O-beta-glucoside, kaempferol 3-O-glucoside, and rutin, etc. were clearly observed in Tibetan tea in the present study. Microbial extracellular enzymes such as cellulases show great potential in catalyzing the glycosylation of flavonoids in dark tea. However, it has also been reported that during the fermentation of Pu-erh tea, the glycoside bonds structures of flavonoid glycosides was hydrolyzed into aglycones and corresponding sugar moieties by microorganisms [19]. These diverse flavonoid components in Tibetan tea may be closely associated with their biological activities on metabolic disorders, such as cardiovascular disease, cancer, obesity, and diabetes. Additionally, flavonoids serve as antioxidants which modulate oxidative stress in the body by neutralizing the effect of nitrogen and oxygen species, thus preventing the disease [20]. The main differences between Tibetan tea and green tea lie in the pile-fermentation process used during their production. Enzymes and microorganisms transform the composition of the tea during this step, which takes place under conditions of high temperature and humidity. These changes result in alterations to the flavor profile and probiotic effects of the tea. In this study, green tea sourced from the same production region and made from the same raw materials was used as a comparison to investigate the influence of the pile-fermentation process on Tibetan tea.
Metabolic activities generate free radicals that are responsible for aging and oxidative stress-related diseases. Molecules with antioxidant properties are required to prevent or reduce the oxidative damage caused by these free radicals [2122]. Antioxidant function can maintain the oxidation/antioxidant balance of the body, neutralize the free radicals, reduce the damaging effects of the free radicals, can effectively improve the disease resistance of the body, and may have multiple associated health functions [2324]. Antioxidant effects mainly depends on the activities of antioxidant enzymes such as SOD, GSH-Px, CAT, etc. Mn-SOD and Gu/Zn-SOD are SOD isomers. Mn-SOD is an SOD radical scavenger in the mitochondria. Gu/Zn-SOD is an SOD free radical scavenger in the cytoplasm and takes Cu2+ and Zn2+ as its active center. In addition, the activity level of T-AOC can reflect the activity of antioxidant enzymes and the functional status of antioxidant system, and it is an important indicator to measure the antioxidant capacity in the body [25]. In this study, TTE significantly increased the antioxidant activities in mice by enzyme activity measurement and qPCR analysis, which indicated that Tibetan tea has good antioxidant effects. In this study, we investigated the effect of TTE on the antioxidant activities in mice using enzyme activity measurement and qPCR analysis. The results showed that TTE significantly increased the antioxidant activities in mice, indicating its potent antioxidant effects.
The comparative transcriptomic analysis further revealed the underlying molecular mechanism of antioxidant of 2 types of tea. Accordingly, the KEGG enrichment analysis of mice liver tissue transcriptome showed that the P53 signaling pathway had undergone significant changes between LT and LH groups. The P53 pathway is a complex network of cellular stress responses with many different downstream inputs and outputs associated with its role as a tumor suppressor pathway [26]. P53 is a tumor suppressor gene and is currently recognized as a pro apoptotic gene. It is the guardian of cell division, development and apoptosis, and plays a significant role in regulating the cell cycle and apoptosis as well as in the cellular response to DNA damage [27]. Therefore, we believe that the P53 signaling pathway may be involved in the senescence and apoptosis of liver tissue cells. Intracellular metabolism of reactive oxygen species (ROS) is at least partly regulated by P53. The P53 promotes antioxidant activity at low levels of oxidative stress and ultimately enhances survival. However, it can also suppresses the expression of antioxidant genes and leads to an increase in ROS. Notably, P53 may represses the transcription of the SOD2 gene (encoding mitochondrial or manganese superoxide dismutase), as well as several stage 2 antioxidant response genes, namely NAD(P)H quinone oxidoreductase, glutathione-S-transferase and cystine-glutamate transporter. In addition, P53 also represses the expression of SOD2 and antioxidant response genes under physiological conditions, suggesting that the role of low P53 activity in normal cortical neurons is primarily pro-oxidant. Under pathological conditions, the redox balance shifts further towards a more pro-oxidant state when p53 is activated [28]. It could be seen that Tibetan tea had a certain antioxidant activity in the body.
Obesity is defined as a major metabolic disease closely associated with serious health problems, such as hyperglycaemia, type 2 diabetes, cancer, hepatic steatosis, atherosclerosis, insulin resistance and cardiovascular disease, and has been a major research problem worldwide in recent years [29]. Multiple studies have suggested that drinking tea is associated with a lower risk of obesity and metabolic disorders [30]. In recent years, many epidemiological, animal, and clinical studies have shown that the six teas can regulate lipid metabolism and have significant lipid-lowering and weight-loss effects [3132]. They can not only reduce blood lipids, but also reduce the lipids of other organs and tissues such as liver and kidney, to inhibit the occurrence and development of obesity and hyperlipidemia and reduce the incidence and mortality of various cardiovascular and cerebrovascular diseases such as atherosclerosis and coronary heart disease. [3334]. At present, green tea catechin affects the activity of sympathetic nervous system, increases energy consumption, and promotes lipid oxidation. This effect leads to other mechanisms such as changes in appetite, increased enzyme activity of liver lipid metabolism, and reduced nutrient absorption [35]. During the experimental period, the mice in the Tibetan tea and green tea treatment groups had lower body weight gain than that of the H group, probably because of the lipid-reducing effects of the tea. Liver is the central organ of lipid metabolism pathway, and all kinds of pathways in the body are partially carried out in the liver [36]. In lipid metabolism, the liver secretes a variety of lipid metabolism enzymes, lipoproteins, and apolipoproteins. Tibetan tea contains a certain amount of theabrownine, which has been found to reduce the activity of fatty acid synthase in the liver, inhibiting the biosynthesis of fatty acids. Additionally, it increases the expression of sensitive lipase activity in adipose tissue, promoting the degradation of lipids, especially triglycerides in mice [3738]. Notably, a total of 44 flavonoids from Tibetan tea were annotated in present study, including the common catechins and epigallocatechin. It has been found that the mechanism of lipid-lowering effects by flavonoids may be mainly related with regulation of intestinal lipid absorption and lipid metabolism in the liver. Moreover, sterol regulatory element binding proteins (SREBPs) play a key role in the regulation processes as well as PPARs and liver X receptors.
Through KEGG enrichment analysis, we found significant changes between the H group vs. T group in several lipid metabolism pathways including insulin signaling pathway, fatty acid elongation, insulin resistance, steroid biosynthesis. Among them, insulin is involved in the generation of newly formed fat in the liver. Insulin resistance can over stimulate the de novo lipogenesis (DNL) and lead to ectopic deposition of liver lipids, which is regulated by a series of enzymatic reactions. The insulin signaling pathway activates AKT, increasing the activity of its downstream effector mammalian target of rapamycin, and then promotes the activation of SREBP-1c. SREBP-1c is an important transcription factor of DNL, which combines with target genes such as fatty acid synthetase (FAS), acetyl-CoA carboxylase, and stearyl-CoA decarboxylase to promote the biosynthesis of fatty acids and triglycerides. PPAR can activate carnitine palmitoyl transferase 1, thus promoting fatty acids to enter mitochondria and be oxidized. When PPAR signaling pathway is damaged, fatty acid oxidation decreases, and lipid accumulates in the liver, leading to insulin resistance. PPAR-α activation can reduce the accumulation of lipids in the liver by promoting cholesterol metabolism and reducing triglyceride synthesis, down-regulating total cholesterol and triglyceride levels in serum [39]. The qPCR results further verified that among six lipid metabolism signaling pathway-related genes (PPAR-α, LDLR, CPT-1a, C/EBP-α, FAS, SREBP-1c), compared with the control group, Tibetan tea-treated mice exhibited higher expression of PPAR-α, LDLR, and CPT-1a, while the expressions of C/EBP-α, FAS, and SREBP-1c were decreased. The above results indicated that Tibetan tea has a certain lipid-lowering effect by regulating insulin and fat metabolism-related pathways in mice. Tibetan tea is a popular beverage that is often regarded as having medicinal properties. In this study, we focused on the potential health benefits of pile-fermented Tibetan tea. We have previously established animal models for several diseases, such as enteritis, Alzheimer’s disease, and thrombosis models. In future research, These disease models will be used to explore the specific beneficial effects of Tibetan tea.
In conclusion, this KGMN-based computational tool proved to process great potential in unraveling complex plant components, thus filling the knowledge gap of unexplored and partially discovered plant components. Future prospects will involve further mining and validation of these metabolic components using more refined algorithms. Two hundred forty-four ingredients, especially including 44 flavonoids, were annotated in Tibetan tea. Tibetan tea could significantly improve the activities antioxidation and lipid-lowering in mice, through regulating antioxidant and lipid metabolism related pathways, especially Insulin resistance, P53 signaling pathway, Insulin signaling pathway, fatty acid elongation, and fatty acid metabolism. Therefore, this study provided an experimental reference for the study of the health care mechanism of Tibetan tea.
Go to :
 XML Download