INTRODUCTION
METHODS
Study design
Statistical analyses
Population PD analysis
RESULTS
Table 1.
| Variable | Group C (n = 24) | Group N (n = 25) | P value |
|---|---|---|---|
| Age (yr) | 54.08 ± 12.05 | 54.52 ± 9.58 | 0.889 |
| Height (cm) | 157.48 ± 5.54 | 158.76 ± 4.94 | 0.400 |
| Weight (kg) | 61.69 ± 8.18 | 59.04 ± 6.96 | 0.229 |
| BMI (kg/m2) | 24.83 ± 2.90 | 23.43 ± 2.70 | 0.088 |
| Menopause (n) | 17 | 15 | |
| Total propofol* (mg) | 126.35 ± 26.91 | 117.06 ± 25.23 | 0.219 |
| Total propofol/weight† (mg/kg) | 2.06 ± 0.43 | 1.99 ± 0.38 | 0.539 |
| Total time‡ (min) | 12.37 ± 1.89 | 11.66 ± 2.15 | 0.226 |
| Neoadjuvant chemotherapy§ | |||
| AC | 9 | ||
| TC | 7 | ||
| TCHP | 7 | ||
| ED | 1 |
Values are presented as mean ± SD or number only. BMI: body mass index, AC: adriamycin + cyclophosphamide, TC: docetaxel + cyclophosphamide, TCHP: docetaxel + carboplatin + trastuzumab + pertuzumab, ED: epirubicin + docetaxel. Group C = patients who received neoadjuvant chemotherapy for the treatment of breast cancer. Group N = who had never received chemotherapy.
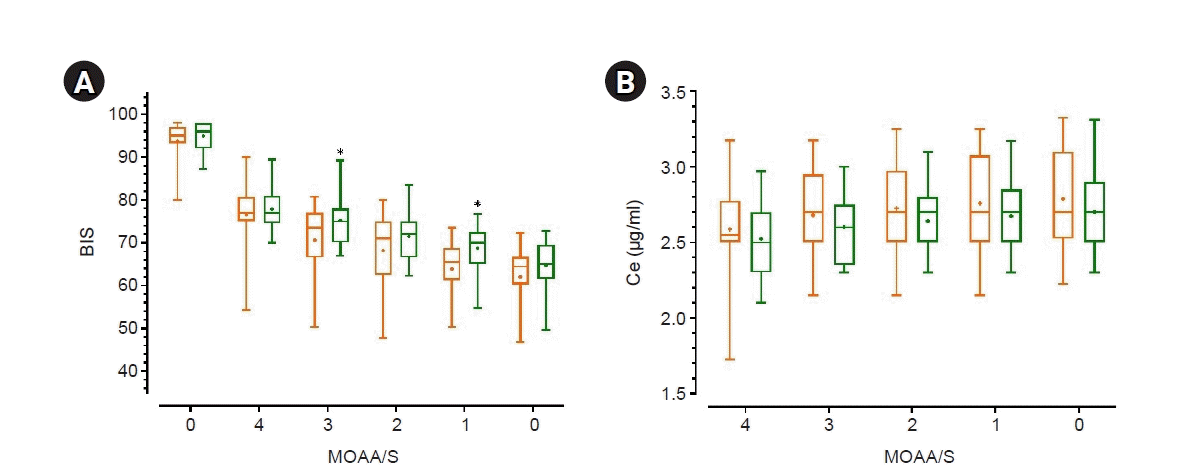
 | Fig. 1.(A) BIS value for each MOAA/S score (B) Ce of propofol for each MOAA/S score. Orange: group C (those who received neoadjuvant chemotherapy for the treatment of breast cancer), Green: group N (those who never received chemotherapy). In this box-and-whisker plot, the center line of the box represents the median value, whiskers are 2.5–97.5 percentiles, and the plus sign (+) represents the mean value. BIS: Bispectral Index, Ce: effect-site concentration of propofol, MOAA/S: Modified Observer’s Alertness/Sedation scale. *Group C vs. Group N, t-test, P value < 0.05. |
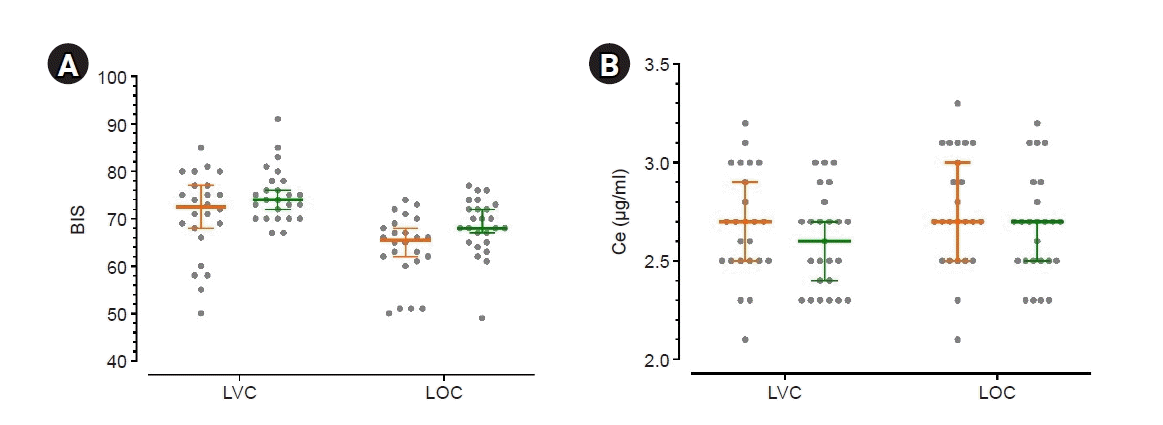
 | Fig. 2.(A) BIS values at LVC and LOC (B) Ce of propofol for LVC and LOC. Orange: group C (those who received neoadjuvant chemotherapy for the treatment of breast cancer), green: group N (those who never received chemotherapy), middle bold line and error bar: median and 95% CI, gray circle: individual’s value. BIS: Bispectral Index, Ce: effect-site concentration of propofol, CI: confidence interval, LVC: loss of verbal contact (when the Modified Observer’s Alertness/Sedation [MOAA/S] score was 3 or 2), LOC: loss of consciousness (when the MOAA/S score was 1 or 0). |
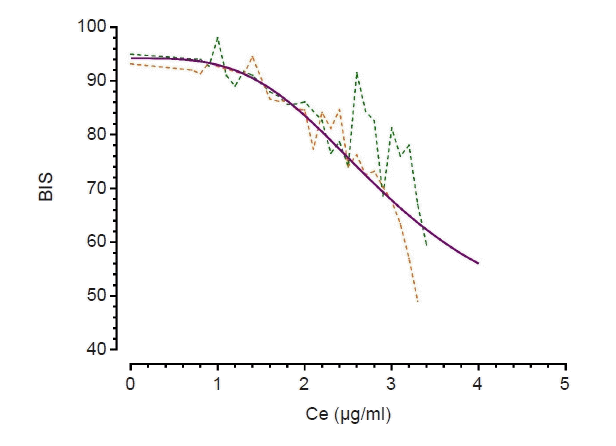
 | Fig. 3.Relationship between Ce of propofol and BIS. A dotted orange line is drawn with actual data obtained from group C, a dotted green line is drawn with actual data obtained from group N, and a purple line is drawn with calculated data based on the final PD model. Group C: those who received neoadjuvant chemotherapy for the treatment of breast cancer, Group N: those who never received chemotherapy, Ce: effect-site concentration of propofol, BIS: Bispectral Index, PD: pharmacodynamic. |
Table 2.
| Group C | Group N | P value | |
|---|---|---|---|
| LVC** | |||
| BIS | 70.79 ± 9.02 | 75.04 ± 5.69 | 0.053 |
| Ce | 2.68 ± 0.28 | 2.60 ± 0.24 | 0.268 |
| Time‡(min) | 8.69 ± 1.48 | 7.94 ± 1.43 | 0.076 |
| LOC† | |||
| BIS | 63.87 ± 7.04 | 68.44 ± 6.01 | 0.018 |
| Ce | 2.76 ± 0.29 | 2.67 ± 0.27 | 0.285 |
| Time (min) | 10.94 ± 1.63 | 10.25 ± 1.49 | 0.129 |
Table 3.
| Parameters |
All patients |
Group C |
Group N |
|||
|---|---|---|---|---|---|---|
| Estimate (RSE*) | Median (2.5%, 97.5%) of bootstrap | Estimate (RSE*) | Median (2.5%, 97.5%) of bootstrap | Estimate (RSE*) | Median (2.5%, 97.5%) of bootstrap | |
| Ce50 (4) | 2.29 (1.85) | 2.29 (2.23, 2.35) | 2.29 (3.21) | 2.28 (2.19, 2.39) | 2.28 (2.02) | 2.30 (2.24, 2.37) |
| Ce50 (3) | 2.51 (1.73) | 2.52 (2.46, 2.57) | 2.58 (2.48) | 2.58 (2.49, 2.67) | 2.45 (2.20) | 2.45 (2.39, 2.52) |
| Ce50 (2) | 2.69 (1.77) | 2.69 (2.62, 2.75) | 2.74 (2.36) | 2.74 (2.65, 2.82) | 2.62 (2.50) | 2.62 (2.54, 2.70) |
| Ce50 (1) | 2.97 (2.00) | 2.96 (2.89, 3.67) | 3.06 (2.97) | 3.05 (2.93, 3.15) | 2.86 (2.81) | 2.85 (2.75, 2.85) |
| Ce50 (0) | 3.54 (2.30) | 3.54 (3.45, 3.67) | 3.68 (4.67) | 3.66 (3.50, 3.89) | 3.37 (3.38) | 3.34 (3.19, 3.48) |
| γ | 9.93 (5.95) | 10.00 (8.73, 10.00) | 9.28 (15.84) | 9.74 (7.79, 10.00) | 11.10 (10.45) | 11.50 (10.00, 13.40) |
Values are presented as median (1Q, 3Q). Estimates of population PD parameters and median parameter values (2.5% and 97.5%) of nonparametric bootstrap replicates of the final PD model for each MOAA/S score. No interindividual random variability was assumed. Nonparametric bootstrap analysis was repeated 1,000 times. PD: pharmacodynamic, Ce: effect-site concentration, MOAA/S: Modified Observer’s Assessment of Alertness/Sedation, RSE: relative standard error. Group C = patients who received neoadjuvant chemotherapy for the treatment of breast cancer. Group N = never received chemotherapy. MOAA/S (n) = MOAA/S score equal to or less than a given level n. Ce50 (n) = Ce of propofol associated with 50% probability of MOAA/S (n). γ = slope steepness for the relationship of Ce vs. MOAA/S (n).
Table 4.
| Parameters |
Final model |
|
|---|---|---|
| Estimate (RSEײ) | Median (2.5%, 97.5%) | |
| E0* | 94.20 (1.10) | 93.80 (92.70, 94.70) |
| Emax† | 42.00 (11.57) | 43.50 (40.10, 65.41) |
| Ce50‡ | 2.98 (1.20) | 2.97 (2.22, 3.00) |
| γ§ | 3.41 (13.11) | 4.00 (3.18, 5.47) |
Values are presented as median (1Q, 3Q). Estimates of population PD parameters and median parameter values (2.5% and 97.5%) of the nonparametric bootstrap replicates of the final PD model for the relationship between the Ce of propofol and BIS values. No interindividual random variability was assumed. Nonparametric bootstrap analysis was repeated 1,000 times.
PD: pharmacodynamic, Ce: effect-site concentration, BIS: Bispectral Index, RSE: relative standard error. Group C = patients who received neoadjuvant chemotherapy for the treatment of breast cancer. Group N = patients who never received chemotherapy.


 PDF
PDF Citation
 Print
Print


 XML Download