INTRODUCTION
MATERIALS AND METHODS
Enrolled Population
Measurement of DD
Statistical Analysis
RESULTS
Patient Characteristics
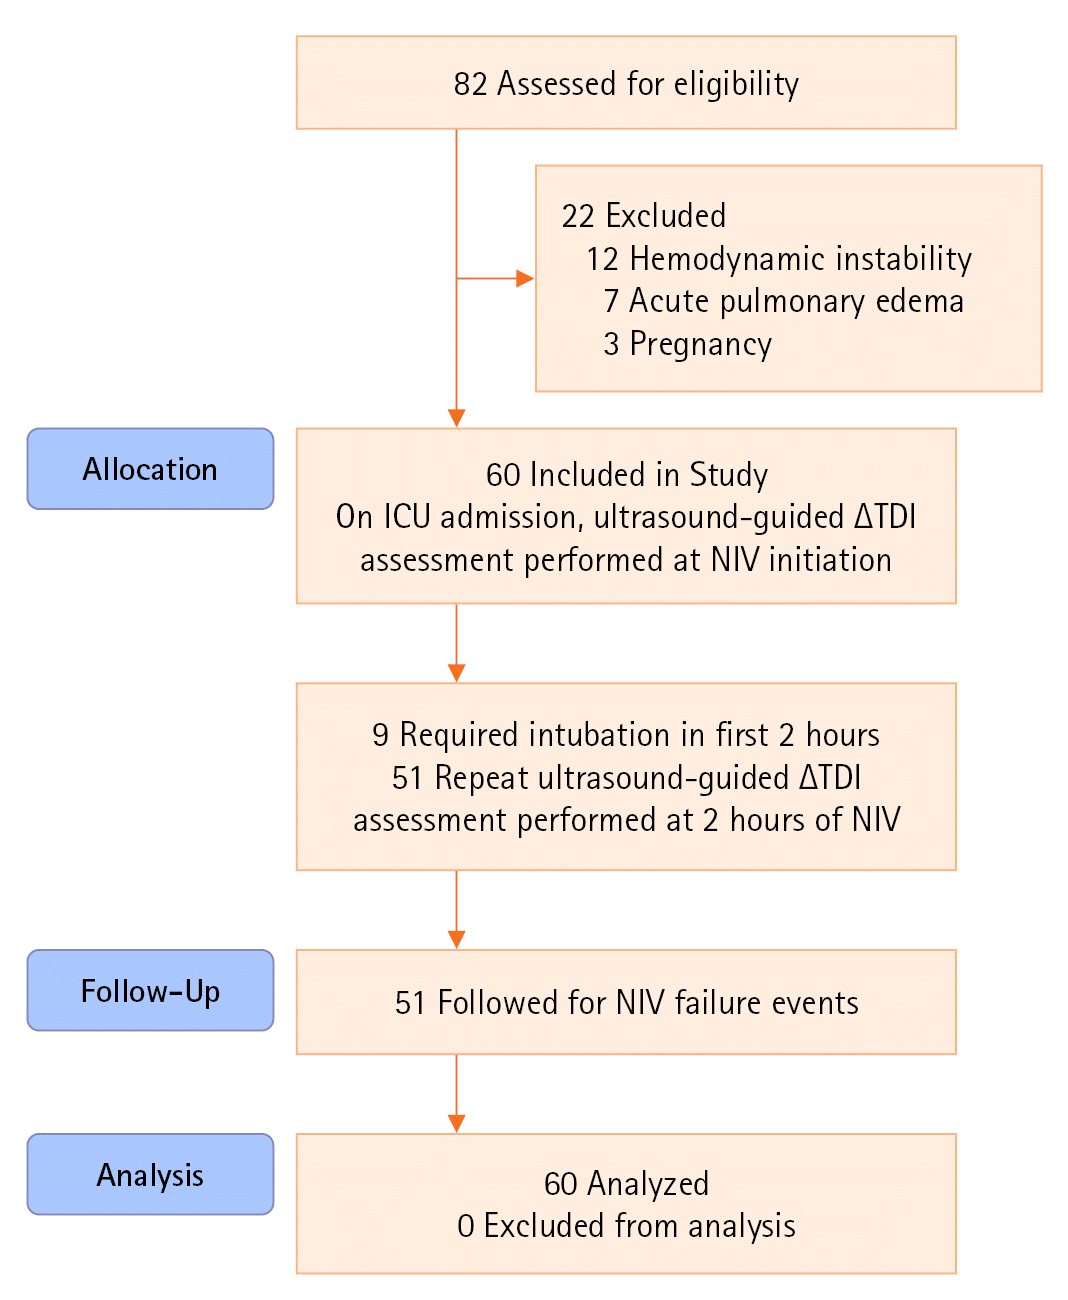
 | Figure 1.Strengthening the reporting of observational studies in epidemiology (STROBE) flow diagram of patients studied. ICU: intensive care unit; ∆TDI: change in diaphragmatic thickness; NIV: non-invasive ventilation. |
Table 1.
Values are presented as mean±standard deviation or number (%).
NIV: non-invasive ventilation; APACHE: Acute Physiology and Chronic Health Evaluation; SOFA: Sequential Organ Failure Assessment; ABG: arterial blood gas; ∆TDI: change in diaphragmatic thickness; T1: at NIV initiation; T2: at 2 hours of NIV; ICU: intensive care unit.
Comparison between NIV Success and Failure
DD Criteria to Predict NIV Failure
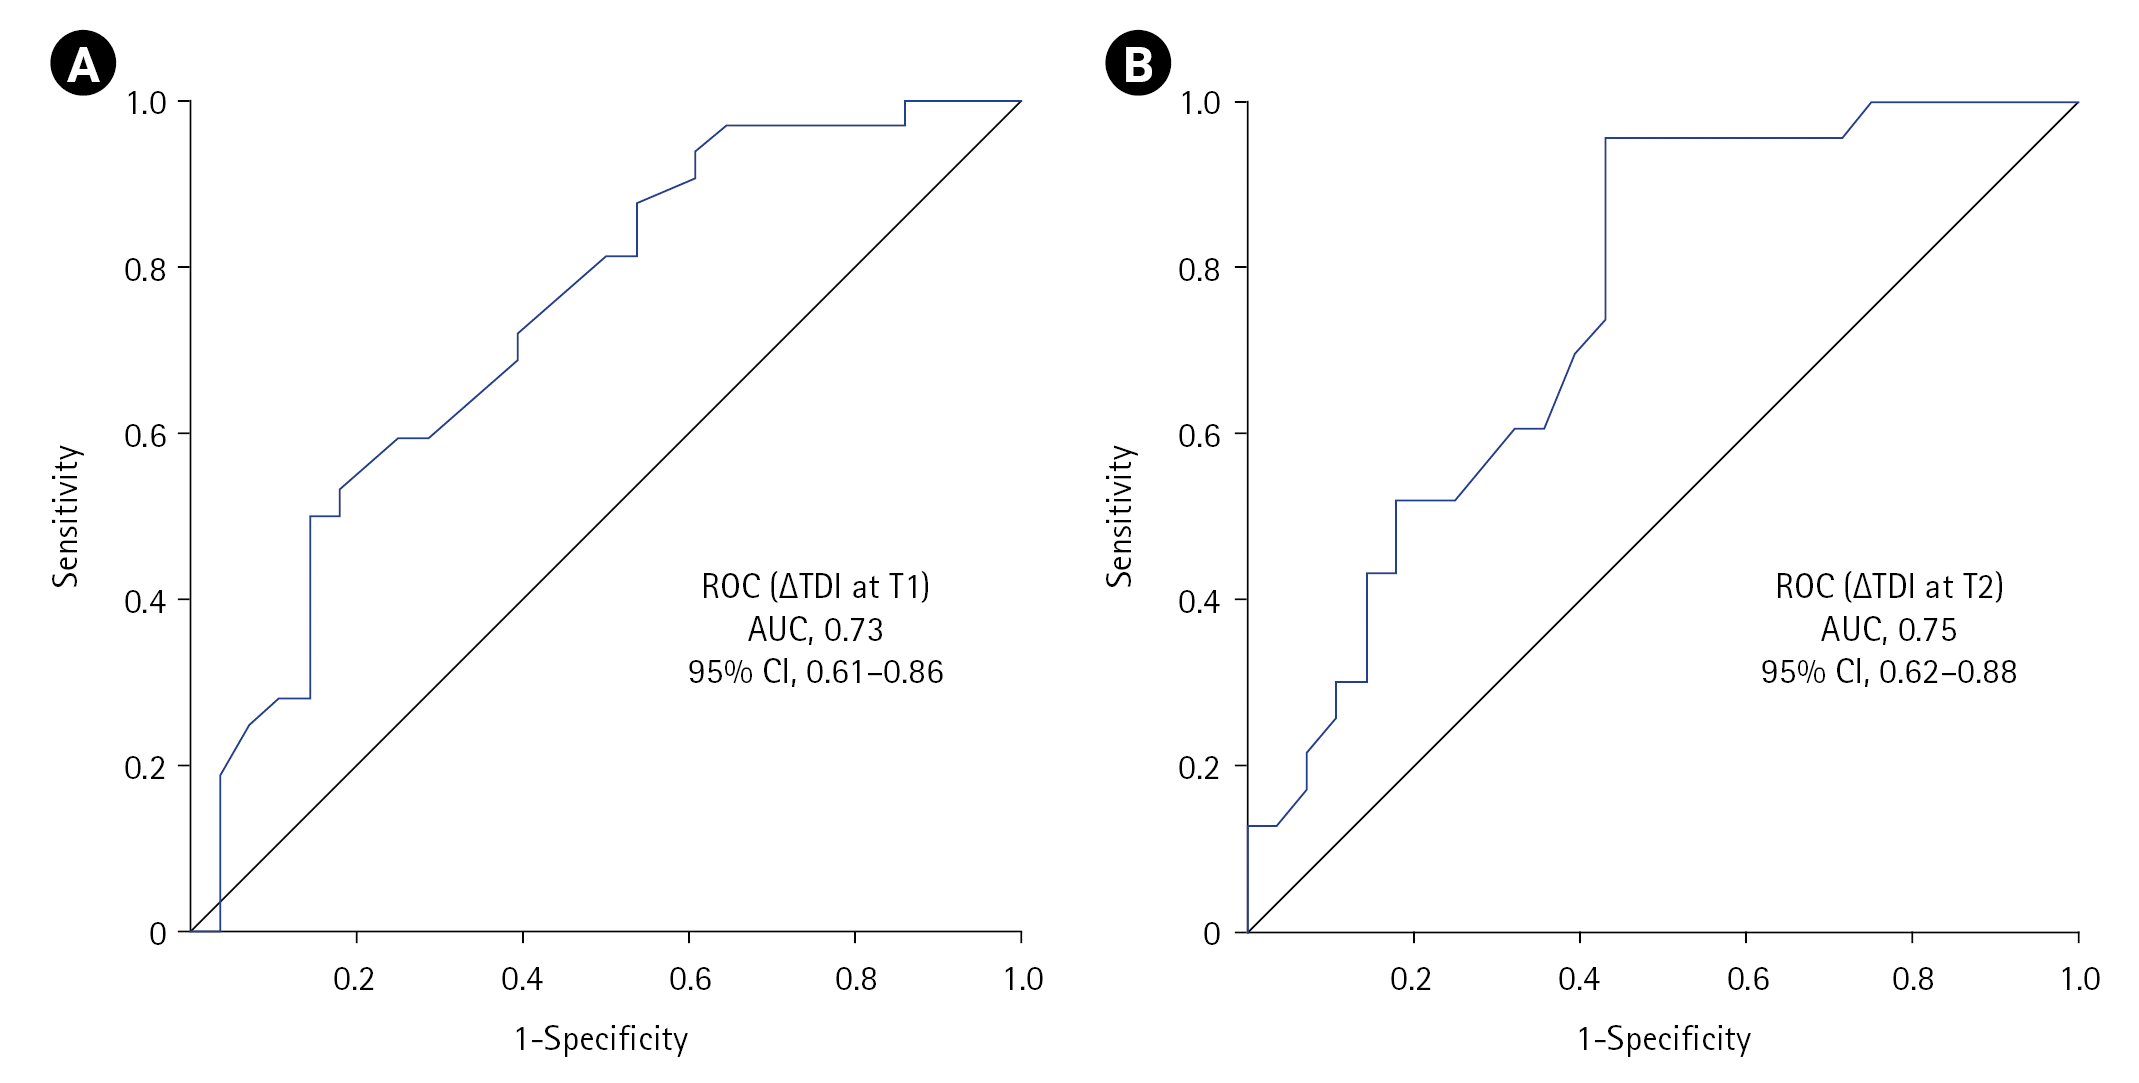
 | Figure 2.Receiver operating characteristic (ROC) curve showing the utility of diaphragmatic dysfunction in predicting non-invasive ventilation (NIV) failure at (A) T1 and (B) T2 timepoints. ∆TDI: change in diaphragmatic thickness; T1: at NIV initiation; T2: at 2 hours into NIV; AUC: area under the curve; CI: confidence interval. |
Table 2.
Table 3.
Covariates Predicting NIV Failure
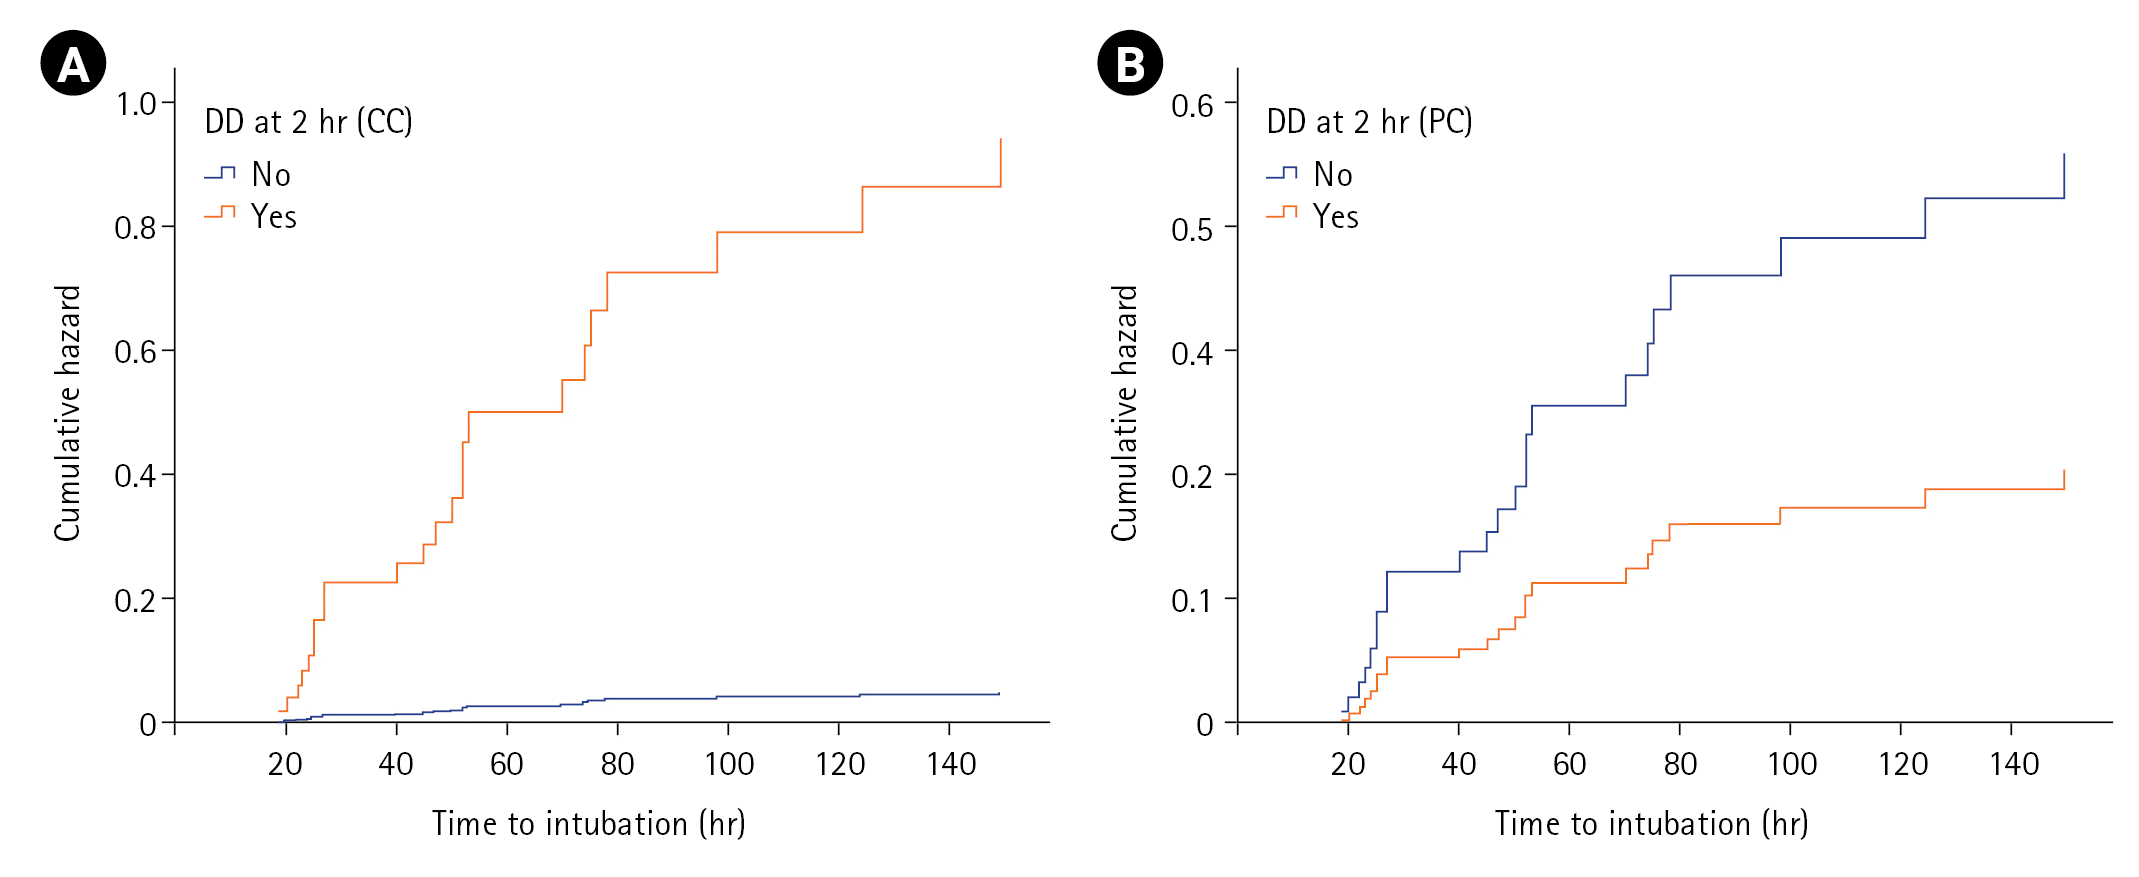
 | Figure 3.Cox-proportional hazards plot showing the cumulative hazard for intubation as predicted by diaphragmatic dysfunction (DD) at 2 hours of non-invasive ventilation using (A) calculated criterion (CC) and (B) predefined criterion (PC). |
Table 4.
| Variable | Univariate | Multivariate | ||||
|---|---|---|---|---|---|---|
| HR | 95% CI | P-value | HR | 95% CI | P-value | |
| T1 | ||||||
| Sex (male) | 2.57 | 1.15–5.73 | 0.021 | 2.14 | 0.95–4.95 | 0.067 |
| Hypertension | 0.35 | 0.13–0.91 | 0.031 | 0.39 | 0.14–1.13 | 0.083 |
| Baseline heart rate (bpm) | 1.03 | 1.0–1.05 | 0.011 | 1.03 | 1.01–1.06 | 0.011 |
| Baseline PaCO2 (mm Hg) | 0.97 | 0.95–1.0 | 0.041 | 0.98 | 0.95–1.01 | 0.151 |
| ∆TDI at T1 | 0.96 | 0.94–0.98 | 0.002 | 0.96 | 0.92–1.01 | 0.004 |
| DD at T1 (PC/CC) | 3.15 | 1.57–6.32 | 0.001 | 1.43 | 0.42–4.89 | 0.566 |
| T2 | ||||||
| Sex (male) | 2.62 | 1.03–6.66 | 0.043 | 2.88a) | 1.08–7.63a) | 0.034a) |
| 2.84b) | 1.05–7.66b) | 0.039b) | ||||
| Hypertension | 0.36 | 0.12–1.07 | 0.067 | - | - | - |
| Baseline heart rate (bpm) | 1.03 | 1.0–1.05 | 0.03 | 1.04a) | 1.01–1.07a) | 0.007a) |
| 1.04b) | 1.01–1.06b) | 0.005b) | ||||
| Baseline PaCO2 (mm Hg) | 0.97 | 0.95–1.0 | 0.07 | - | - | - |
| ∆TDI at T2 | 0.96 | 0.93–0.98 | 0.007 | 0.99a) | 0.95–1.04a) | 0.876a) |
| 0.92b) | 0.85–0.99b) | 0.040b) | ||||
| DD at T2 (CC) | 17.0 | 2.28–126.53 | 0.006 | 19.55a) | 2.08–84.07a) | 0.009a) |
| DD at T2 (PC) | 2.52 | 1.10–5.76 | 0.029 | 0.45b) | 0.07–2.74b) | 0.385b) |


 PDF
PDF Citation
 Print
Print


 XML Download