INTRODUCTION
MATERIALS AND METHODS
Statistical Analysis
RESULTS
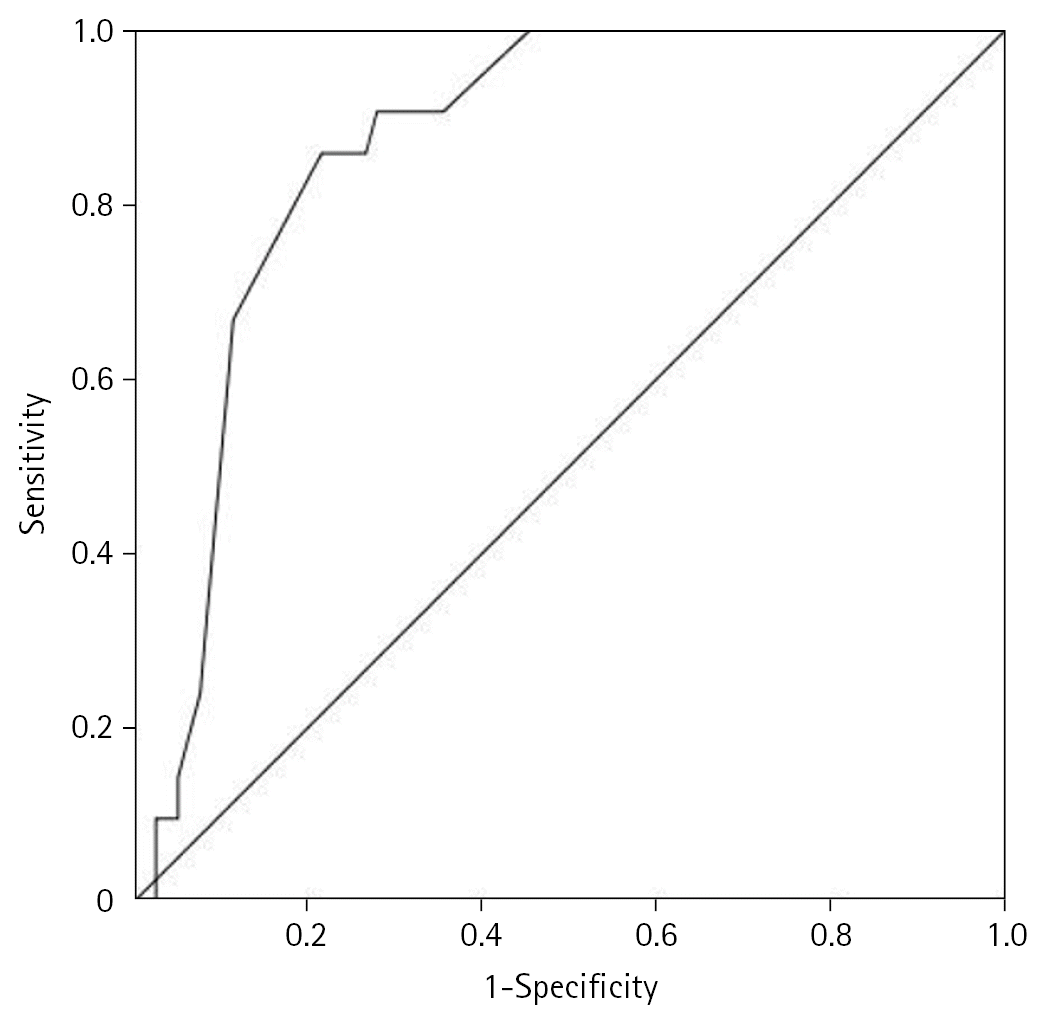
 | Figure 2.Receiver operating characteristic (ROC) analysis curve for the determination of intensive care unit mortality for chronic obstructive pulmonary disease patients with acute hypercapnic respiratory failure. Area under the ROC for Acute Physiology and Chronic Health Evaluation (APACHE) II score was 0.866 (95% confidence interval, 0.793–0.938; P<0.001) with sensitivity of 86% and specificity of 79%. |
Table 1.
| Parameter | Survivor (n=79) | Non-survivor (n=21) | P-value |
|---|---|---|---|
| Age (yr) | 70.7±9.1 | 74.9±8.9 | 0.071 |
| Male | 47 (59.5) | 12 (57.1) | 0.846 |
| Smoking | 48 (60.8) | 11 (52.4) | 0.488 |
| Active smoking | 22 (27.8) | 2 (9.5) | 0.093 |
| Indoor/outdoor pollutionb) | 26 (32.9) | 10 (47.6) | 0.212 |
| Long-term O2 therapy | 40 (50.6) | 11 (52.4) | 0.887 |
| Home-NIMV use | 32 (40.5) | 7 (33.3) | 0.549 |
| Comorbidity | |||
| Hypertension | 50 (63.3) | 14 (66.7) | 0.776 |
| Heart failure | 42 (53.2) | 10 (47.6) | 0.651 |
| Ischemic heart disease | 21 (26.6) | 6 (28.6) | 0.855 |
| Atrial fibrillation | 18 (22.8) | 9 (42.9) | 0.066 |
| Diabetes mellitus | 22 (27.8) | 7 (33.3) | 0.622 |
| CKD (stage 2–5) | 14 (17.7) | 6 (28.6) | 0.269 |
| Cerebrovascular disease | 7 (8.9) | 5 (23.8) | 0.122 |
| Tuberculosis | 8 (10.1) | 2 (9.5) | 0.935 |
| Cancerc) | 3 (3.8) | 6 (28.6) | <0.001 |
| Cause of respiratory failured) | |||
| Acute COPD exacerbation | |||
| Bronchitis | 37 (46.8) | 9 (42.9) | 0.596 |
| Non-compliance with therapy | 2 (2.5) | 0 | 1.000 |
| Pneumonia | 19 (24.1) | 12 (57.1) | 0.004 |
| Heart failure | 11 (13.9) | 0 | 0.365 |
| Surgery | 7 (8.9) | 0 | 0.340 |
| Urosepsis | 2 (2.5) | 0 | 1.000 |
| Pulmonary embolism | 1 (1.3) | 0 | 1.000 |
| APACHE II score | 21.2±6.9 | 29.5±3.8 | <0.001 |
| GCS | 12.1±3.8 | 10.1±3.6 | 0.010 |
| IMV | 25 (31.6) | 18 (85.7) | <0.001 |
| NIMV | 76 (96.2) | 14 (66.7) | 0.001 |
| Shocke) | 13 (16.5) | 12 (57.1) | <0.001 |
| Renal replacement therapyf) | 2 (2.5) | 7 (33.3) | <0.001 |
| Vasopressorg) | 16 (20.3) | 18 (85.7) | <0.001 |
| ICU stay (day) | 6 (4–9) | 14 (4–26) | 0.006 |
| Hospital stay (day) | 10 (7–14) | 15 (10–28) | 0.044 |
Values are presented as mean±standard deviation, number (%), or median (interquartile range).
NIMV: non-invasive mechanical ventilation; CKD: chronic kidney disease; COPD: chronic obstructive pulmonary disease; APACHE: Acute Physiology and Chronic Health Evaluation; GCS: Glasgow coma score; IMV: invasive mechanical ventilation; ICU: intensive care unit.


 PDF
PDF Citation
 Print
Print


 XML Download